Behaviour of Capillary Barrier Covers Subjected to Rainfall with Different Patterns


1
Department of Civil Engineering, University of Shanghai for Science and Technology, Shanghai 200093, China
2
Key Laboratory of Geotechnical and Underground Engineering of Ministry of Education, Tongji University, Shanghai 200092, China
*
Author to whom correspondence should be addressed.
Water 2020, 12(11), 3133; https://doi.org/10.3390/w12113133
Submission received: 14 October 2020
/
Revised: 4 November 2020
/
Accepted: 6 November 2020
/
Published: 9 November 2020
(This article belongs to the Section Hydrology)
Abstract
:The behaviour of capillary barrier covers (CBCs) subjected to rainfall has been extensively studied by many researchers. However, the patterns of rainfall are seldom considered in previous studies, and therefore, the behaviour of CBCs subjected to rainfall with different patterns is still unknown. To this end, this study aims to investigate the effect of rainfall patterns on the behaviour and performance of CBCs, and identify the rainfall pattern, under which the performance of the CBC is the worst. Using a newly developed soil column test apparatus, a series of laboratory soil column experiments were conducted. The results indicated that when rainfall duration is short, the patterns of rainfall only affect the volume water content (VWC) and pore water pressure (PWP) significantly at the upper part of the column; when rainfall duration is long, the patterns of rainfall can significantly affect the VWC and PWP throughout the whole column. The percolation and breakthrough time of the CBC were also influenced by rainfall patterns; the advanced rainfall pattern produced the largest percolation, and resulted in the shortest time for CBCs to break through, whereas the delayed rainfall pattern generated the least percolation and resulted in the longest time for CBCs to break through. Based on the percolation and breakthrough time, it seems that the advanced pattern is the worst-case scenario for the CBCs subjected to rainfall. The obtained results not only imply the necessity of rainfall patterns to be involved in the study of the CBCs subjected to rainfall but they also can be helpful for the practical design of the CBCs.
1. Introduction
Rainfall infiltration is a major cause of leachate generation in landfills. The generated leachate can contaminate soil and underground water, and thus pose a serious threat to the environment and public health. Therefore, covers are usually placed on top of landfills to control rainwater infiltration into the underlying waste to limit leachate production [1]. One of the most promising covers is the capillary barrier cover (CBC). A CBC is a two-layer unsaturated soil system consisting of a fine sand layer overlying a coarse sand layer [2,3], effectiveness of which depends on the capillary barrier effect that forms at the interface of the fine and coarse sand layers, to prevent rainwater infiltration into the coarse sand layer. Any infiltrating rainwater will be stored in the fine sand layer temporarily. If the capillary barrier effect disappeared, the infiltrating rainwater would flow through the interface into the coarse sand layer and subsequently penetrate the underlying waste. Therefore, the effectiveness of CBCs under rainfall conditions is of great importance for controlling leachate generation and reducing pollution of the surrounding environment, and thus is worthwhile to study.
The behaviour of CBCs subjected to rainfall is influenced by many factors, some of which have been mostly studied by researchers, e.g., rainfall intensity, rainfall duration, material properties, and slope angle etc. Yang [4] carried out laboratory soil column tests to evaluate the effect of rainfall intensity and duration on the behaviour of CBCs during rainfall infiltration, and revealed that rainfall intensity had a significant effect on the pore water pressure (PWP) and water content distribution in the upper fine sand layer of the CBC and has limited effect on that in the lower coarse sand layer. Ng [5] numerically investigated the factors that affect the behaviour of three-layer CBCs subjected to rainfall, and the results indicated that the percolation of the CBC was significantly influenced by both the rainfall duration and the saturation of the waste. McCartney [6] also conducted the laboratory soil column tests to study the performance of a geosynthetic capillary barrier under simulated rainfall and evaporation conditions, and they found that the volume water content (VWC) of the soil above the geocomposite drainage layer was significantly affected by the capillary barrier effect during the infiltration process. Zhang [7] examined the effect of moisture hysteresis on the performance of CBCs subjected to rainfall and concluded that the hysteresis of soils can significantly affect the pore water pressure distribution and breakthrough time of CBCs in numerical simulations. Rahardjo [8] investigated the effect of water entry value of the soils on the performance of CBCs, and they found that the larger the difference of the water entry value between the fine and coarse sand layers in CBCs, the more effective the CBCs will be, and the less percolation will be produced. Qian [9] conducted laboratory infiltration tests to investigate the factors that influence the performance of CBCs, and concluded that the efficiency of CBCs decrease with increasing rainfall intensity but increase with increasing thickness and slope of the underlying coarse sand layer of the CBC. The influence of slope angle on the behavior of three-layer CBCs was investigated by Chen [10], and they found that the larger the slope angle, the lower the VWC and matric suction will be in the upper layers of the CBCs.
As can be seen from the aforementioned studies, despite many influencing factors on the behaviour of CBCs subjected to rainfall have been studied, the patterns of rainfall, however, are seldom considered in the previous studies. For example, a uniform rainfall pattern with constant rainfall intensity was mostly assumed in laboratory infiltration tests (e.g., Yang [11], Stormont [12], Indrawan [13], Harnas [14], Coo [15], Ng [16]), physical models (e.g., Zhan [17], Ng [18]) and numerical simulations (e.g., Aubertin [19], Zhang [20], Li [21], Zhan [22]). However, rainfall intensity normally varies within rainfall duration in reality and exhibits different patterns (e.g., an advanced rainfall pattern, normal rainfall pattern and delayed rainfall pattern) [23,24,25,26,27,28]. Thus, whether and to what extent rainfall patterns influence the behaviour and performance of the CBCs are still unclear. Furthermore, it has remained unknown that under which rainfall pattern the performance of the CBCs is the worst and therefore results in the lack of a designing method that appropriately takes into account the worst rainfall condition [29,30].
To this end, the aim of this study is to investigate the behaviour of CBCs subjected to rainfall with different patterns, and subsequently, identify the rainfall pattern, under which the performance of the CBC subjected to rainfall is the worst. To achieve this goal, a series of laboratory infiltration tests were conducted in this study, and the results will be helpful for the practical design of the CBCs.
2. Methods and Materials
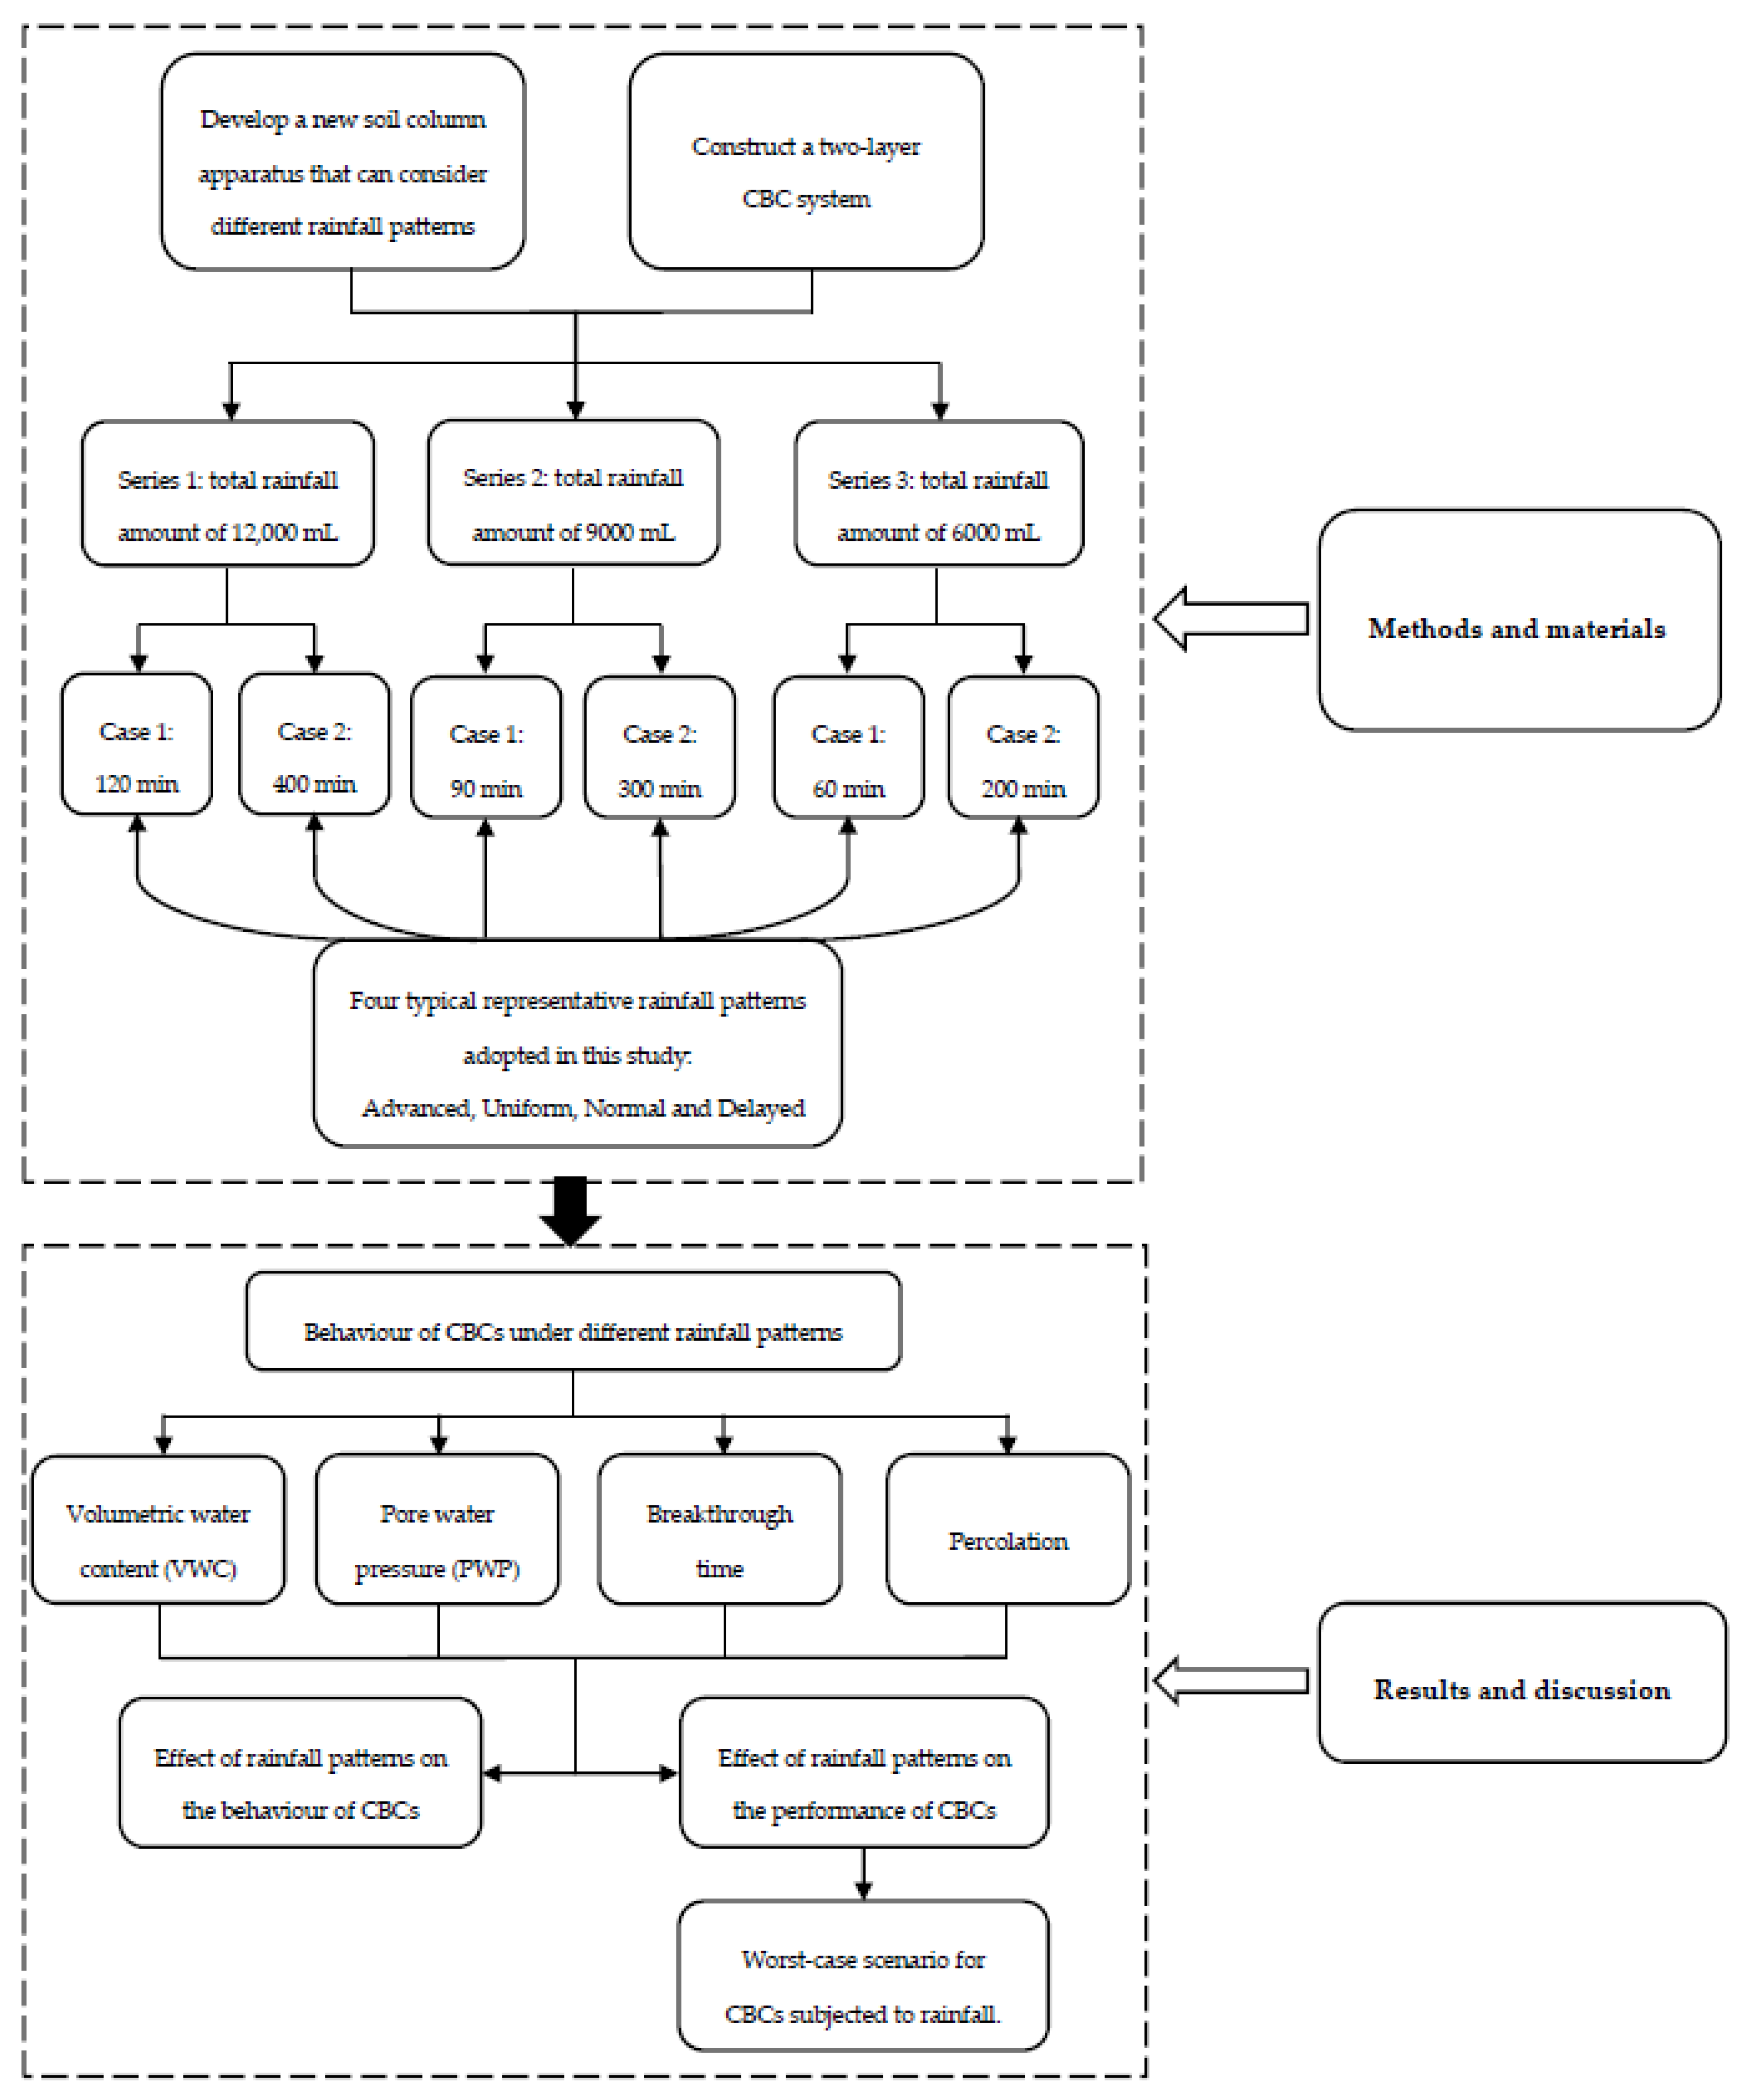
Figure 1 shows the procedure of this study. Firstly, a soil column apparatus that can consider different patterns of rainfall was developed in this study. Using this newly developed apparatus, three series of laboratory soil column tests with different total amounts of rainfall were conducted on a CBC system. In each series, two cases with different rainfall duration, were considered. In each case, the behaviour of the CBC under four representative rainfall patterns were examined, respectively. By comparing the behaviour of the CBC under different rainfall patterns, the effect of rainfall pattern on the behaviour and performance of the CBC were discussed and the most adverse rainfall pattern for the CBC subjected to rainfall was determined.
2.1. Materials
In this study, two types of soil, namely fine sand and gravelly sand, were used to construct a two-layer CBC in an infiltration column, as they were commonly adopted for CBC construction in previous studies [4,11,12,13]. The fine sand was a light brown construction sand and was used as the upper fine layer of the CBC. The gravelly sand was grey in colour and was used as the underlying coarse layer of the CBC. The two sand layers were all obtained commercially; their basic properties are summarised in Table 1. The particle-size distribution of the two sands was measured using the sieving method. Both sands have a uniform distribution in particle size. The fine sand has particles sized around 0.15 mm, and the gravelly sand particle size is distributed between 1 mm and 5 mm.
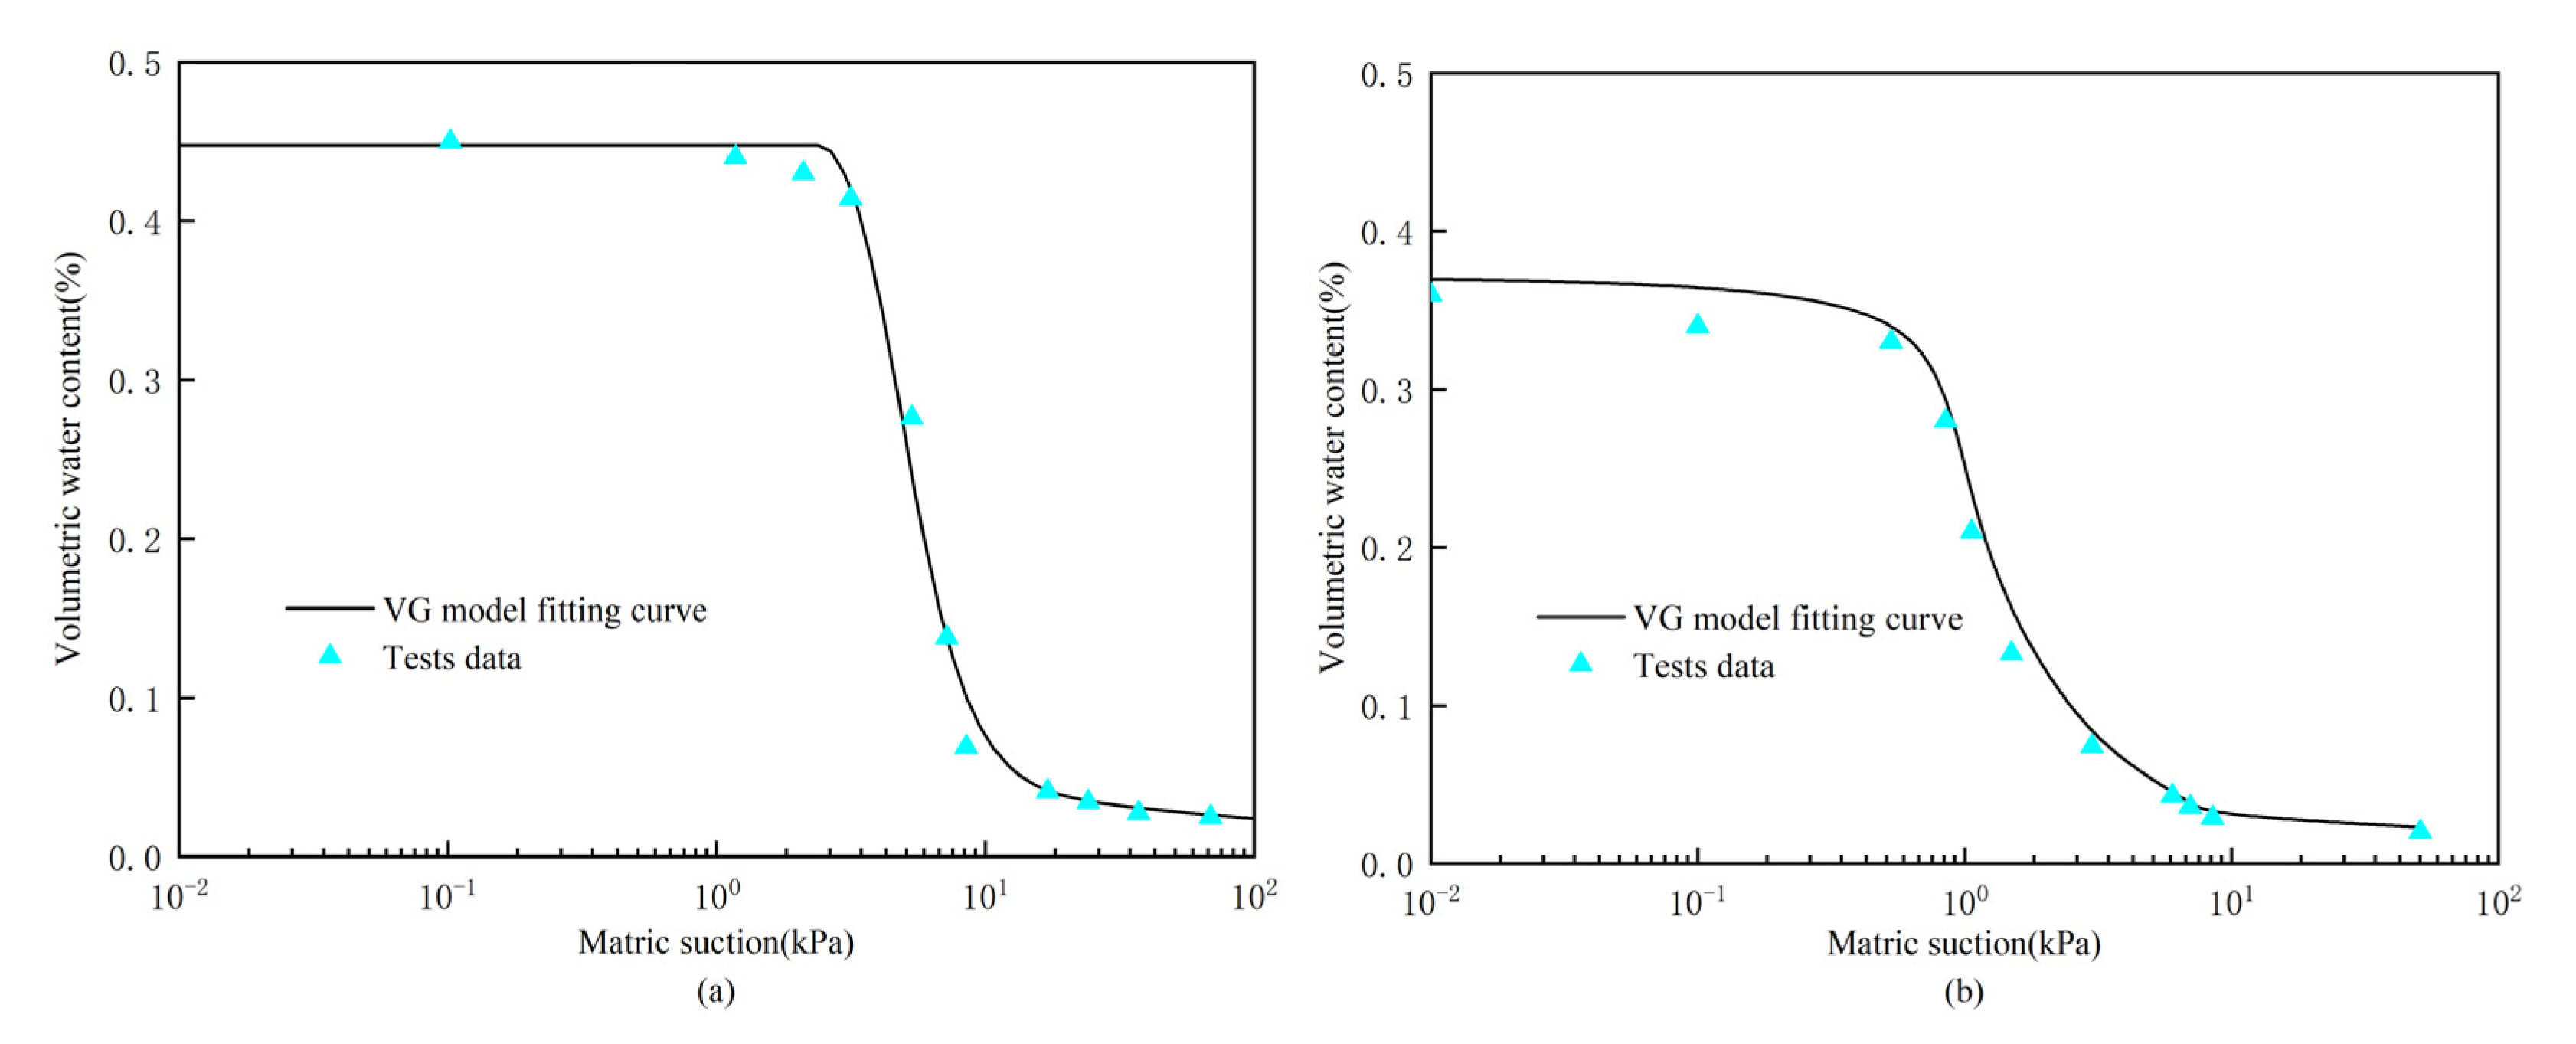
The soil water characteristic curve (SWCC) defines the relationship between volumetric water content and matric suction of the soil. In this study, the SWCCs along the wetting branch for the soils were measured using a capillary rise open tube, as it is consistent with the wetting condition during the rainfall infiltration tests. For detailed procedures of the capillary tube tests refer to Lambe [31], Lambe and Whitman [32], and Fredlund and Rahardjo [33]. Test data were fitted to the Van Genuchten (V-G) equation (Figure 2). The fitting parameters are listed in Table 2.
The saturated permeability for the fine sand and gravelly sand was measured in the laboratory using the constant head method as described in the standard of people’s republic of China [34]. The fine sand had a saturated permeability of 3.48 × 10⁻³ cm/s at a dry density of 1.38 g/cm3 and the gravelly sand had a saturated permeability of 5.63 × 10⁻¹ cm/s at a dry density of 1.53 g/cm3.
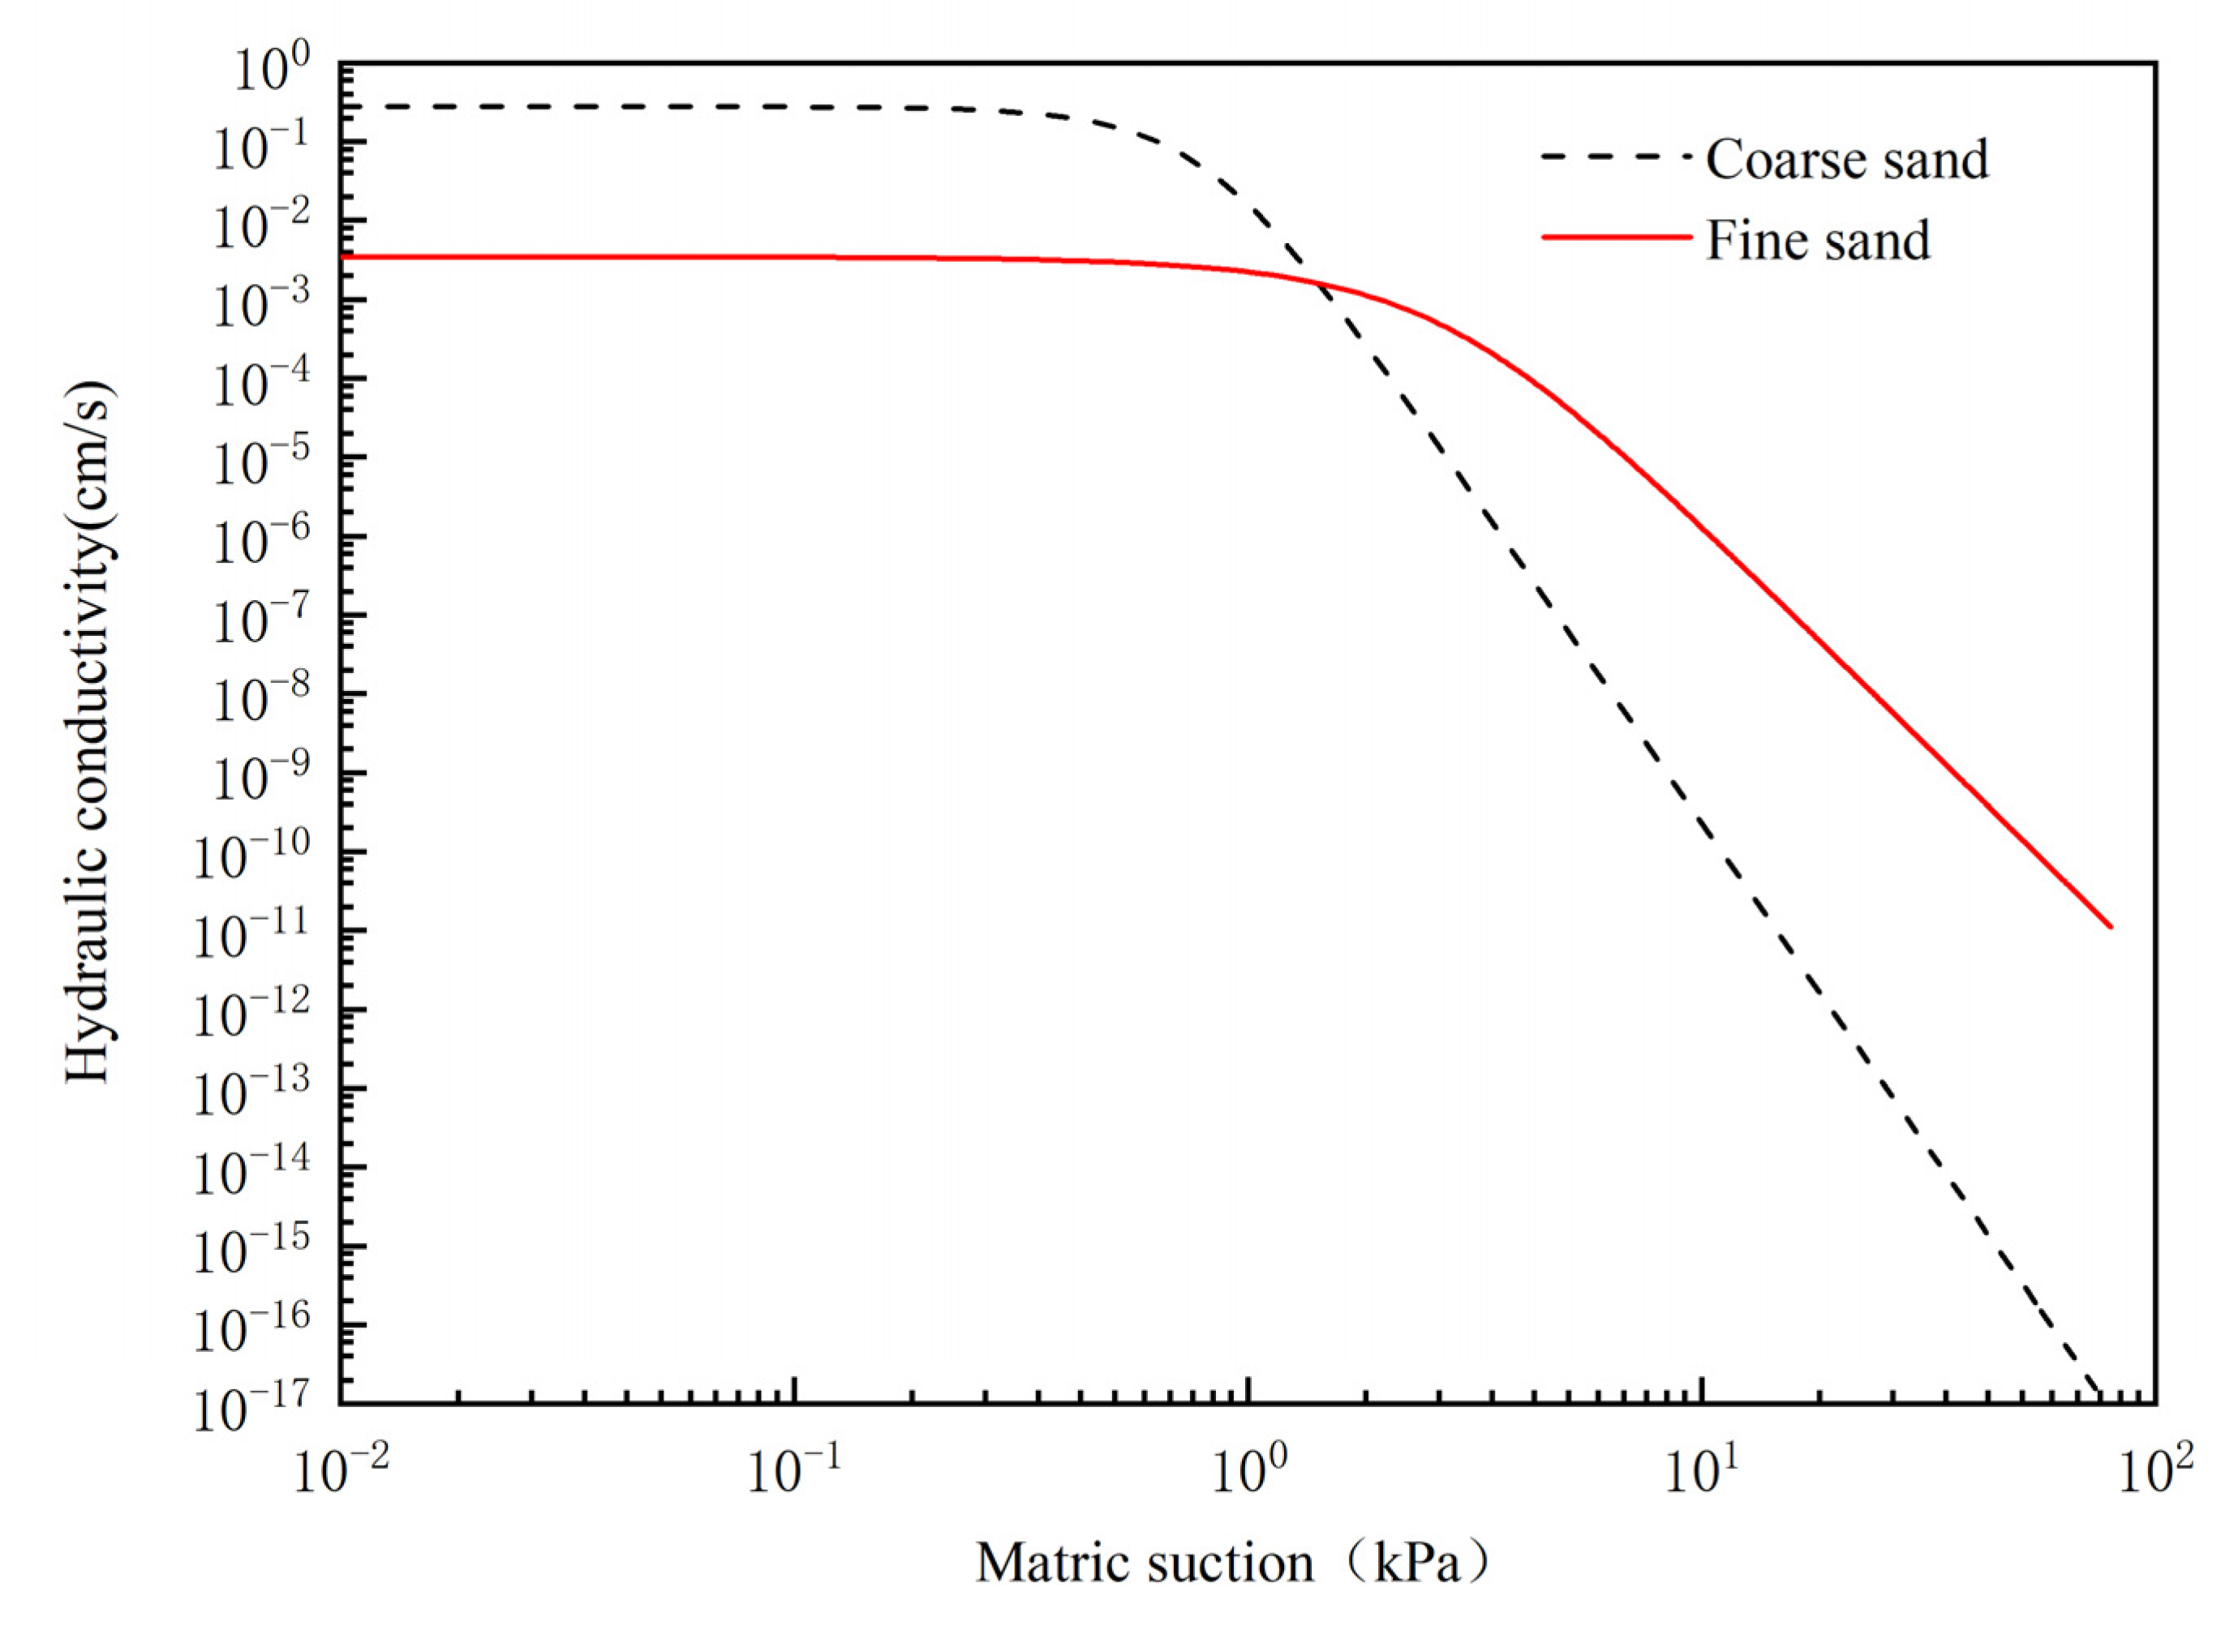
The unsaturated hydraulic conductivity function for the soils, which accounts for the variation of hydraulic conductivity with matric suction of the soil, were predicted using the SWCCs and saturated permeability of the soil using the Mualem [35] formulation. Figure 3 shows the unsaturated hydraulic conductivity functions for the fine and gravelly sand. As can be seen from Figure 3, when the matric suction is relatively high, the hydraulic conductivity of the gravelly sand is lower than that of the fine sand. Thus, the infiltrated rainwater can be impeded at the interface of the fine–coarse soil layer and stored temporarily in the fine sand layer [21]. This suggests that the adopted materials are suitable for constructing a CBC system.
2.2. Test Apparatus
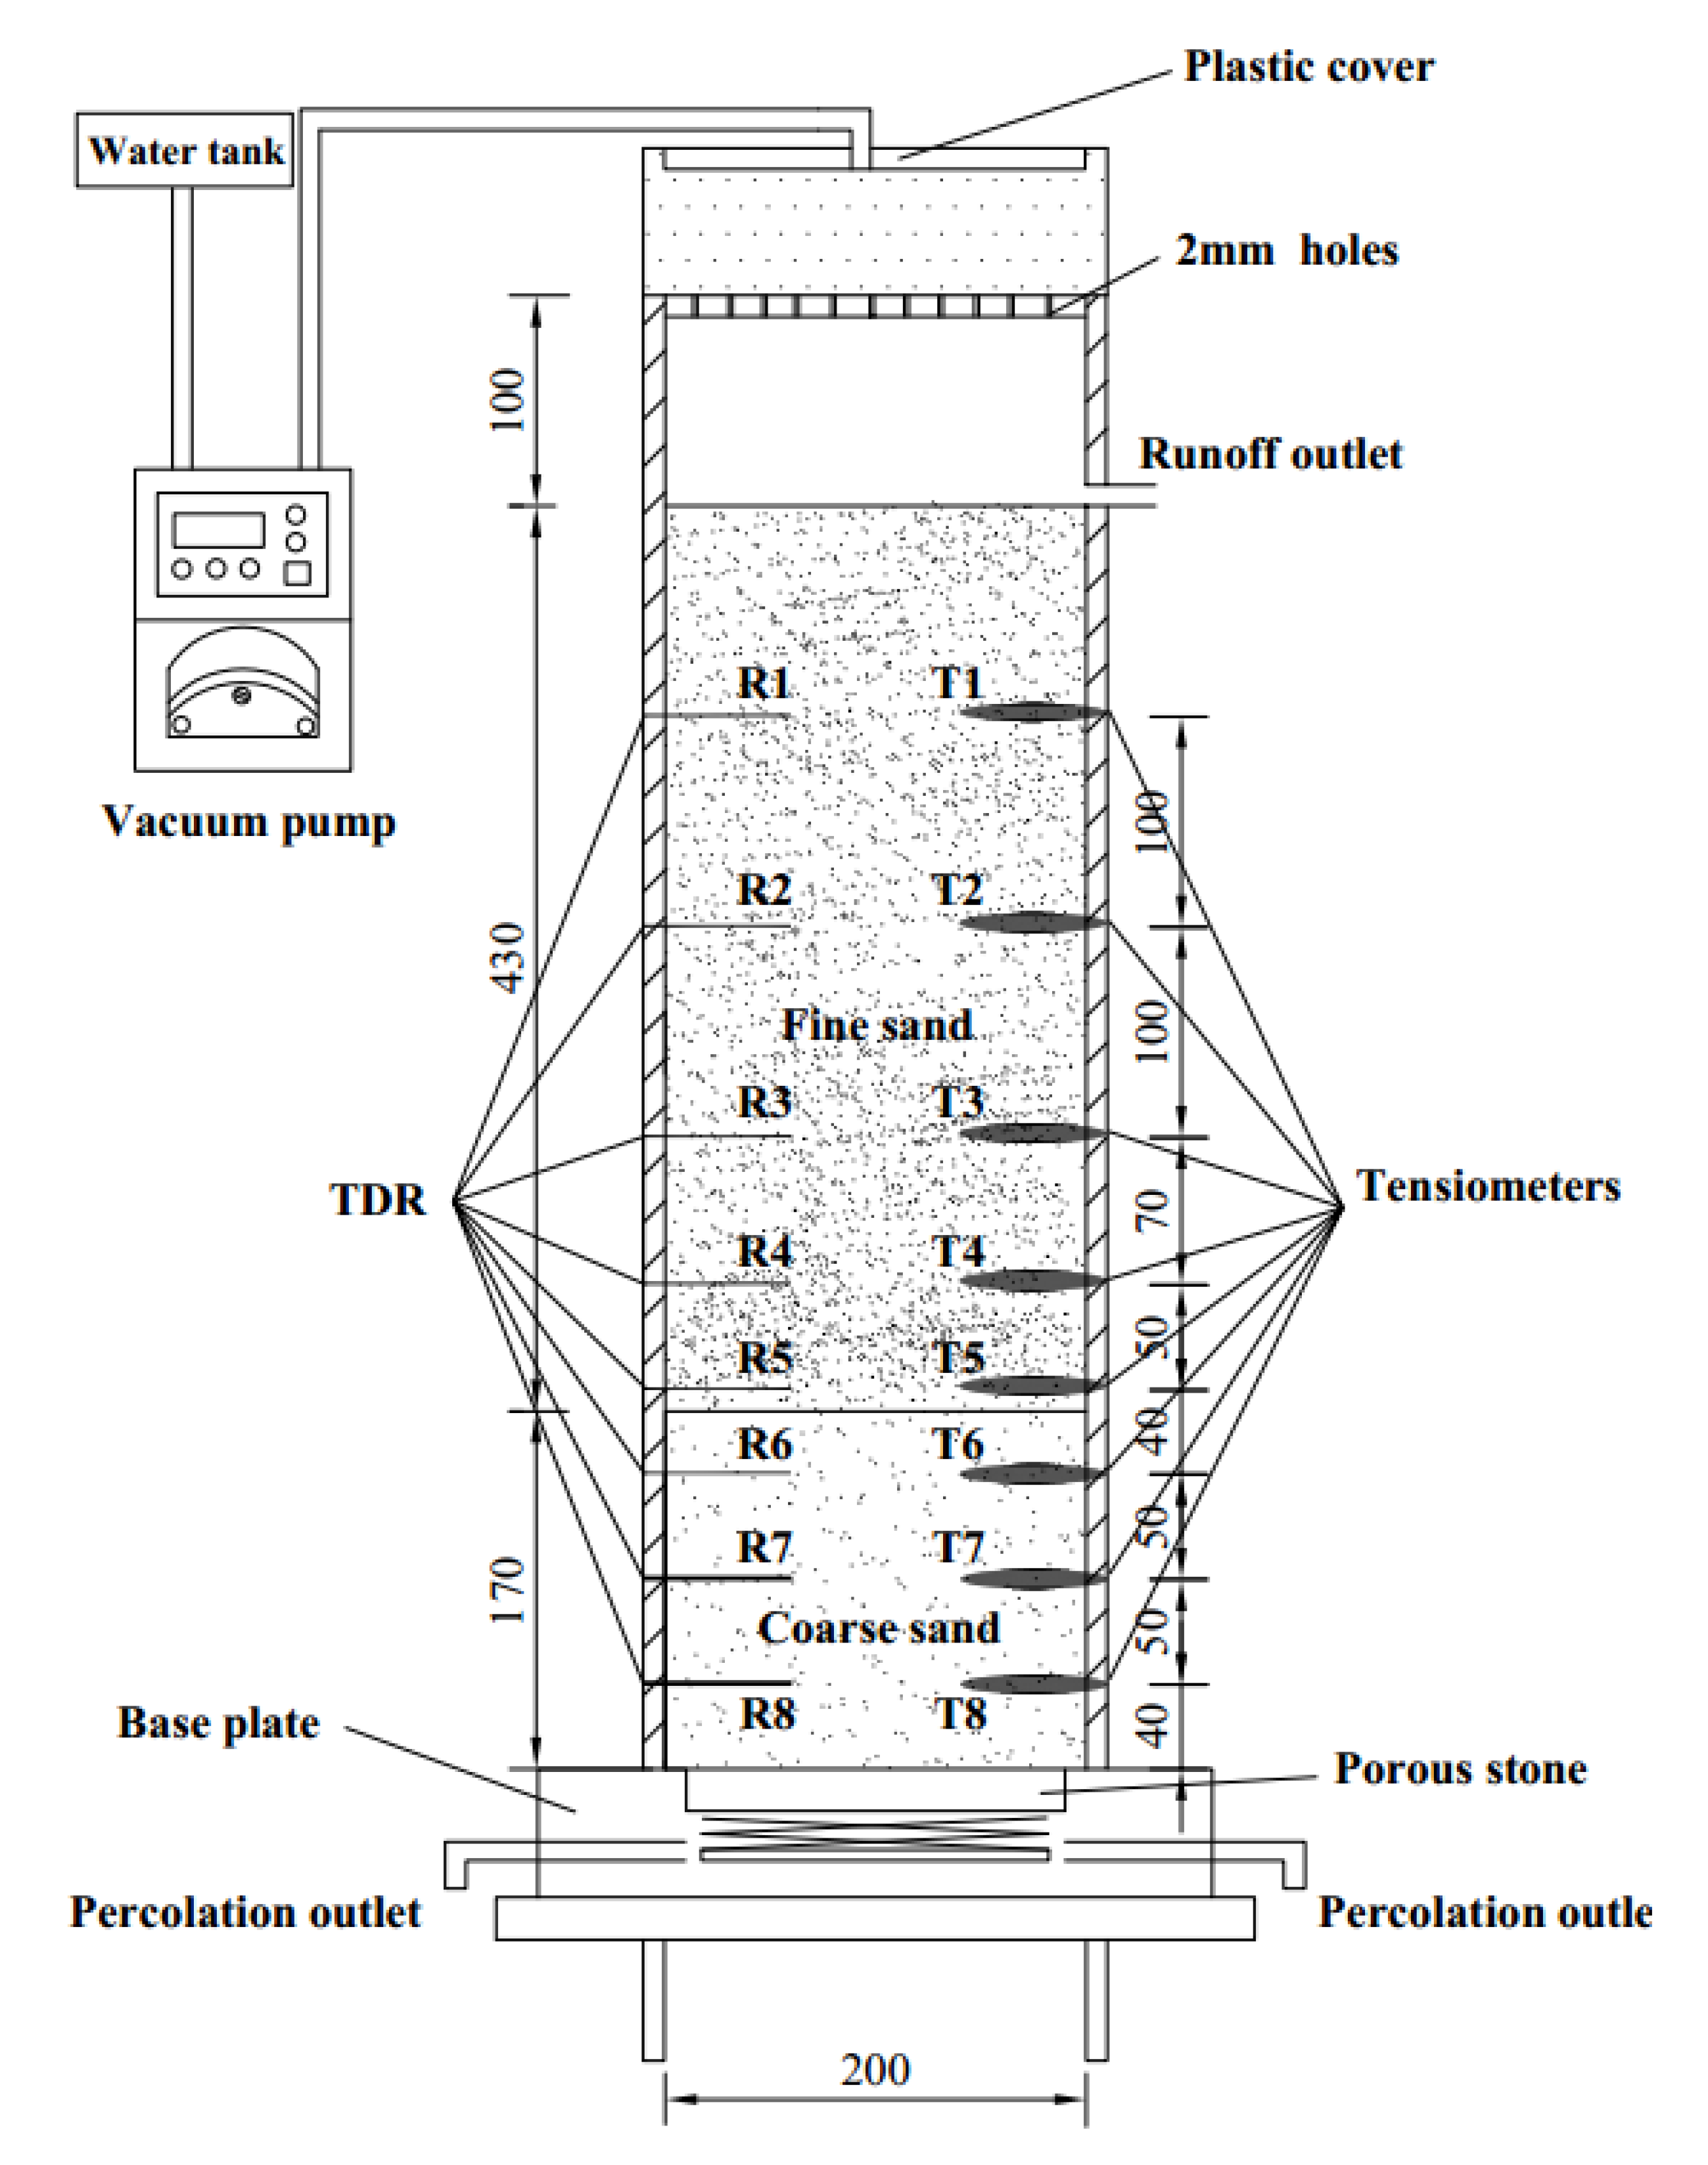
A soil column testing apparatus was developed to carry out rainfall infiltration tests (Figure 4). This apparatus consists of two main components: a transparent acrylic cylinder and a rainfall simulating system.
The transparent acrylic cylinder is used to accommodate a two-layer soil column that forms the capillary barrier cover (CBC). It has an inner diameter of 200 mm, and is 700 mm in height and has a wall thickness of 10 mm. Eight holes were drilled along one side of the cylinder to install tensiometers for measuring pore water pressure during the rainfall infiltration tests. On the opposite side of the cylinder, another eight holes at the same elevation were drilled to install time-domain reflectometry (TDR) for measuring volumetric water content during the rainfall infiltration tests. At the bottom of the cylinder, two outlets were provided and connected to a tank through a hosepipe to collect percolation during the rainfall tests. Another outlet was also provided at the surface of the soil column to collect runoff during the rainfall tests.
The rainfall simulating system is placed on the top of the soil column to provide rainfall with different patterns. This uses a vacuum pump to supply water to a circular pipe, which is dripped from the holes in the pipe to the plastic plate underneath that has a number of small, uniformly distributed, holes, which produce a spatially uniform rainfall. The vacuum pump can be controlled by the computer to provide variable pumping rates with time to simulated different patterns of rainfall (Figure 4).
2.3. Instrumentation
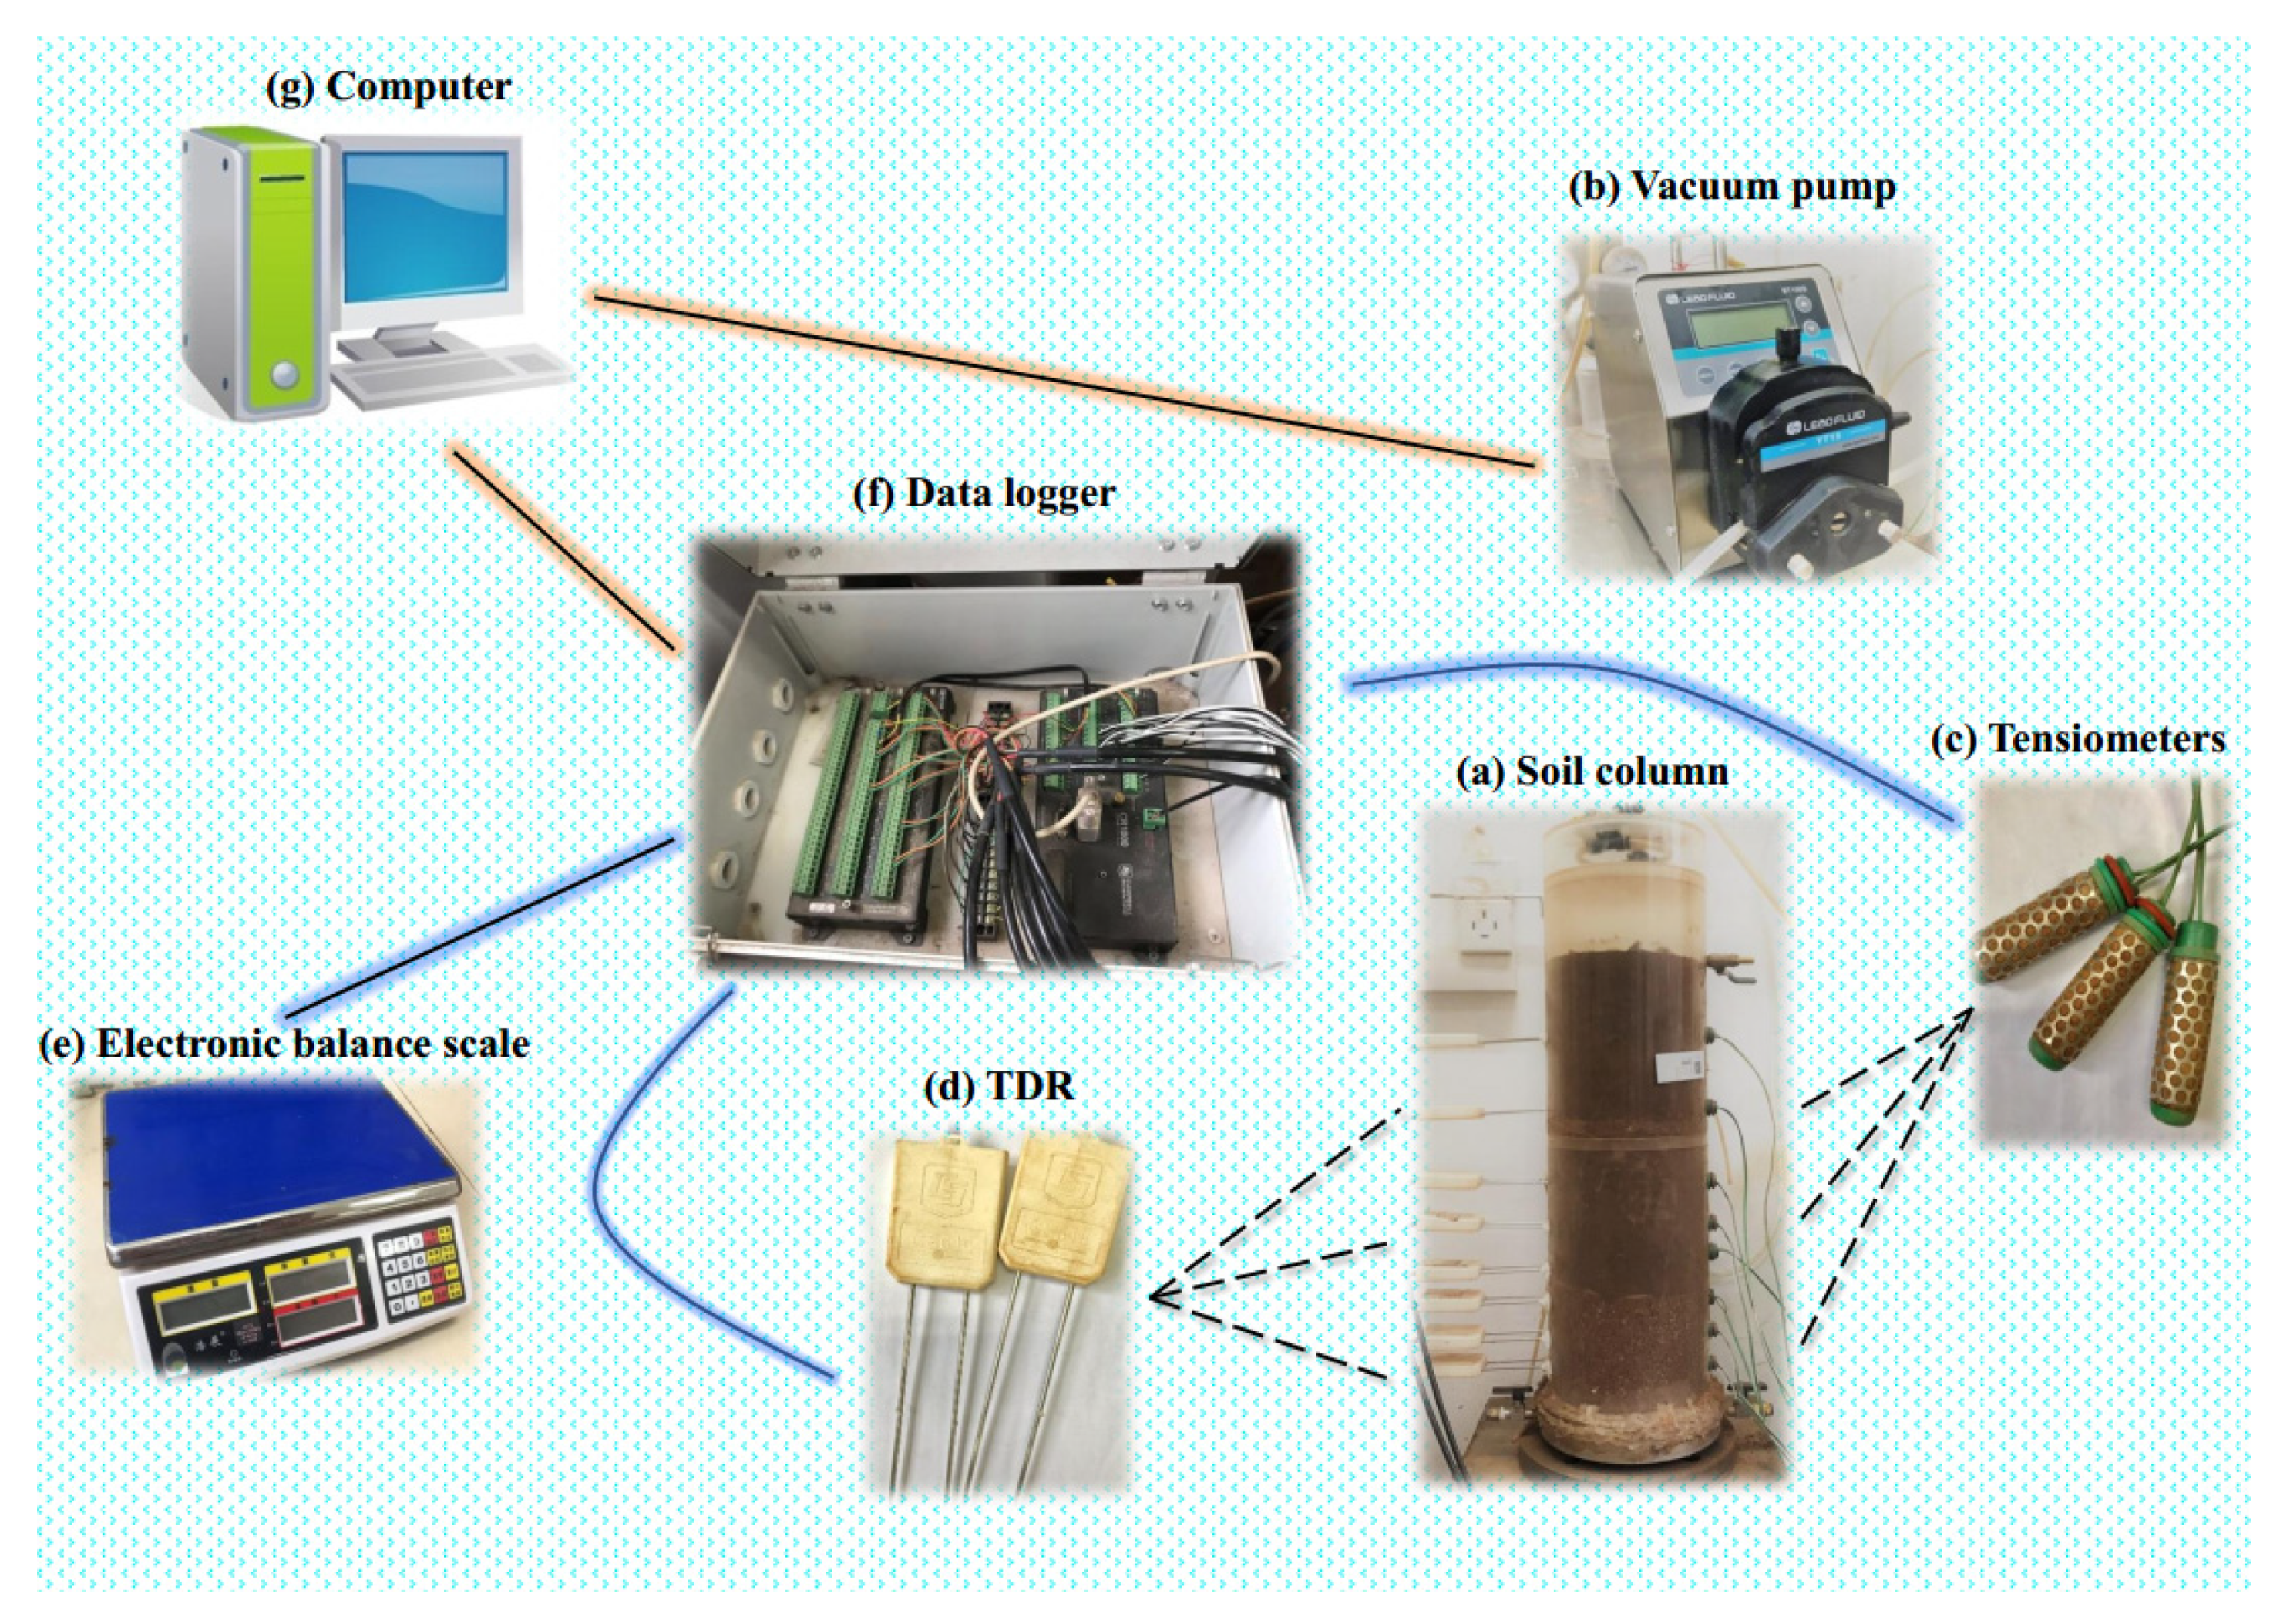
Measuring devices installed in the two-layer column are comprised of tensiometers for measuring pore water pressure, time domain reflectometry (TDR) sensors for volumetric water content measurement, and electronic scales for runoff and percolation measurement (Figure 5).
The tensiometers (Figure 5c, Techno Solutions Corporation, Beijing, China) is 19.1 mm in diameter and 82.6 mm in length. The measurement range of the tensiometers is from −200 kPa to 0 kPa.
The TDR used in this study is the CS616 (Figure 5d, Campbell Scientific, Inc., Logan, UT, USA). The accuracy of the TDR is 0.05% VWC, and the resolution is 0.1% VWC.
The Electronic balances (Figure 5e, Haozhan Balance instrument Corporation, Ruian, China) were used to measure the amount of percolation and surface runoff. The measurement ranges of the electronic balance are from 0 to 15 kg with an accurate to 0.1 g.
All the measuring devices were connected to a CR1000 data logger (Figure 5f, Campbell Scientific, Inc, Logan, UT, USA), The data logger was connected to a computer to record data automatically.
All the instruments were calibrated, and the measurement accuracy was within the specified range.
2.4. Test Programme
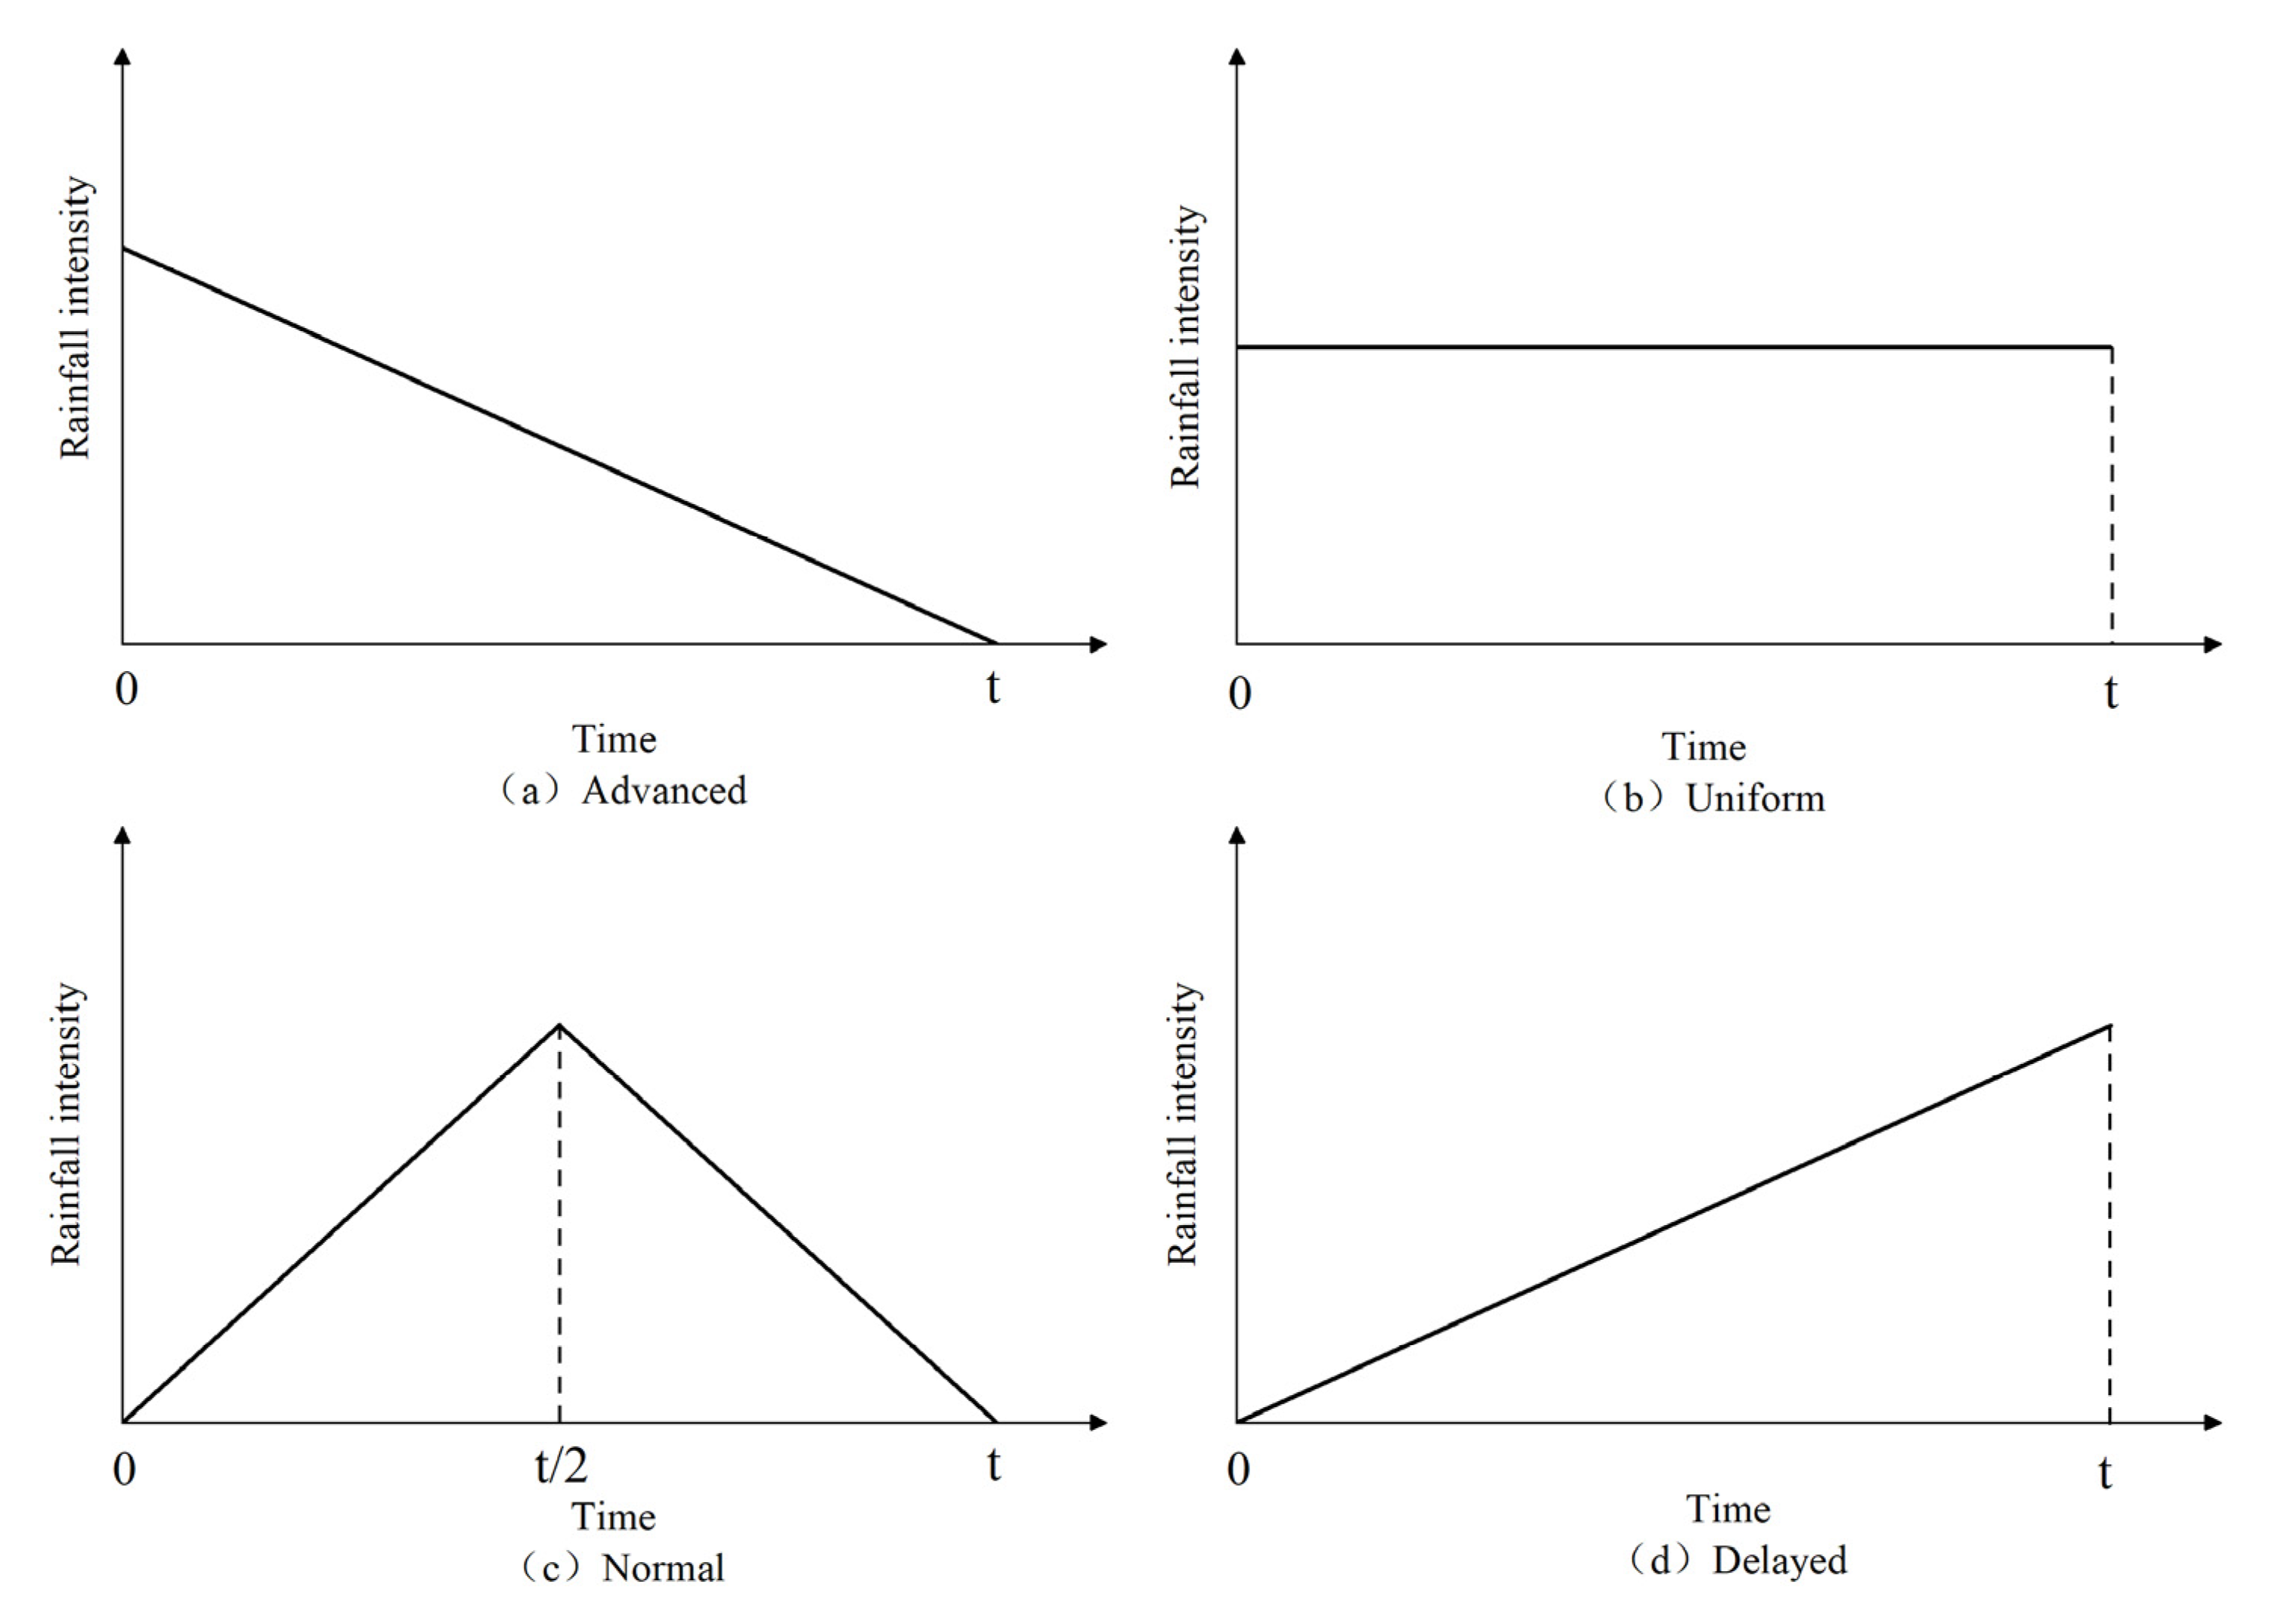
To investigate the behaviour and performance of CBCs subjected to different rainfall patterns, four typical representative rainfall patterns found in natural conditions, namely advanced, normal, delayed and uniform (Figure 6) were employed [23,24,25,26,27,28]. Three series of infiltration tests with different total volume of rainfall were designed, and series 2 and 3 were designed as parallel experiments for series 1. In each series, 2 cases with different rainfall durations were involved to represent two typical rainfall conditions in tropical regions (e.g., South China, Malaysia, Singapore) [21,36,37]. Case 1 represents a rainfall event with a relatively short duration and Case 2 represents a rainfall event with a relatively long duration. In each case, the total volume of rainfall and the rainfall duration remained unchanged, while the patterns of rainfall were altered, and the behaviour of CBC under various rainfall patterns were examined, respectively. Through the comparison of the results, the effect of rainfall patterns on the behaviour of the CBC in each case can be obtained. The test program is listed in Table 3.
2.5. Test Procedure
The fine and gravelly sand were firstly oven-dried and densified to the desired dry density stated in Section 2.1, which are equal to those used in the SWCC and hydraulic conductivity tests. Then, the two soils were mixed with a predetermined volume of water to obtain initial volumetric water contents of 0.062 and 0.04 for the fine and gravelly sand, respectively.
Subsequently, the prepared soils were used to construct a two-layer CBC, consisting of a 170 mm fine sand layer overlying a 430 mm gravelly sand layer. The gravelly sand layer was packed from the bottom of the cylinder in two lifts and the fine sand layer was packed in five lifts on the top surface of the gravelly sand layer. The soils were carefully placed in 100 mm lifts into the cylinder. After the placement of each lift, a proctor hammer was used to compact the soil to the prescribed dry density, which are the same as those used in the SWCC and hydraulic conductivity tests. The number of hammer-drops during the compaction was predetermined by trial compaction tests for each soil.
During the construction of the CBC, the measuring devices (tensiometers and TDR) were installed in the CBC at elevations of 0.04 m, 0.09 m, 0.14 m, 0.18 m, 0.23 m, 0.3 m, 0.4 m and 0.5 m through the holes in the cylinder. The installation was carried out during the soil compaction to ensure good contact between the measuring devices and the soils. Each measuring device was connected to the data logger, and the data logger was connected to a personal computer to record measuring data during the rainfall event. The layout of the measuring devices is shown in Figure 5. The outlet at the top surface of the fine sand layer was connected to a container through flexible tubing, which was placed on an electronic balance scale to measure the volume of runoff during the rainfall event. The other two outlets at the bottom of the cylinder were also connected to a container through a flexible tube. The container was placed on an electronic balance to record the percolation during the rainfall event.
When the initial readings of the measuring devices were stable, a series of rainfall infiltration tests designed in Section 2.4 (Table 3) were then conducted using the rainfall simulating system.
3. Results and Discussion
Results from series two and three are similar to that of series one. Due to the constraints of this paper, only the results from series one were presented in this study.
3.1. Rainfall Duration Is Relatively Short
Results from series1—case1 were selected to capture the CBC behaviour under a rainfall event with a relatively short duration. In this case, the rainfall patterns were changed with the total rainfall volume (12,000 mL) and duration (120 min) remaining constant.
3.1.1. Variation of Volumetric Water Content with Time
The comparisons between volumetric water contents (VWCs) at various positions of the soil column under different rainfall patterns are presented in Figure 7. At the middle of the fine sand layer (tensiometer R2, z = 0.4 m), the VWCs remained unchanged at the initial values in the early stages of rainfall in all four rainfall patterns (Figure 7a). This indicates that rainwater had not yet reached this position. VWCs began to increase rapidly at 540 s, 1080 s, 1620 s and 2160 s for the advanced, uniform, normal and delayed rainfall patterns, respectively, up to a value of approximately 0.45, after which the VWCs all maintained approximately constant readings for a period, with small fluctuations. It is interesting to note that, at the end of rainfall events, VWCs in the advanced and normal rainfall patterns showed a decreasing trend. This may be because the rainfall intensity is lower than the infiltration capacity of soils at the end of the advanced and normal rainfall patterns. However, in the uniform and delayed rainfall patterns, VWCs did not change as the rainfall intensity is higher than infiltration capacity of soils.
Figure 7b presents the VWCs variation near the interface of the fine–coarse sand layers in the fine sand (tensiometer R5, z = 0.18 m). The VWCs remained almost unchanged during the initial stage in the rainfall, then the VWCs started to increase dramatically at 1890 s, 2700 s, 3510 s and 4320 s for the advanced, uniform, normal and delayed rainfall patterns, respectively. Afterwards, the VWCs remained almost at a constant value during the rest of rainfall time in all rainfall patterns. For the VWCs in the coarse sand layer shown in Figure 7c,d (tensiometer R6, z = 0.14 m and tensiometer R7, z = 0.09 m), a similar trend was observed. At the initial stage, the VWCs remained nearly at a constant value for a period, then increased sharply first in the advanced pattern, followed by the uniform, normal and delayed rainfall patterns. Subsequently, the VWCs remained approximately unchanged until the end of rainfall.
In summary, the influence of rainfall patterns on the VWCs is obvious in the upper part of the soil column, while that is insignificant in the lower part of the soil column.
3.1.2. Pore Water Pressure Profiles
During the first 1620 s of the advanced rainfall pattern (Figure 8a), rainwater rapidly moves to the bottom of the fine sand layer and the PWP increased dramatically along the entire fine sand layer. In contrast, the PWP in the coarse sand layer decreased slightly due to downward gravity flow of water. This suggests that the capillary barrier was formed at the fine–coarse interface that prevented rainwater in the fine sand layer infiltrating the coarse sand layer. At the middle stage of rainfall, the PWP along the whole soil column increased rapidly, which indicates that the capillary barrier was broken and that rainwater had infiltrated the coarse sand layer. At the final stage of rainfall, the PWP at the upper part of the soil column decreased gradually, in accordance with the decrease in rainfall intensity at the end of the advanced rainfall pattern, however the decrease in PWP in the lower part of the soil column was not obvious.
The PWP increased in the upper part of the fine sand layer during the initial 1620 s of subjection to uniform rainfall (Figure 8b); this means that the rainwater has not reached the bottom of fine sand. However, an increase was also observed in the fine soil layer near the sand interface, and the PWP decreased slightly in the coarse sand layer. This can be explained by the downward gravity flow that occurred in the fine sand layer as uniform distributed pore water pressure was set initially. The gravity flow was then prevented by the capillary barrier that formed at and accumulated near the interface. In the middle of the rainfall, the PWP increased along the whole soil column and subsequently remained approximately constant until the end of rainfall.
At the initial stage of the normal rainfall pattern (Figure 8c), rainwater infiltrated the bottom of the fine sand layer at a lower rate than that of the advanced and uniform rainfall patterns, and a rapid increase was observed in the upper part of the fine sand layer. Meanwhile, the PWP in the coarse sand layer decreased slightly. In the middle of the rainfall, the PWP along the whole soil column increased rapidly. As with the normal rainfall pattern, the PWP at the upper region of the fine sand layer decreased for the rainfall intensity diminished at the end of the normal rainfall pattern, and the PWP at the lower part of the soil column decreased little.
The delayed rainfall pattern (Figure 8d) showed a similar trend to the uniform rainfall pattern. At the initial stage, rainwater infiltrated downward at the slowest rate of all the other rainfall patterns, and the PWP in the fine sand layer increased gradually. Furthermore, in the coarse sand layer, the PWP decreased slightly due to the water redistribution under gravity. During the middle period of rainfall, the PWP along the whole soil column increased greatly, and remained at almost a constant value until the rainfall ended. This is because the rainfall intensity is largest at the end of the delayed rainfall pattern, which is higher than the infiltration capacity of the soil.
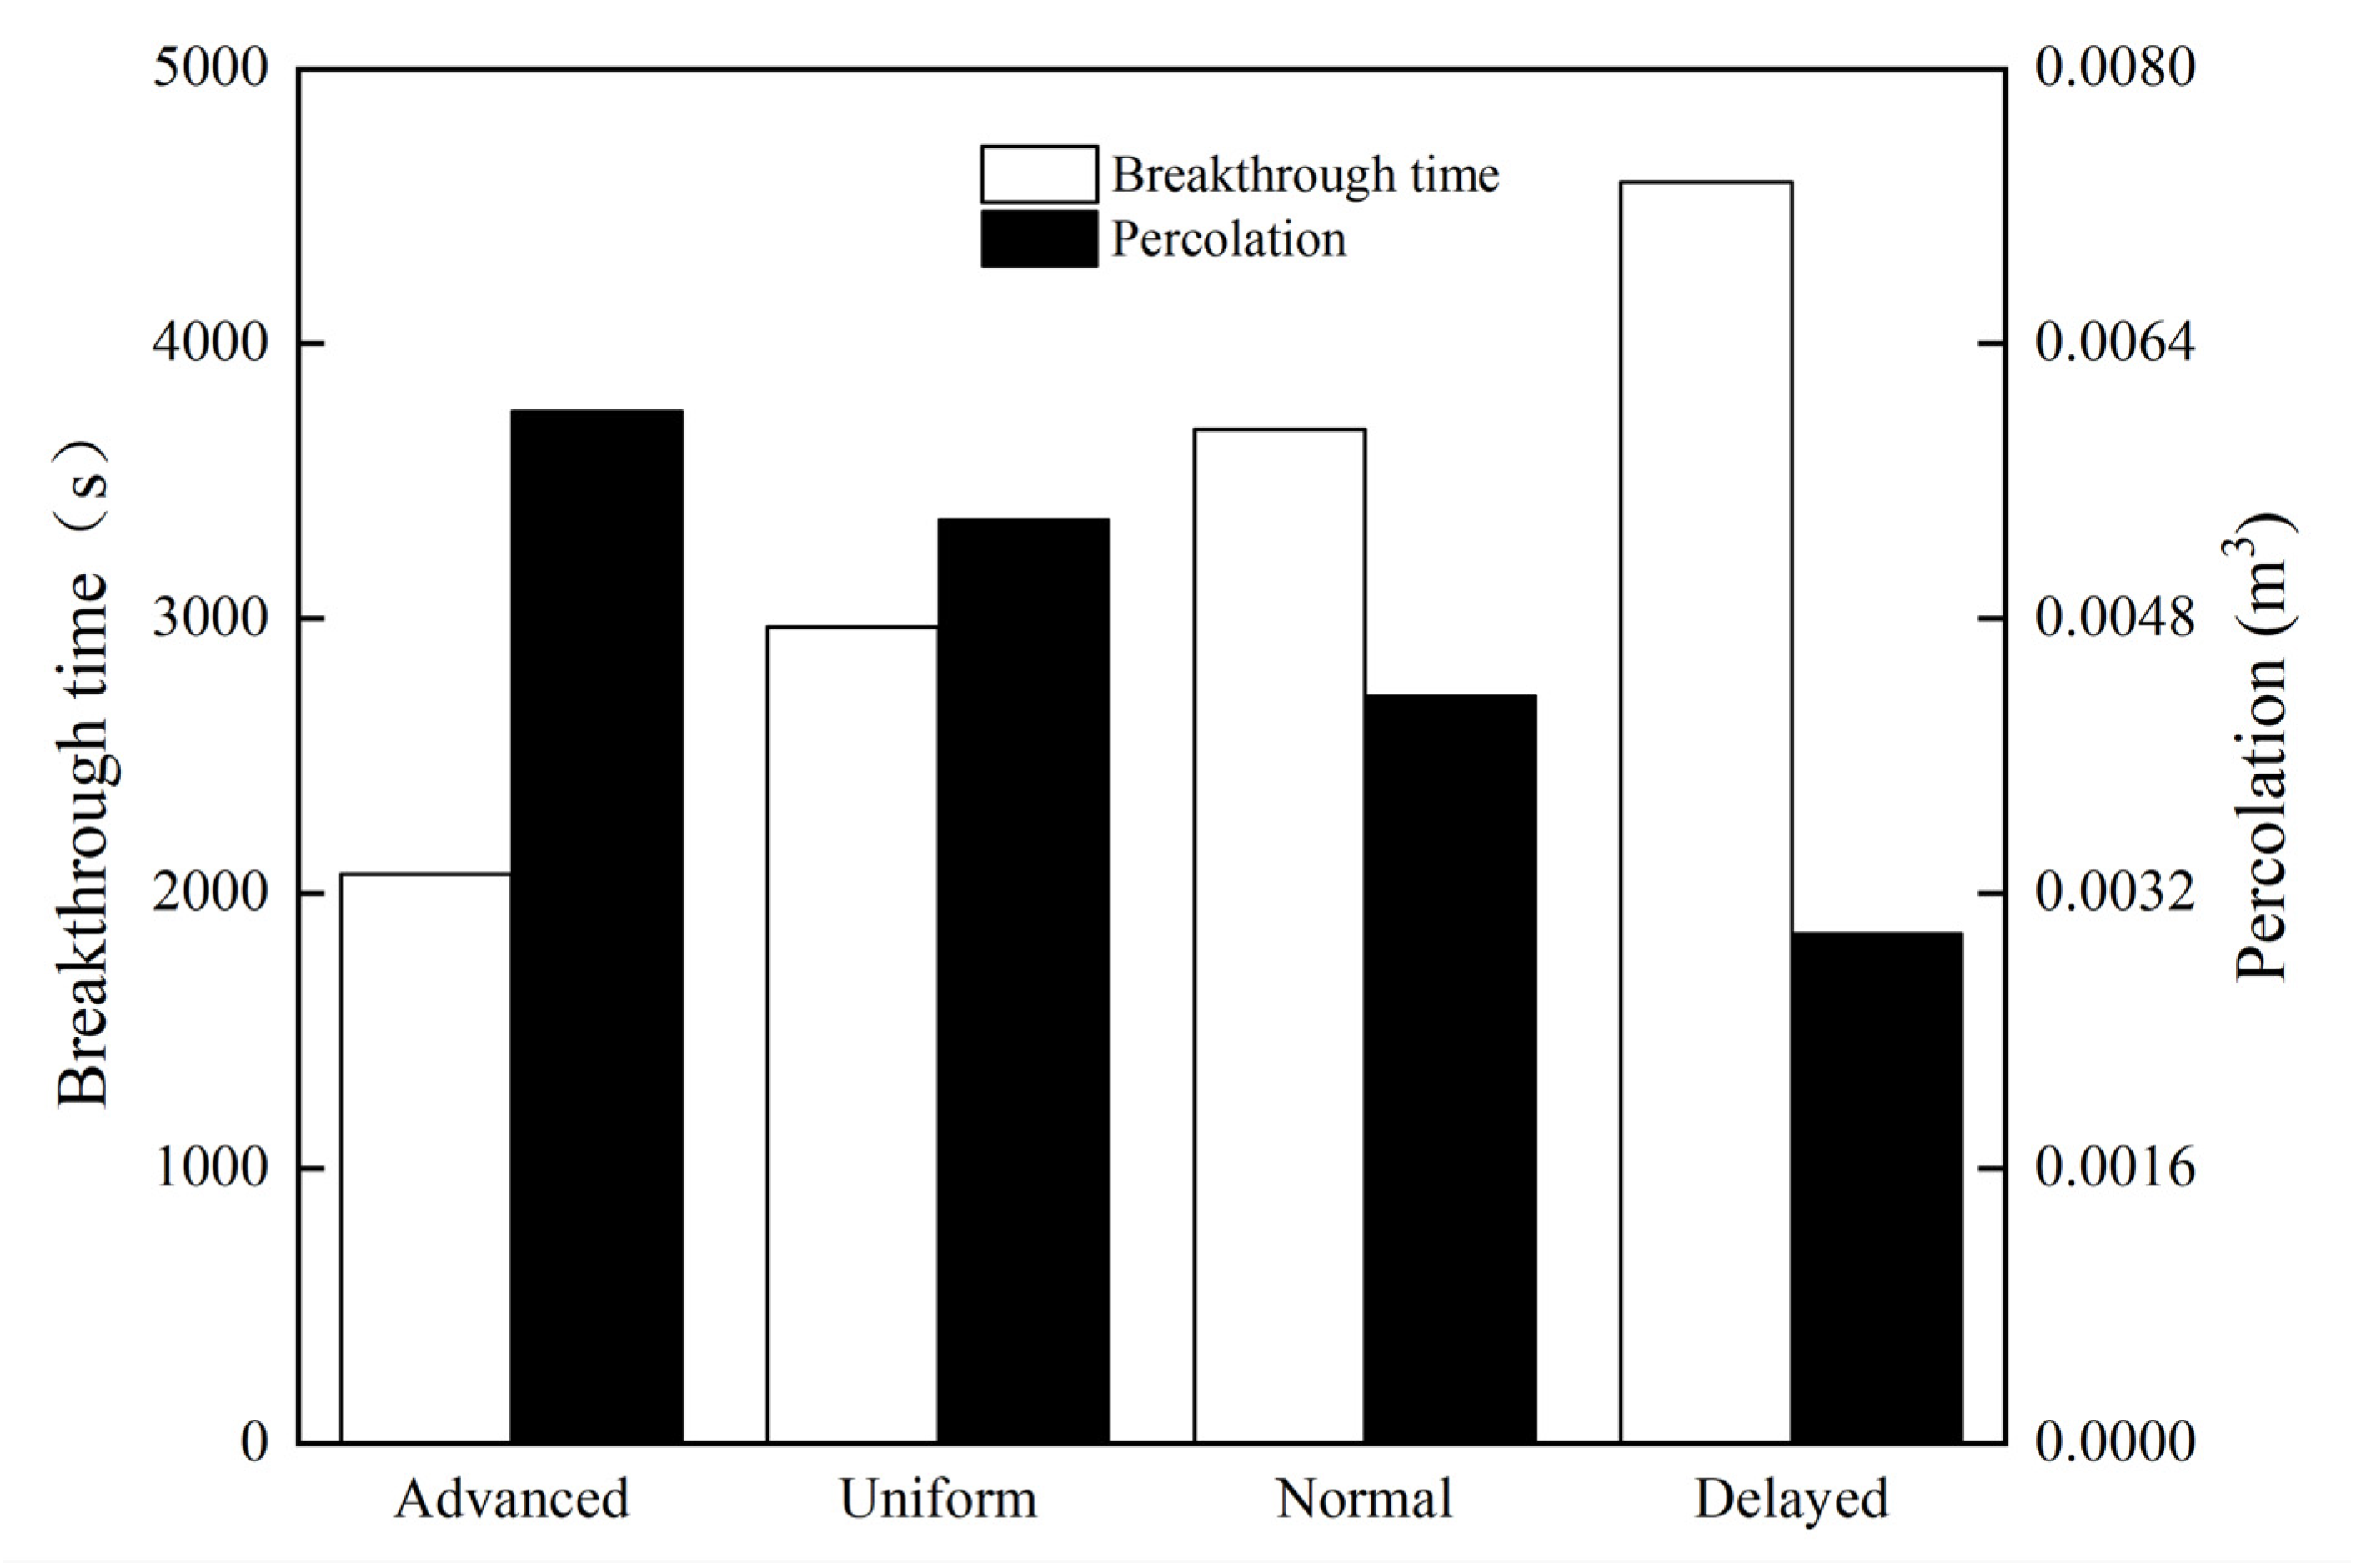
3.1.3. Breakthrough Time and Percolation
Breakthrough time refers to the time it takes for rainwater to move across the interface into the underlying coarse sand layer. This can be estimated using the trend of change in VWCs near the interface in the coarse sand layer. The advanced rainfall pattern (Figure 7c) exhibits a sudden increase in VWCs at the nearest sensor to the interface (30 mm below the interface) after 2070 s of rainfall, this indicates that the rainwater started to break through the interface and move into the coarse sand layer, therefore, the breakthrough time for the advanced rainfall pattern can be estimated to be around t = 2070 s. In ascending order, the breakthrough time was estimated to be t = 2970 s, t = 3690 s and t = 4590 s for the uniform, normal and delayed rainfall patterns, respectively (Figure 7c). Percolation is the rainwater that flows through the capillary barrier during the rainfall period, which was collected and measured by electronic balances. Comparisons of breakthrough time and percolation obtained from different rainfall patterns are presented in Figure 9. The largest accumulated percolation result from the advanced rainfall pattern (0.00601 m3), followed by the uniform (0.00538 m3) and normal patterns (0.00436 m3); the delayed rainfall pattern generated the smallest volume of percolation (0.00297 m3).
3.2. Rainfall Duration Is Relatively Long
Results from series1—case2 were selected to capture the CBC behaviour under a rainfall event with a relatively long duration. In this case, the rainfall patterns were changed with the total rainfall volume (12,000 mL) and duration (400 min) remained constant.
3.2.1. Variation of Volumetric Water Content with Time
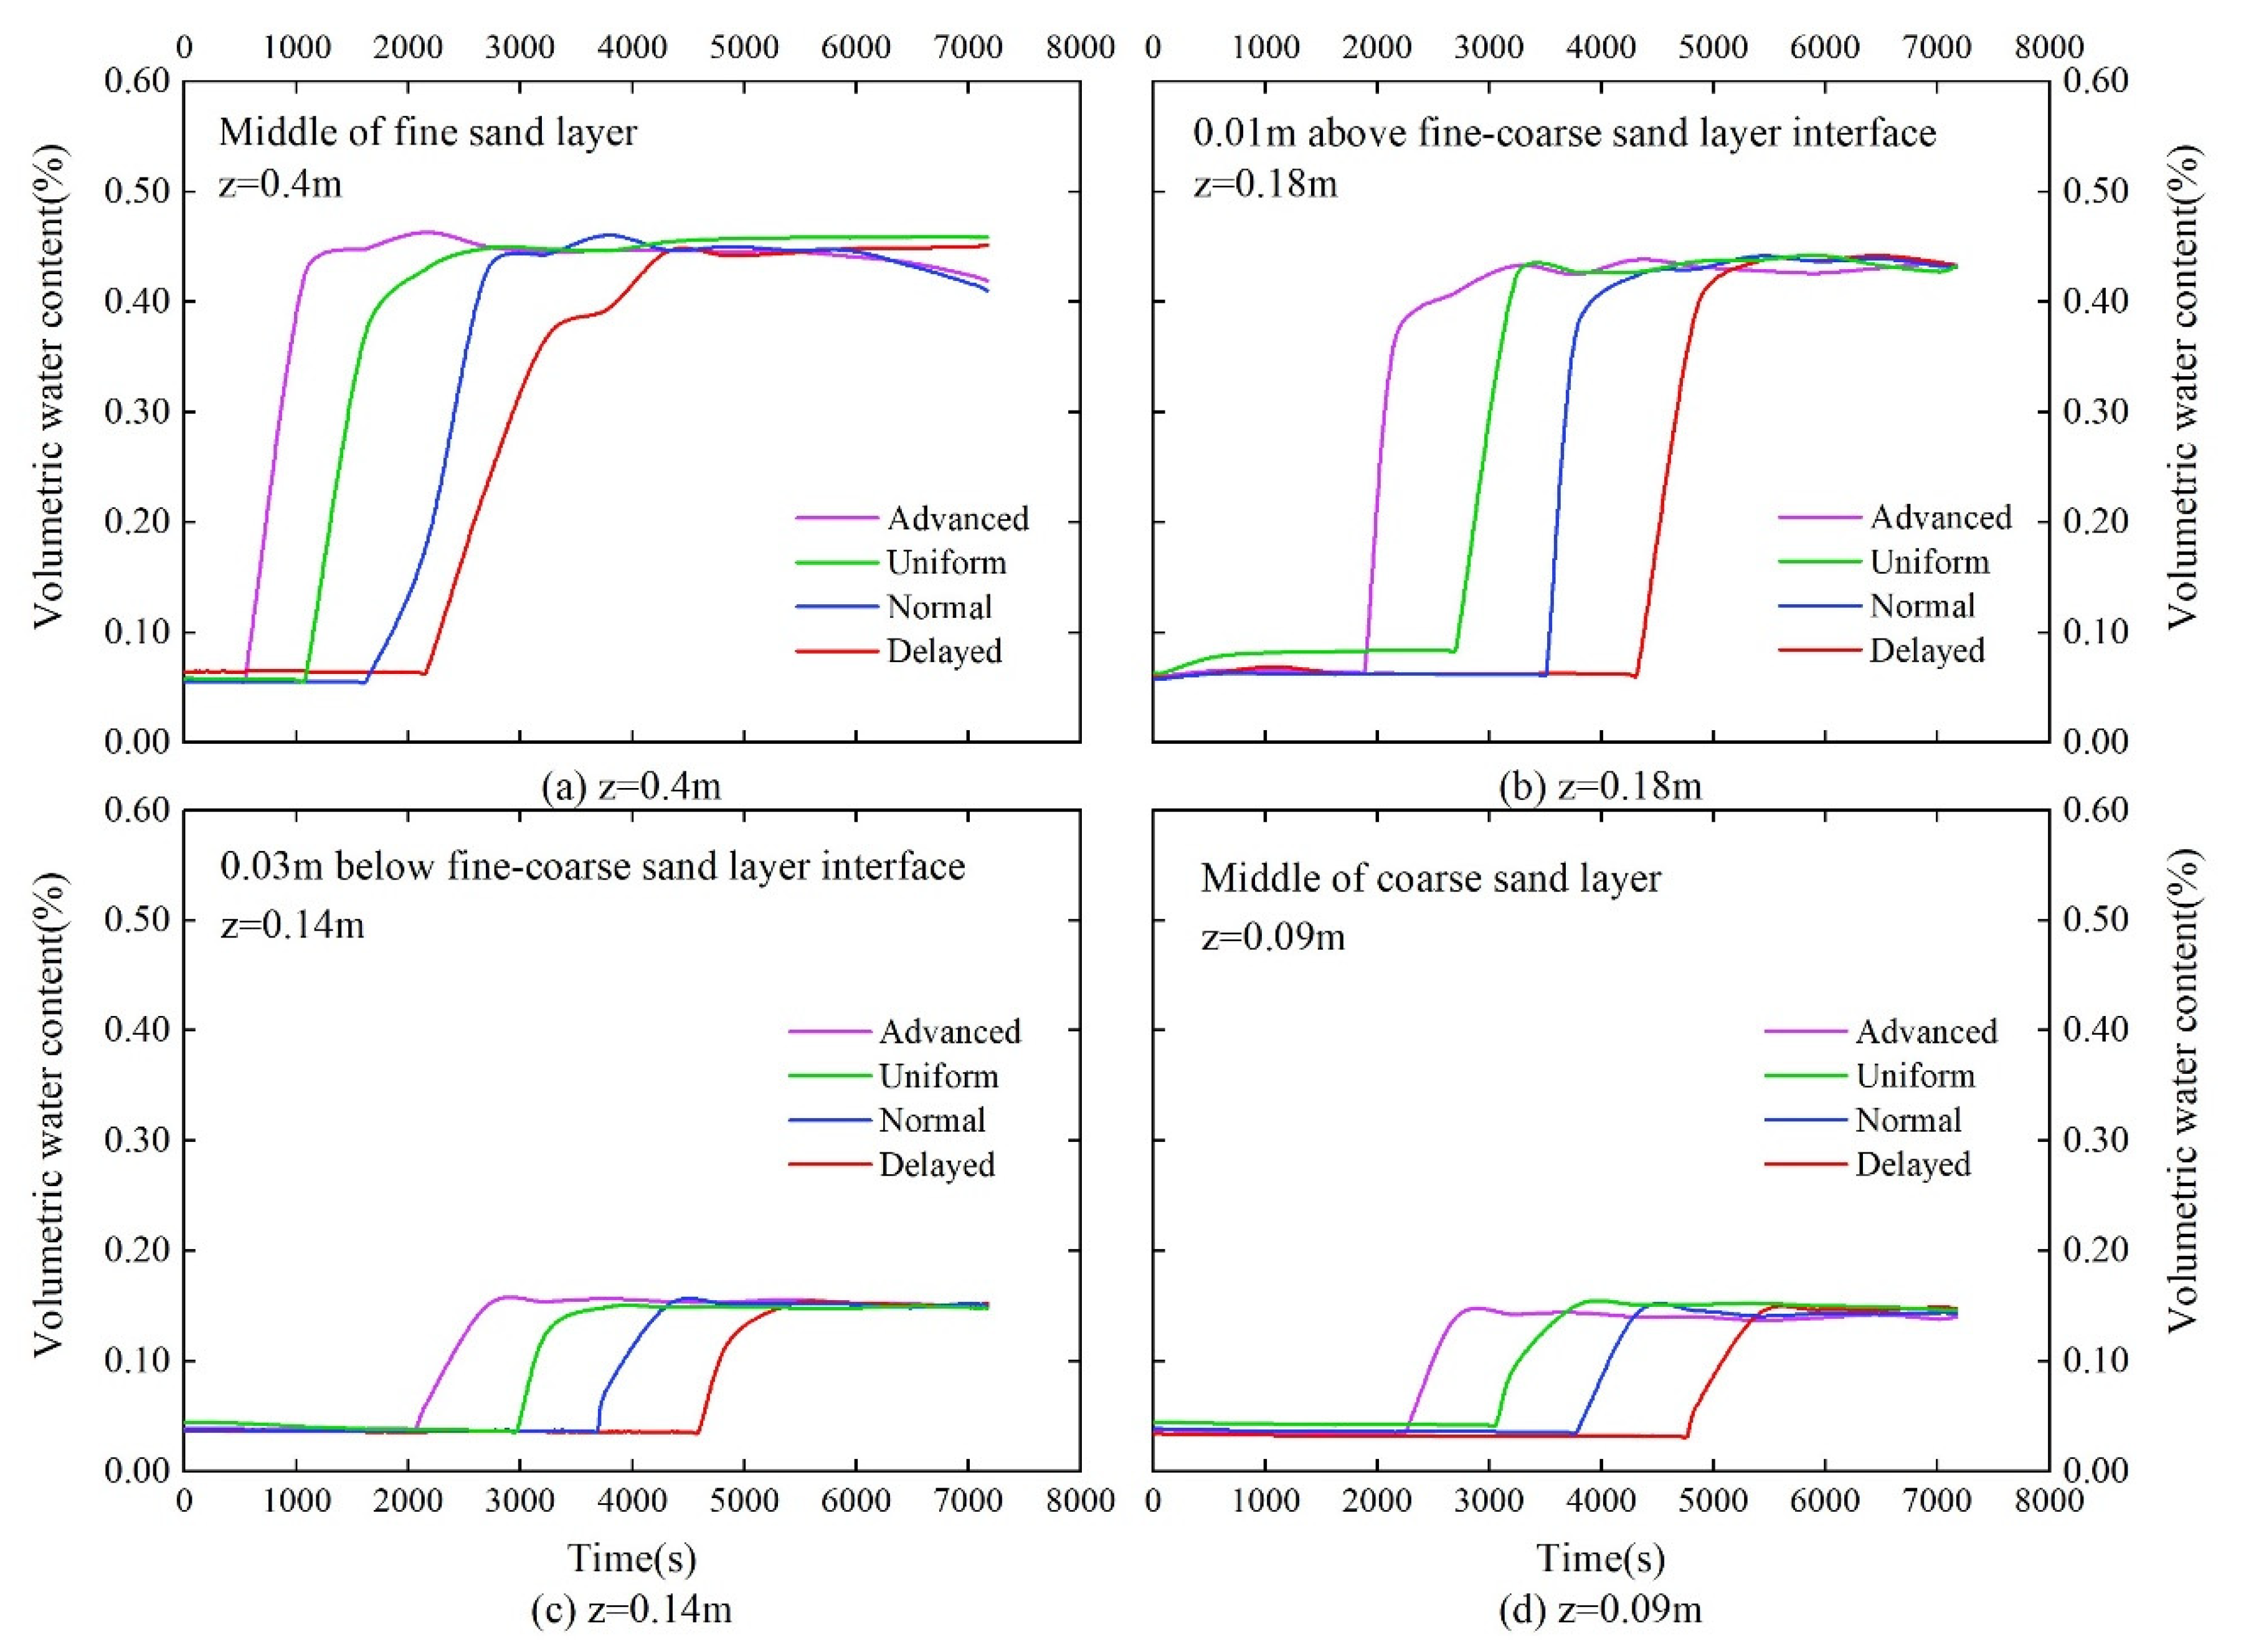
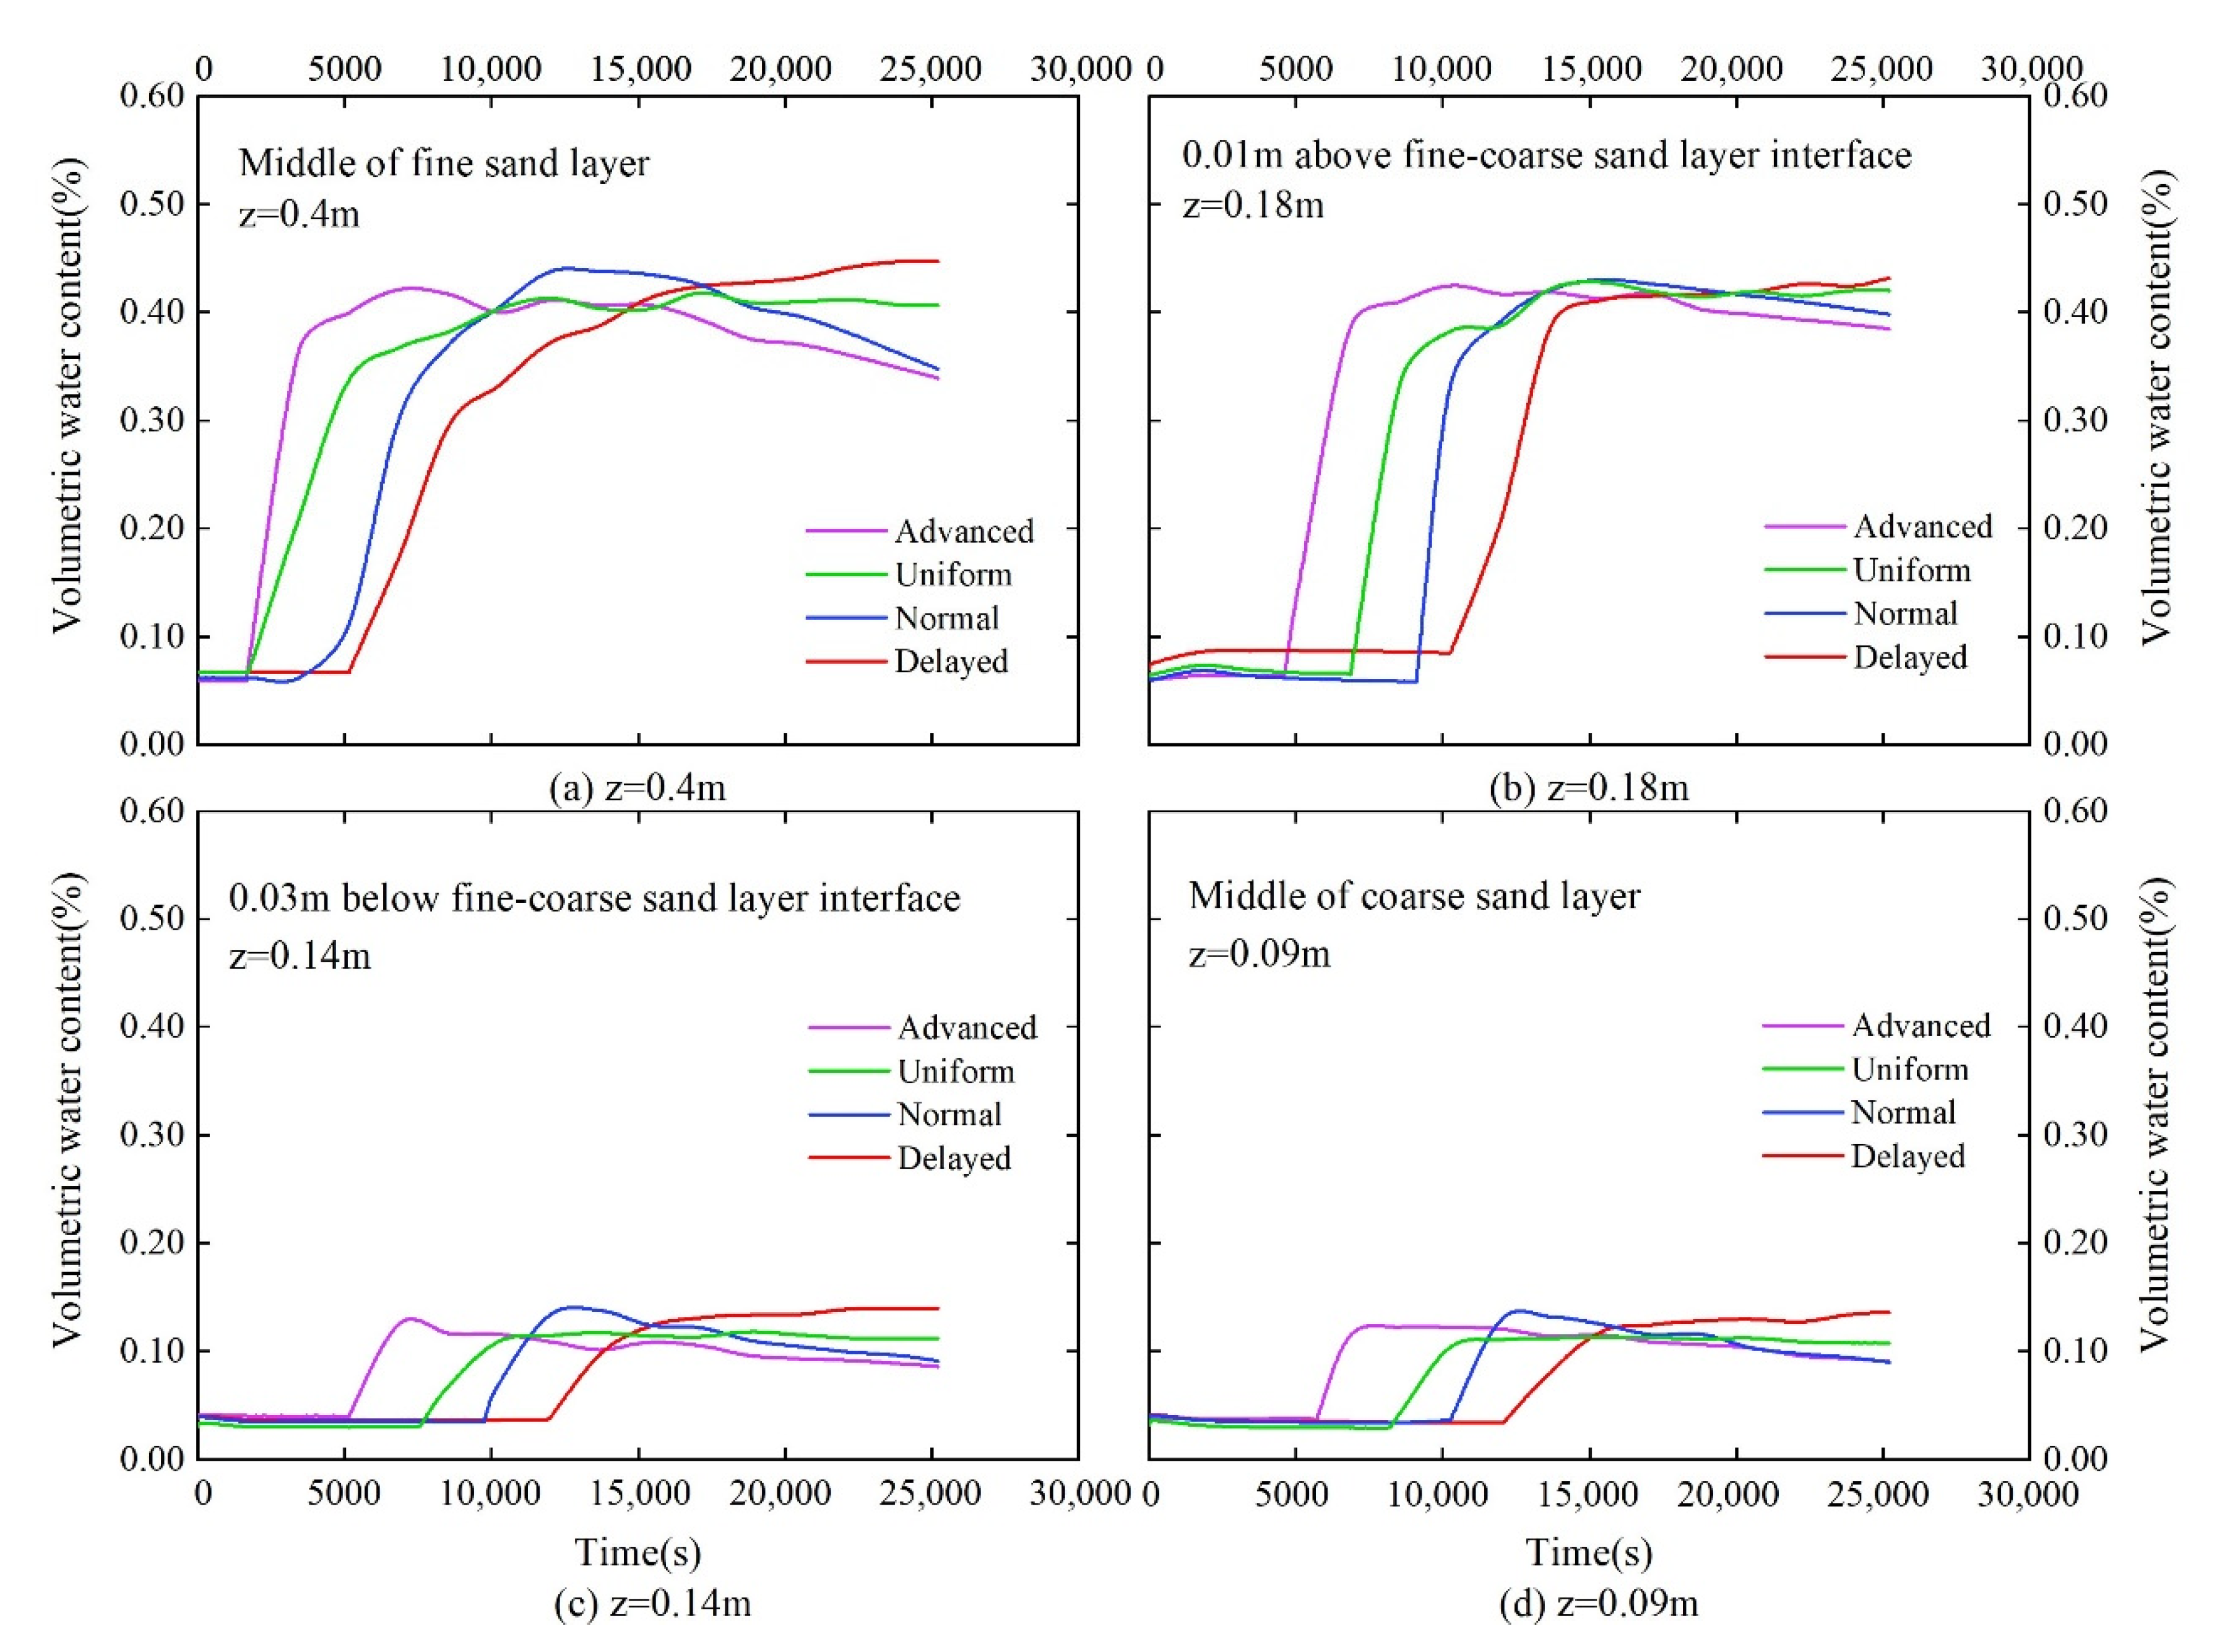
Figure 10 presents the measurements of volumetric water content at different elevations of the soil column under different rainfall patterns. At the middle of the fine sand layer (tensiometer R2, z = 0.4 m), the VWCs were almost unchanged at the initial stage of rainfall in four rainfall patterns, indicating that the rainfall water had not reached this position (Figure 10a). At an elapsed time of 1620, 1710, 3420 and 5130 s, for the advanced, uniform, normal and delayed rainfall patterns, respectively, the VWCs started to increase dramatically. In the advanced and normal rainfall patterns the VWCs decreased gradually until the rainfall ended, while the VWCs continued to increase throughout the remainder of the rainfall in the delayed rainfall pattern, in addition, the VWCs maintained a roughly constant value until the end of rainfall in the uniform rainfall pattern. The variations indicate that the VWCs at the middle of the fine sand layer were affected by rainfall patterns.
Figure 10b–d depicts the variations of VWCs at the lower region of the soil column (tensiometers R5, R6 and R7, z = 0.18 m, 0.14 m and 0.09 m, respectively), which exhibit a similar trend to that at z = 0.4 m. The VWCs maintained a nearly constant value from the initial stage, but later increased dramatically in a short period, firstly in the advanced rainfall pattern, followed by the uniform, normal, and delayed rainfall patterns. After the increase peaked, the VWCs of the advanced and normal rainfall patterns began to gradually decrease; while the VWCs of the delayed rainfall pattern continued to increase, the uniform rainfall pattern maintains an approximately constant value. This illustrates that the VWCs along the whole soil were significantly affected by rainfall patterns.
3.2.2. Pore Water Pressure Profiles
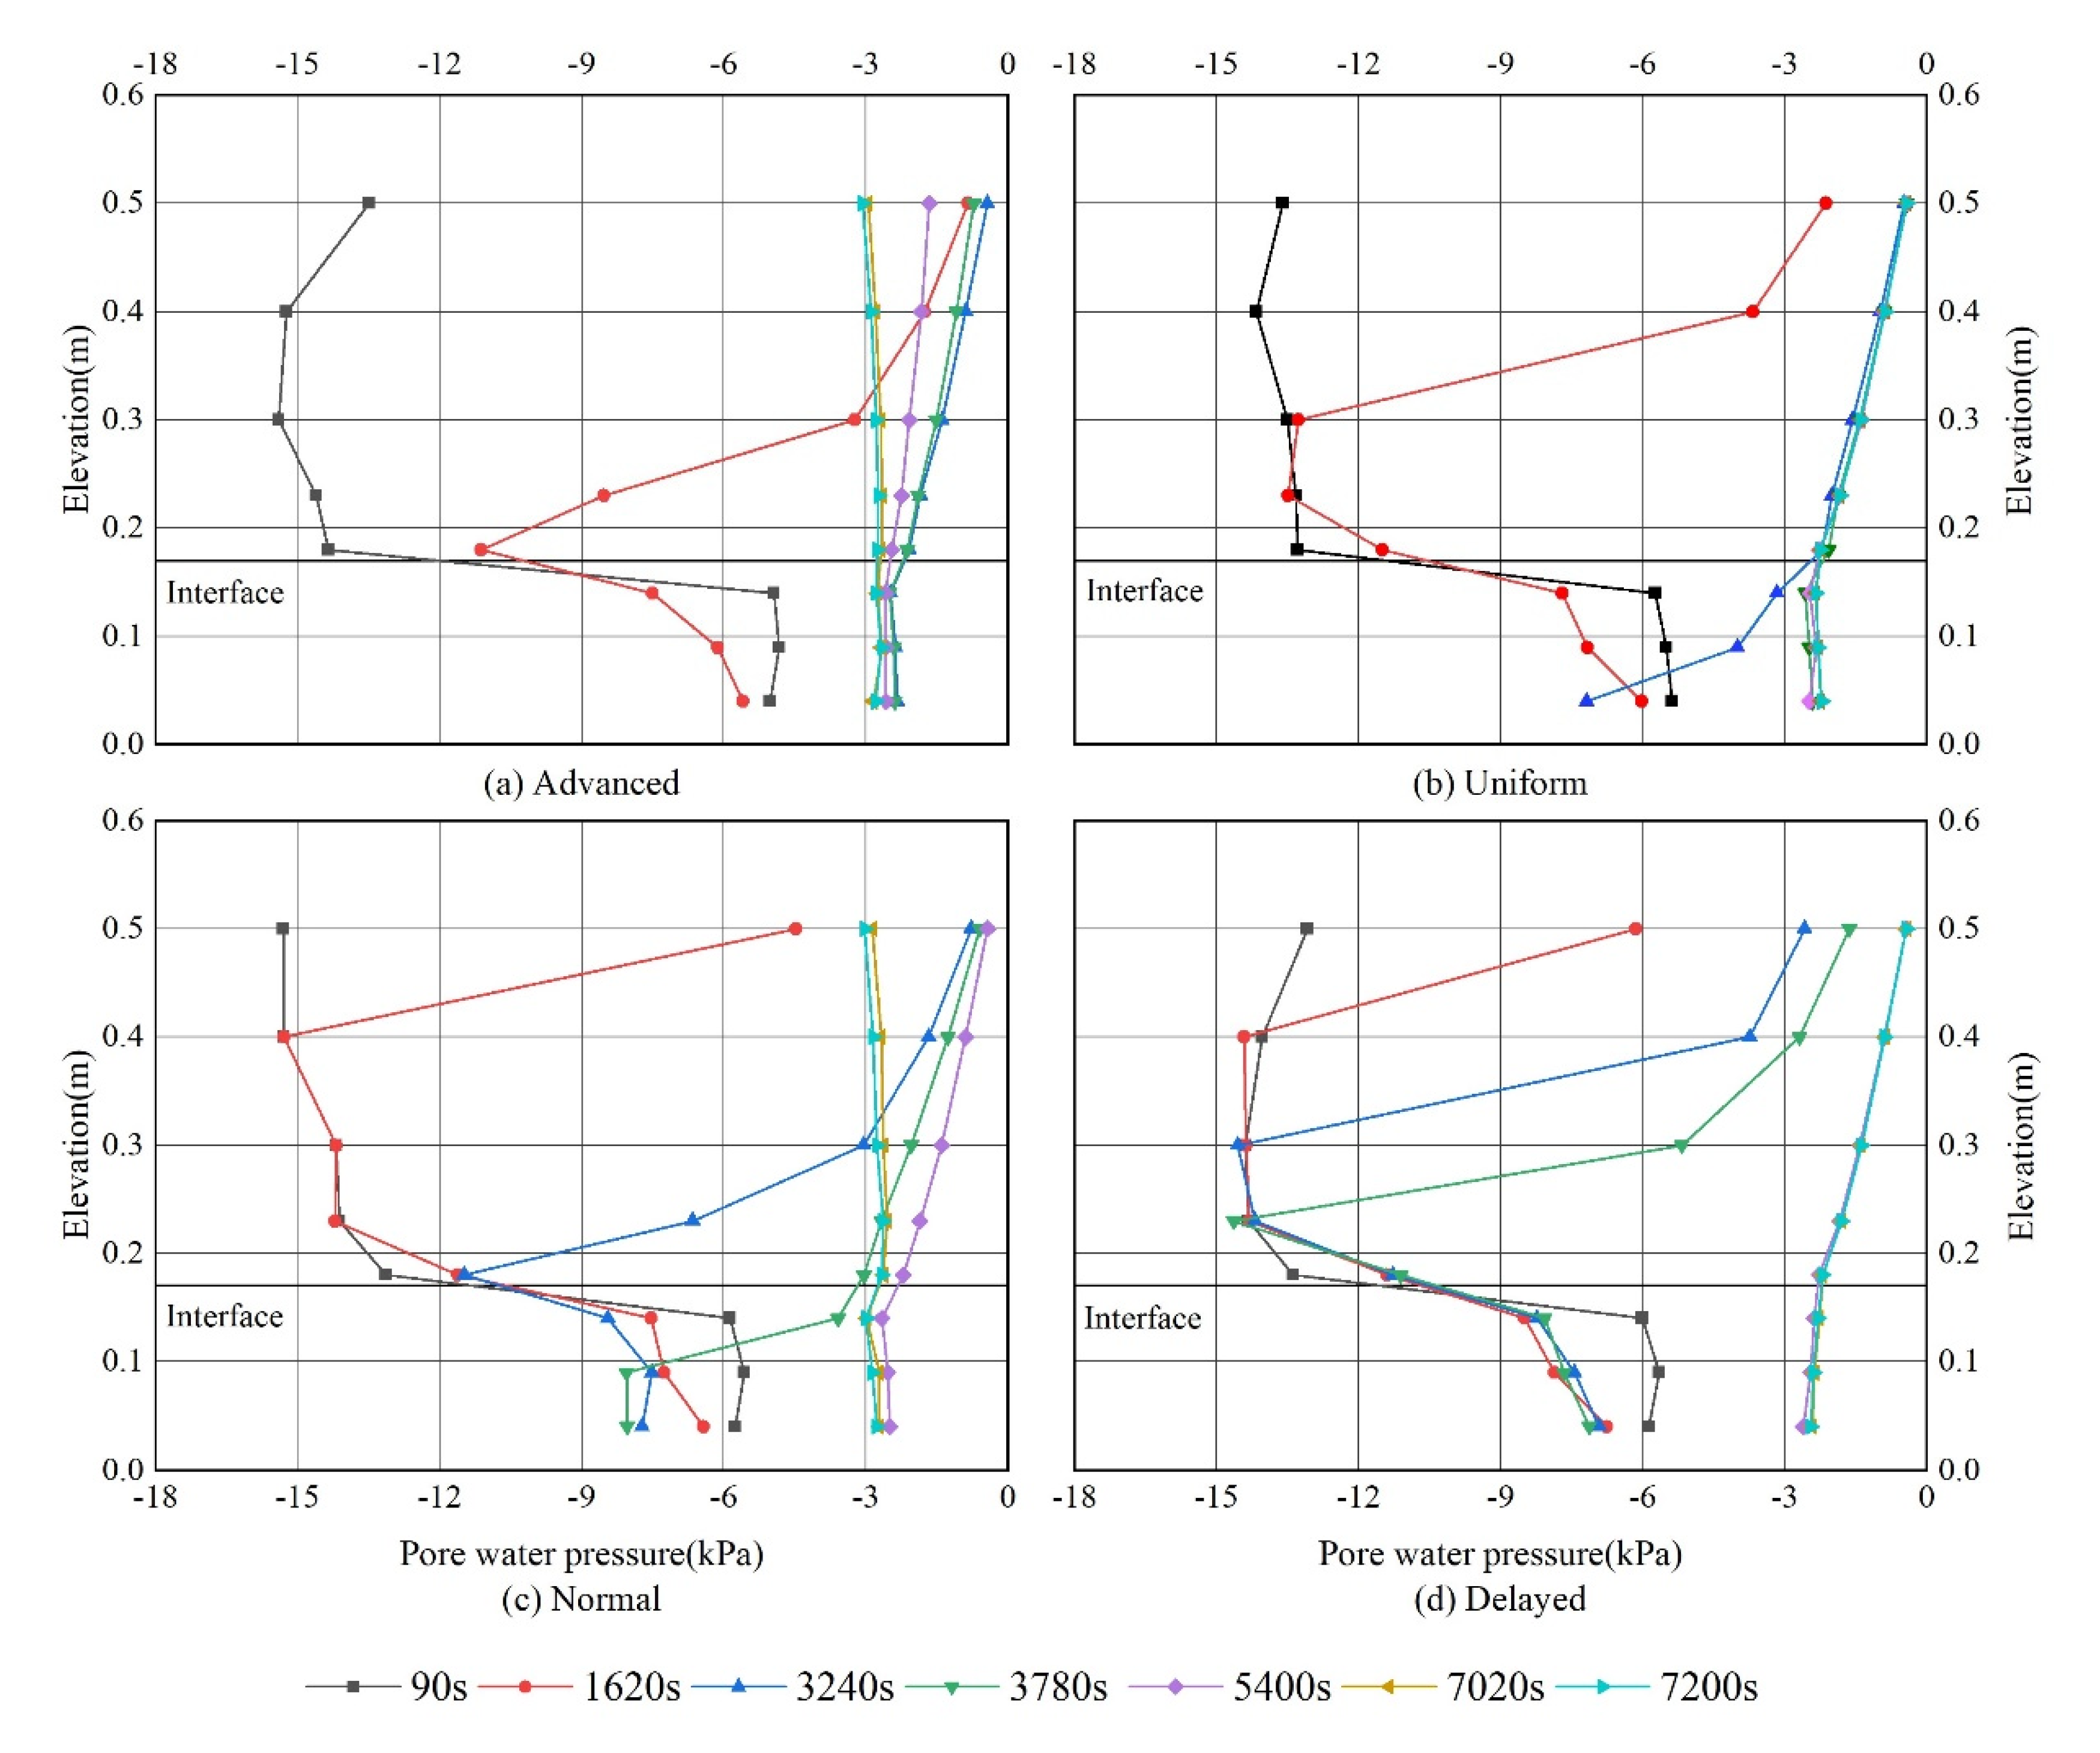
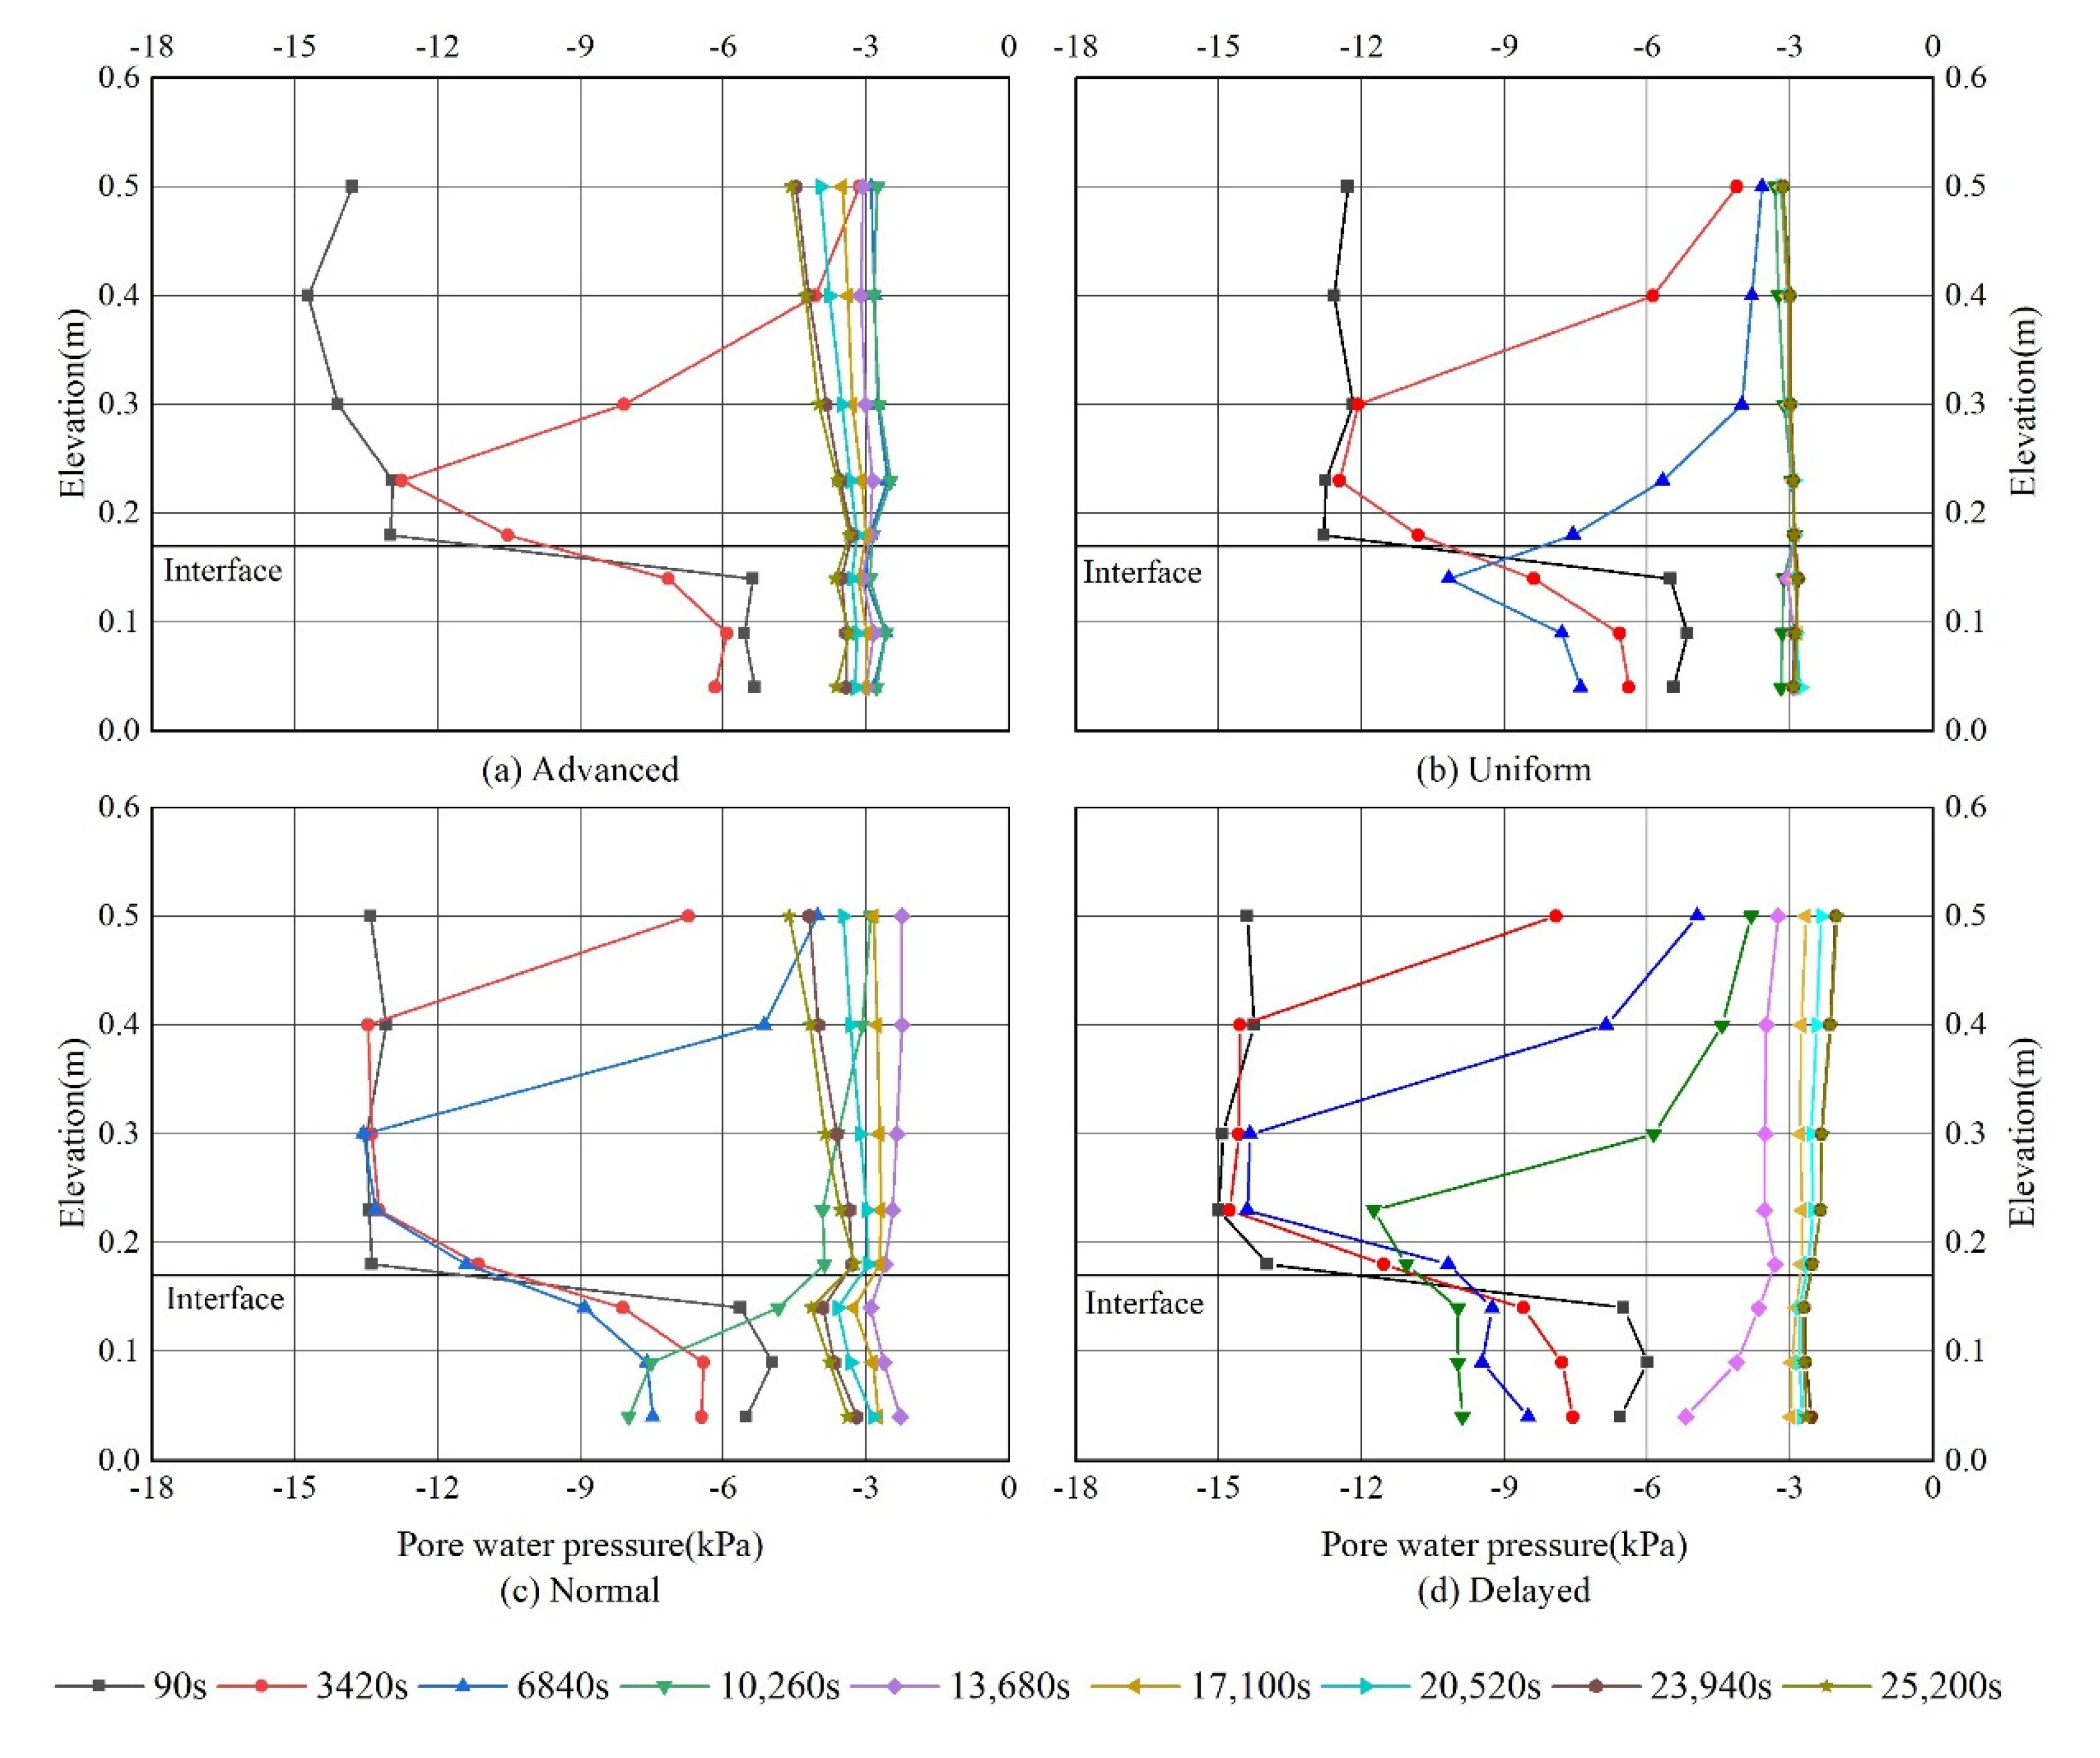
During the first 3420 s of the advanced rainfall pattern (Figure 11a), the PWP in the fine sand layer above and below the elevation of 0.23 m increased rapidly, but no change was observed at the elevation of 0.23 m. However, in the coarse sand layer, the PWP decreased slightly. The increase in PWP in the upper region resulted from rainwater infiltration. In contrast, the increase observed in the lower part of the fine sand was due to downward flow of the water under gravity that was then prevented by a capillary barrier effect formed at the interface. Subsequently, this resulted in the decrease in PWP in the coarse sand. In the middle of the rainfall, the PWP along the whole soil column increased rapidly. However, during the latter stages of rainfall, the PWP decreased gradually along the whole soil column.
For the uniform, normal and delayed rainfall patterns (Figure 11b–d), similar trends were observed at the initial and middle stages of rainfall. During the initial period, the PWP in the fine sand layer increased at a fast rate, while that in the coarse sand layer decreased slightly. At the middle stage of rainfall, the PWP along the whole of the soil column increased dramatically regardless of rainfall patterns. At the latter stages of rainfall, PWP varied between rainfall patterns. The PWP remained approximately unchanged until the end of the uniform rainfall, decreased gradually along the whole soil column during normal rainfall, and increased along the whole soil column during delayed rainfall. The PWP along the whole soil column showed a similar trend to that of the rainfall intensity variation at the end of rainfall patterns.
3.2.3. Breakthrough Time and Percolation
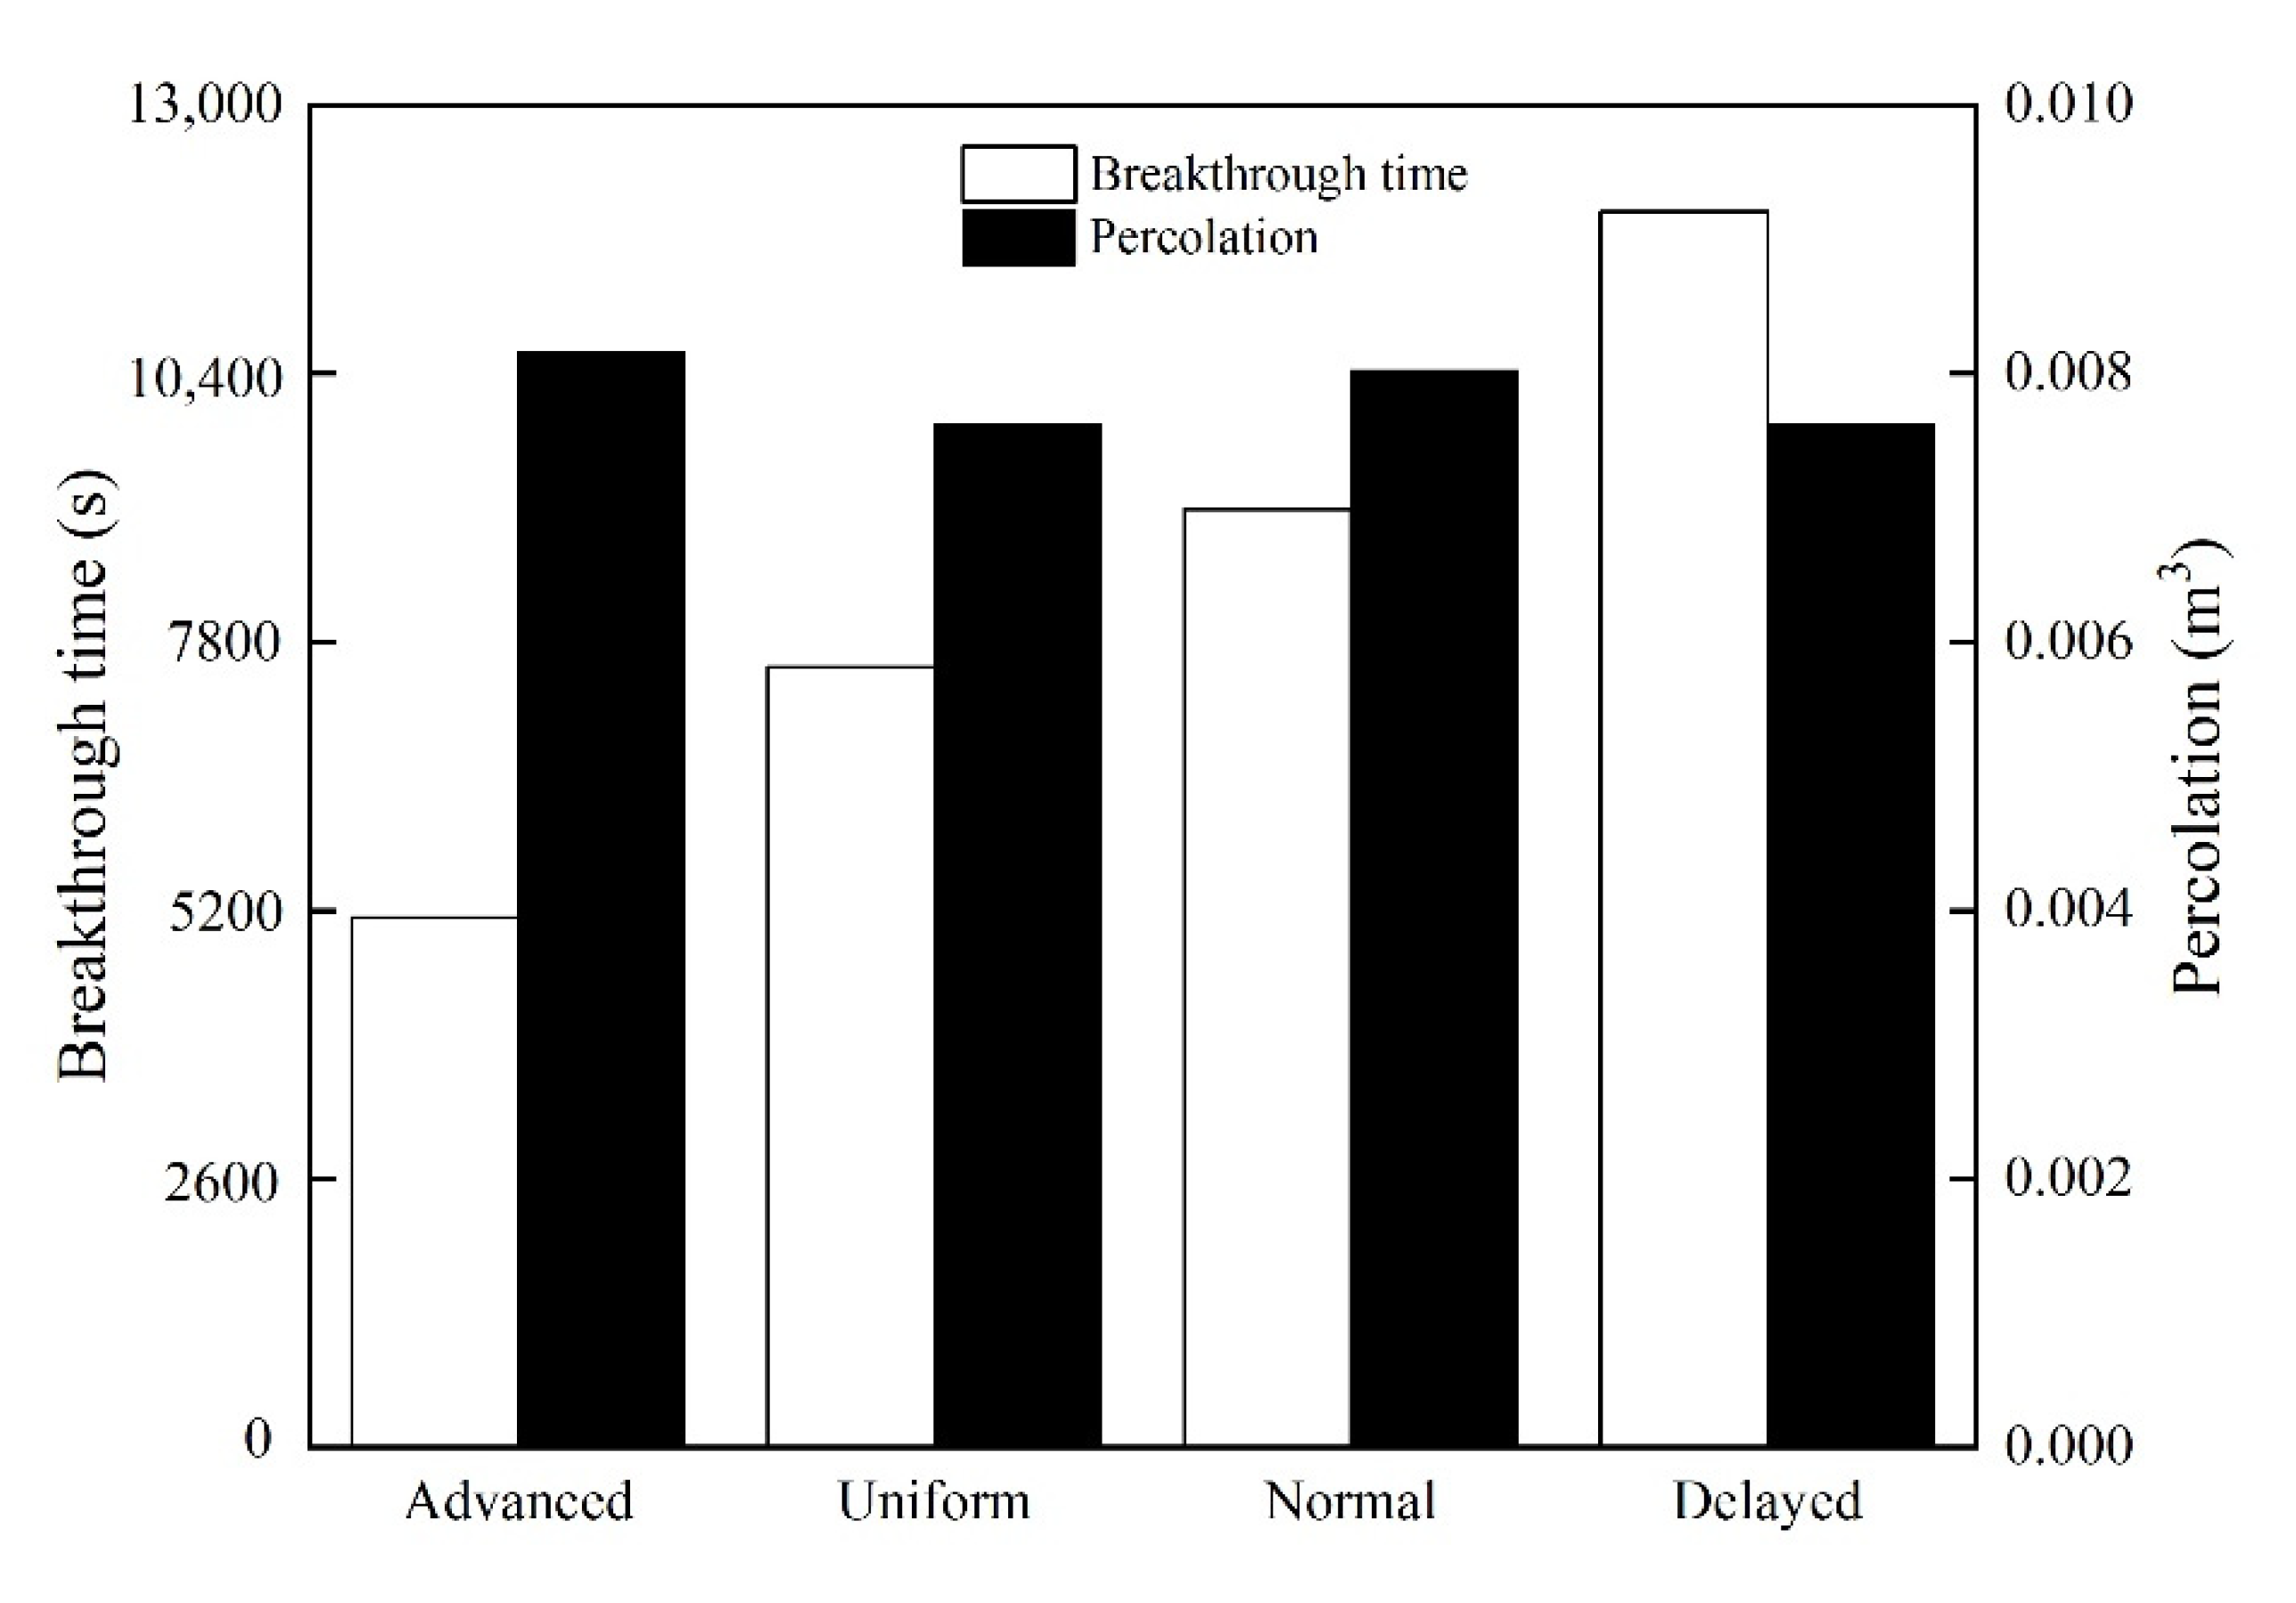
The breakthrough times were estimated to be t = 5130 s, t = 7560 s, t = 9090 s and t = 11,970 s for the advanced, uniform, normal and delayed rainfall patterns, respectively (Figure 10c).
Like short time rainfall, the advanced rainfall pattern required the shortest amount of time to break through the capillary barrier cover, and the delayed rainfall pattern took the longest time, with the two remaining patterns falling in between. The advanced rainfall pattern resulted in the largest accumulated percolation: 0.00815 m3, followed by normal (0.00803 m3), uniform (0.00763 m3) and finally the delayed rainfall pattern (0.00762 m3) (Figure 12).
3.3. Effect of Rainfall Patterns on the Behaviour of CBC
3.3.1. VWCs and PWP
Test results (Figure 7 and Figure 8) indicate that when rainfall duration is relatively short, the change in VWCs and PWP at the upper part of the capillary barrier cover are influenced by the rainfall pattern. However, at the lower part of the CBC, there is no significant influence of rainfall pattern on the VWCs and PWP, as evidenced by the fact that the trend of change in VWCs and PWP are similar for the four rainfall patterns. Figure 10 and Figure 11 indicate that, when rainfall duration is relatively long, the VWCs and PWP in the capillary barrier cover are all significantly influenced by the rainfall pattern, as the change of VWCs and PWP followed the pattern of rainfall. In summary, the rainfall patterns affect the VWCs and PWP in the capillary barrier cover differently under different rainfall conditions. When rainfall duration is relatively short, rainfall patterns only influence the upper part of the capillary barrier cover. However, when rainfall duration is relatively long, rainfall patterns can significantly influence the whole capillary barrier cover. This is because the short time rainfall has a relatively high intensity of rainfall, which can result in rapid saturation of the soil at the upper region of the capillary barrier cover. Thus, the infiltration rate in the upper soil changes with the saturation permeability of the upper soil, and the rainwater, which cannot infiltrate the upper soil, will produce runoff at the surface of the capillary barrier cover. The VWCs and PWP in the lower part of the capillary barrier cover were influenced by the incoming rainwater from the upper soil, and so they will be more influenced by the saturation permeability of the upper soil and less affected by the rainfall patterns. However, when rainfall duration is long, the rainfall intensity is relatively low, so the rainwater can fully infiltrate the capillary barrier cover during the rainfall period. When the rainfall intensity varies with time, the VWCs and PWP in the capillary barrier cover will also be affected by the rainfall pattern. This phenomenon has also been evidenced by the field data reported by Bosse [38].
3.3.2. Breakthrough Time
Rainfall patterns affect the breakthrough time (Figure 9 and Figure 12), as the breakthrough time for different rainfall patterns are different regardless of rainfall durations. For both rainfall durations, breakthrough time was observed to be the earliest for the advanced rainfall pattern, followed by uniform, normal and delayed rainfall patterns, respectively. The rainfall intensity for the advanced rainfall pattern is relatively high during the early stages of rainfall, and therefore it takes a relatively short time for rainwater to break through the interface. Conversely, the highest rainfall intensity appears at the end of rainfall for the delayed rainfall pattern, and therefore the time to break through the interface is longer.
3.3.3. Percolation
As can be seen from Figure 9 and Figure 12, the percolation of the CBC is also affected by the patterns of rainfall. For both rainfall durations, the advanced rainfall pattern resulted in the largest percolation, whereas the delayed rainfall pattern resulted in the least percolation. In addition, the difference of percolation between advanced and delayed rainfall patterns is influenced by rainfall durations. For a relatively short rainfall duration, the advanced rainfall pattern produced the percolation nearly three times that of the delayed rainfall pattern, while for a relatively long rainfall duration, the advanced and delayed rainfall pattern show limited difference in producing percolation.
This may be due to the fact that, under the advanced rainfall pattern, the highest rainfall intensity occurs in the early stage of rainfall, when the infiltration capacity of the ground surface soil is also higher. Therefore, a large volume of rainfall will infiltrate the CBC. By contrast, the greatest rainfall intensity in the delayed rainfall pattern appears at the end when the infiltration capacity of the ground surface soil is the lowest, and therefore only a small volume of rainwater will be absorbed into the CBC. As the total volume of rainfall is equal, the advanced rainfall pattern will absorb more rainwater into the CBC and thus produce more percolation. When rainfall duration is relatively long, the rainfall intensity is relatively low, and the rainwater will completely infiltrate the CBC regardless of the rainfall patterns. By contrast, when rainfall duration is relatively short, the rainfall intensity is relatively high and runoff is expected during the rainfall period. Therefore, the effect of the rainfall patterns on the percolation is less significant under prolonged rainfall conditions than short time rainfalls.
3.4. Effect of Rainfall Patterns on the Performance of Capillary Barrier Covers
The breakthrough time and the volume of percolation are used as criteria for evaluating the performance of the capillary barrier covers under rainfall conditions. The capillary barrier cover was more prone to being broken through when subjected to advanced rainfall patterns and appears to be more effective under delayed rainfall patterns (Figure 9 and Figure 12). The greatest and lowest volumes of percolation were generated under advanced and delayed rainfall patterns, respectively. These data indicate that capillary barrier covers are least efficient at preventing rainwater infiltration under advanced rainfall patterns, and were most effective versus delayed rainfall patterns, as the delayed rainfall pattern results in both the longest breakthrough time and the least volume of percolation, with the advanced rainfall pattern producing the least desirable results. Therefore, the advanced rainfall pattern can be considered the worst-case scenario when compared with the other tested rainfall patterns. Thus, in the designing of the capillary barrier covers, attention should not only be paid to the total volume and duration of rainfall but also the rainfall patterns.
4. Conclusions
In this study, a series of laboratory infiltration tests were conducted to clarify the effect of rainfall patterns on the behaviour and performance of the CBC and identify the most adverse rainfall pattern for the CBCs. The conclusions can be drawn as follows:
(1) Rainfall patterns can affect the VWC and PWP of the CBC. When rainfall duration is relatively short, the effect of rainfall patterns on the VWCs and PWP are significant in the upper region of the soil column, but not obvious in the lower part. By contrast, when rainfall duration is relatively long, the VWCs and PWP of the whole soil column show different trends in accordance with rainfall patterns.
(2) Rainfall patterns can also affect the volume of percolation and breakthrough time of the CBC. The advanced rainfall pattern generates the greatest volume of percolation, and results in the shortest breakthrough time, whereas the delayed rainfall pattern generates the smallest volume of percolation and results in the longest breakthrough time.
(3) The results of percolation and breakthrough time indicate that the CBC works more effectively under delayed rainfall patterns and is less efficient under the advanced rainfall pattern. Thus, the advanced rainfall pattern is the worst-case scenario for capillary barrier covers subjected to rainfall.
The results imply the necessity of involvement of rainfall patterns in the study of the CBCs subjected to rainfall and meanwhile provide helpful insight for the practical design of CBCs. The field factors (e.g., steepness, surface erosion and dimensional effect of the CBC), that are not considered in this study will be further investigated. In addition, the validation of this study with actual cases will be conducted in the future study.
Author Contributions
Laboratory experiments, X.L. and H.J.; methodology, N.L. and H.J.; data analysis, N.L. and H.J.; investigation, H.J. and X.L.; resources, N.L.; data curation, N.L. and X.L.; writing—original draft preparation, N.L.; writing—review and editing, H.J.; visualisation, X.L.; supervision, N.L.; project administration, N.L. All authors have read and agreed to the published version of the manuscript.
Funding
This research was funded by the Natural Science Foundation of Shanghai (Grant No. 16ZR1423300) and National Natural Science Foundation of China -Yalong River Joint Fund (Grant No. U1765110).
Conflicts of Interest
The authors declare no conflict of interest.
References
- Abdolahzadeh, A.M.; Vachon, B.L.; Cabral, R.A. Evaluation of the effectiveness of a cover with capillary barrier effect to control percolation into a waste disposal facility. Can. Geotech. J. 2011, 48, 996–1009. [Google Scholar] [CrossRef]
- Ross, B. The diversion capacity of capillary barriers. Water Resour. Res. 1990, 26, 2625–2629. [Google Scholar] [CrossRef]
- Yan, W.M.; Chiu, C.F.; Yuen, K.V. Prediction and modeling of permeability function and its application to the evaluation of breakthrough suction of a two-layer capillary barrier. Can. Geotech. J. 2017, 54, 778–788. [Google Scholar] [CrossRef]
- Yang, H.; Rahardjo, H.; Leong, E.-C. Behavior of unsaturated layered soil columns during infiltration. J. Hydrol. Eng. 2006, 11, 4. [Google Scholar] [CrossRef]
- Ng, C.W.W.; Liu, J.; Chen, R.; Coo, J.L. Numerical parametric study of an alternative three-layer capillary barrier cover system. Environ. Earth Sci. 2015, 74, 4419–4429. [Google Scholar] [CrossRef]
- McCartney, J.S.; Zornberg, J.G. Effects of infiltration and evaporation on geosynthetic capillary barrier performance. Can. Geotech. J. 2010, 47, 1201–1213. [Google Scholar] [CrossRef]
- Zhang, Q.; Werner, A.D.; Aviyanto, R.F.; Hutson, J.L. Influence of soil moisture hysteresis on the functioning of capillary barriers. Hydrol. Process. 2009, 23, 1369–1375. [Google Scholar] [CrossRef]
- Rahardjo, H.; Krisdani, H.; Leong, E.C. Application of Unsaturated Soil Mechanics in Capillary Barrier System. In Proceedings of the 3rd Asian Conference on Unsaturated Soils, Nanjing, China, 21–23 April 2007; pp. 127–137. [Google Scholar]
- Qian, T.; Huo, L.; Zhao, D. Laboratory Investigation into Factors Affecting Performance of Capillary Barrier System in Unsaturated Soil. Water Air Soil Poll. 2009, 206, 295–306. [Google Scholar] [CrossRef]
- Chen, R.; Liu, J.; Ng, C.W.; Chen, Z.K. Influence of Slope Angle on Water Flow in a Three-Layer Capillary Barrier Soil Cover under Heavy Rainfall. Soil Phys. Hydrol. 2019, 83, 1637–1647. [Google Scholar] [CrossRef]
- Yang, H.; Rahardjo, H.; Leong, E.C.; Fredlund, D.G. A study of infiltration on three sand capillary barriers. Can. Geotech. J. 2004, 41, 629–643. [Google Scholar] [CrossRef]
- Stormont, J.C.; Clifford, E. Capillary barrier effect from underlying coarser soil layer. J. Geotech. Geoenviron. Eng. 1999, 125, 8. [Google Scholar] [CrossRef]
- Indrawan, I.G.B.; Rahardjo, H.; Leong, E.-C. Drying and wetting characteristics of a two-layer soil column. Can. Geotech. J. 2007, 44, 20–32. [Google Scholar] [CrossRef]
- Harnas, F.R.; Rahardjo, H.; Leong, E.C.; Wang, J.Y. Experimental study on dual capillary barrier using recycled asphalt pavement materials. Can. Geotech. J. 2014, 51, 1165–1177. [Google Scholar] [CrossRef]
- Delage, P.; Coo, J.L.; So, P.S.; Chen, B.; Chao, Z.; Ng, C.W.W.; Cui, Y.J.; Ghabezloo, S.; Pereira, J.M.; Tang, A.M. Feasibility study of a new unsaturated three-layer landfill cover system. E3S Web Conf. 2016, 9, 13004. [Google Scholar]
- Ng, C.W.W.; Coo, J.L.; Chen, Z.K.; Chen, R. Water Infiltration into a New Three-Layer Landfill Cover System. J. Environ. Eng. 2016, 142, 04016007. [Google Scholar] [CrossRef]
- Zhan, T.L.T.; Li, H.; Jia, G.W.; Chen, Y.M.; Fredlund, D.G. Physical and numerical study of lateral diversion. Can. Geotech. J. 2014, 51, 1438–1448. [Google Scholar] [CrossRef]
- Ng, C.W.W.; Liu, J.; Chen, R.; Xu, J. Physical and numerical modeling of an inclined three-layer (silt/gravelly sand/clay) capillary barrier cover system under extreme rainfall. Waste Manag. 2015, 38, 210–221. [Google Scholar] [CrossRef]
- Aubertin, M.; Cifuentes, E.; Apithy, S.A.; Bussière, B.; Molson, J.; Chapuis, R.P. Analyses of water diversion along inclined covers with capillary barrier effects. Can. Geotech. J. 2009, 46, 1146–1164. [Google Scholar] [CrossRef]
- Zhang, L.M.; Ke, Y.Q. Combinations of soil materials for granular capillary barriers for minimizing rainfall infiltration and gas emission. Can. Geotech. J. 2017, 54, 1580–1591. [Google Scholar] [CrossRef] [Green Version]
- Li, J.H.; Du, L.; Chen, R.; Zhang, L.M. Numerical investigation of the performance of covers with capillary barrier effects in South China. Comput. Geotech. 2013, 48, 304–315. [Google Scholar] [CrossRef]
- Zhan, L.T.; Li, G.Y.; Jiao, W.G.; Lan, J.W.; Chen, Y.M.; Shi, W. Performance of a compacted loess/gravel cover as a capillary barrier and landfill gas emissions controller in Northwest China. Sci. Total Environ. 2020, 718, 137195. [Google Scholar] [CrossRef]
- Tsai, T.-L. The influence of rainstorm pattern on shallow landslide. Environ. Geol. 2008, 53, 1563–1569. [Google Scholar] [CrossRef]
- Rahimi, A.; Rahardjo, H.; Leong, E.C. Effect of Antecedent Rainfall Patterns on Rainfall-Induced Slope Failure. J. Geotech. Geoenviron. Eng. 2011, 137, 483–491. [Google Scholar] [CrossRef]
- Tsai, T.L.; Wang, J.K. Examination of influences of rainfall patterns on shallow landslides due to dissipation of matric suction. Environ. Earth Sci. 2011, 63, 65–75. [Google Scholar] [CrossRef]
- Zhan, T.L.T.; Qiu, Q.W.; Xu, W.J. Analytical solution for infiltration and deep percolation of rainwater into a monolithic cover subjected to different patterns of rainfall. Comput. Geotech. 2016, 77, 1–10. [Google Scholar] [CrossRef]
- Wu, L.Z.; Xu, Q.; Zhu, J.D. Incorporating hydro-mechanical coupling in an analysis of the effects of rainfall patterns on unsaturated soil slope stability. Arab J. Geosci. 2017, 10, 386. [Google Scholar] [CrossRef]
- Yinglan, A.; Wang, G.; Sun, W.; Xue, B.; Kiem, A. Stratification response of soil water content during rainfall events under different rainfall patterns. Hydrol. Process. 2018, 20, 1–12. [Google Scholar]
- Parent, S.-É.; Cabral, A. Design of Inclined Covers with Capillary Barrier Effect. Geotech. Geol. Eng. 2006, 24, 689–710. [Google Scholar] [CrossRef]
- Bussière, B.; Aubertin, M.; Zhan, G. Design of Inclined Covers with Capillary Barrier Effect by S.-E. Parent and A. Cabral. Geotech. Geol. Eng. 2007, 25, 673–678. [Google Scholar]
- Lambe, T.W. Soil Testing for Engineers; John Wiley and Sons, Inc.: New York, NY, USA, 1951. [Google Scholar]
- Lambe, T.W.; Whitman, R.V. Soil Mechanics, SI Version; John Wiley and Sons, Inc.: New York, NY, USA, 1979; pp. 245–246. [Google Scholar]
- Fredlund, D.G.; Rahardjo, H. Soil Mechanics for Unsaturated Soils; John Wiley and Sons, Inc.: New York, NY, USA, 1994. [Google Scholar]
- SL237-1999. Specification of Soil Test; Ministry of Water Resources of the People’s Republic of China: Beijing, China, 1999.
- Mualem, Y. A new model for predicting the hydraulic conductivity of unsaturated porous media. Water Resour. Res. 1976, 12, 513–522. [Google Scholar] [CrossRef] [Green Version]
- Lee, L.M.; Gofar, N.; Rahardjo, H. A simple model for preliminary evaluation of rainfall-induced slope instability. Eng. Geol. 2009, 108, 272–285. [Google Scholar] [CrossRef]
- Li, N.; Xu, J.-C.; Qi, Y.-Z. Research on calculation model for stability evaluation of rainfall-induced shallow landslides. Rock Soil Mech. 2012, 33, 1485–1490. (In Chinese) [Google Scholar]
- Bossé, B.; Bussiere, B.; Hakkou, R.; Maqsoud, A.; Benzaazoua, M. Assessment of phosphate lime stone wastes as a component of a Store-and-Release Cover in a Semiarid Climate. Mine Water Environ. 2013, 32, 152–167. [Google Scholar] [CrossRef]
Figure 1.
Procedure of this study.

Figure 2.
Soil-water characteristic curve (SWCC) fitted to the Van Genuchten (V-G) equation for (a) fine sand and (b) gravelly sand.
Figure 2.
Soil-water characteristic curve (SWCC) fitted to the Van Genuchten (V-G) equation for (a) fine sand and (b) gravelly sand.

Figure 3.
Unsaturated hydraulic conductivity functions for the fine sand and gravelly sand.

Figure 4.
Soil column testing apparatus (mm).

Figure 5.
Measuring devices and data logger system: (a) Soil column, (b) Vacuum pump, (c) Tensiometers, (d) Time-domain reflectometry TDR, (e) Electronic balance scale, (f) Data logger, (g) Computer.
Figure 5.
Measuring devices and data logger system: (a) Soil column, (b) Vacuum pump, (c) Tensiometers, (d) Time-domain reflectometry TDR, (e) Electronic balance scale, (f) Data logger, (g) Computer.

Figure 6.
Typical rainfall patterns employed in this study.

Figure 7.
Variations of volumetric water content with time at (a) z = 0.4 m, (b) z = 0.18 m, (c) z = 0.14 m and (d) z = 0.09 m under relatively short rainfall duration.
Figure 7.
Variations of volumetric water content with time at (a) z = 0.4 m, (b) z = 0.18 m, (c) z = 0.14 m and (d) z = 0.09 m under relatively short rainfall duration.

Figure 8.
Pore water pressure profiles under relatively short rainfall duration. (a) Advanced, (b) Uniform, (c) Normal and (d) Delayed.
Figure 8.
Pore water pressure profiles under relatively short rainfall duration. (a) Advanced, (b) Uniform, (c) Normal and (d) Delayed.

Figure 9.
Breakthrough time and percolation in four rainfall patterns under relatively short rainfall duration.
Figure 9.
Breakthrough time and percolation in four rainfall patterns under relatively short rainfall duration.

Figure 10.
Variations of volumetric water content with time at (a) z = 0.4 m, (b) z = 0.18 m, (c) z = 0.14 m and (d) z = 0.09 m under relatively long rainfall duration.
Figure 10.
Variations of volumetric water content with time at (a) z = 0.4 m, (b) z = 0.18 m, (c) z = 0.14 m and (d) z = 0.09 m under relatively long rainfall duration.

Figure 11.
Pore water pressure profiles under relatively long rainfall duration. (a) Advanced, (b) Uniform, (c) Normal and (d) Delayed.
Figure 11.
Pore water pressure profiles under relatively long rainfall duration. (a) Advanced, (b) Uniform, (c) Normal and (d) Delayed.

Figure 12.
Breakthrough time and percolation in four rainfall patterns under relatively long rainfall duration.
Figure 12.
Breakthrough time and percolation in four rainfall patterns under relatively long rainfall duration.


Table 1.
Basic properties of materials used in the study.
| Fine Sand | Gravelly Sand | |
|---|---|---|
| Dry density, (g/cm3) | 1.38 | 1.53 |
| Specific gravity, | 2.622 | 2.533 |
| Saturated permeability, (cm/s) | 3.48 × 10⁻³ | 5.63 × 10⁻¹ |
Table 2.
Van Genuchten equation fitting parameters of soils.
| Symbol | Fine Sand | Gravelly Sand | |
|---|---|---|---|
| Saturated volumetric water content | 0.4501 | 0.3706 | |
| Residual volumetric water content | 0.0281 | 0.0281 | |
| V-G fitting parameters | a | 0.3301 | 1.1581 |
| n | 2.4651 | 3.5066 | |
| m | 0.5943 | 0.7148 |
Table 3.
Design of rainfall infiltration tests.
| Series | Total Rainfall Amount (mL) | Cases | Rainfall Duration (min) | Rainfall Patterns |
|---|---|---|---|---|
| I | 12,000 | 1 | 120 | Advanced Normal Uniform Delayed |
| 2 | 400 | |||
| II | 9000 | 1 | 90 | |
| 2 | 300 | |||
| III | 6000 | 1 | 60 | |
| 2 | 200 |
Publisher’s Note: MDPI stays neutral with regard to jurisdictional claims in published maps and institutional affiliations. |
© 2020 by the authors. Licensee MDPI, Basel, Switzerland. This article is an open access article distributed under the terms and conditions of the Creative Commons Attribution (CC BY) license (http://creativecommons.org/licenses/by/4.0/).
Share and Cite
MDPI and ACS Style
Li, N.; Jiang, H.; Li, X. Behaviour of Capillary Barrier Covers Subjected to Rainfall with Different Patterns. Water 2020, 12, 3133. https://doi.org/10.3390/w12113133
AMA Style
Li N, Jiang H, Li X. Behaviour of Capillary Barrier Covers Subjected to Rainfall with Different Patterns. Water. 2020; 12(11):3133. https://doi.org/10.3390/w12113133
Chicago/Turabian StyleLi, Ning, Haohong Jiang, and Xinzhen Li. 2020. "Behaviour of Capillary Barrier Covers Subjected to Rainfall with Different Patterns" Water 12, no. 11: 3133. https://doi.org/10.3390/w12113133
Note that from the first issue of 2016, this journal uses article numbers instead of page numbers. See further details here.