Review

A Need for Standardized Reporting: A Scoping Review of Bioretention Research 2000–2019

1
Department of Civil and Mineral Engineering, University of Toronto, Toronto, ON M5S 1A4, Canada
2
Department of Chemical Engineering and Applied Chemistry, University of Toronto, Toronto, ON M5S 3E5, Canada
3
Department of Earth Sciences, University of Toronto, Toronto, ON M5S 3B1, Canada
4
Engineering & Computer Science Library, University of Toronto, Toronto, ON M5S 3G4, Canada
*
Author to whom correspondence should be addressed.
These authors contributed equally to this paper.
Water 2020, 12(11), 3122; https://doi.org/10.3390/w12113122
Submission received: 28 September 2020 / Revised: 1 November 2020 / Accepted: 5 November 2020 / Published: 7 November 2020

Abstract

:
Bioretention cells are a type of low-impact development technology that, over the past two decades, have become a critical component of urban stormwater management. Research into bioretention has since proliferated, with disparate aims, intents and metrics used to assess the “performance” of bioretention cells. We conducted a comprehensive, systematic scoping review to answer the question of “How is the field performance of bioretention assessed in the literature?”, with the aim of understanding (1) how is the performance of bioretention defined in the literature? (2) what metrics are used to assess actual and theoretical performance? A review of 320 studies (mostly peer reviewed articles) found that performance was defined in terms of hydrologic controls, while investigations into water quality pathways and mechanisms of contaminant transport and fate and the role of vegetation were lacking; additionally, long term field and continuous modelling studies were limited. Bioretention field research was primarily conducted by a small number of institutions (26 institutions were responsible for 50% of the research) located mainly in high income countries, particularly Australia and the United States. We recommend that the research community (I) provide all original data when reporting results, (II) prioritize investigating the processes that determine bioretention performance and (III) standardize the collection, analysis and reporting of results. This dissemination of information will ensure that gaps in bioretention knowledge can be found and allow for improvements to the performance of bioretention cells around the world.

1. Introduction

Stormwater management (SWM) has traditionally focussed on flood control through conveyance and water quantity control, with the goal of protecting human life and property during extreme events. Increased understanding of the importance of maintaining surface water resources and the significant adverse impacts caused by urbanization has shifted this conveyance-centred approach towards an approach that aimed to mimic a catchment’s natural, pre-urbanization hydrologic patterns that promote infiltration and evapotranspiration. The goal of this type of development is to improve stormwater management and lessen or eliminate negative environmental impacts on urban waterways. This more holistic design and management approach is known as low impact development (LID) or green infrastructure (GI) in North America, as water sensitive urban design (WSUD) in Australia, as sustainable urban drainage systems (SUDS) in the UK [1], and as the “Sponge City” concept in China [2]. We will refer to this approach with its North American term, LID.
Bioretention systems (also referred to as rain gardens, stormwater biofilters, or bioinfiltration systems) are a vital technology used to implement the LID practice in all of these regions. Bioretention systems are usually installed in a distributed manner in depressions on developed sites to receive runoff from parking lots, roofs, roadways and driveways to manage runoff closer to the source [3]. Typically, bioretention systems have an engineered filter zone consisting of soil planted with vegetation, and a bowl or ponding area to allow for the temporary storage of surplus runoff.
The functional qualities, or design objectives, of bioretention vary depending on the regional climate, local regulations, and site-specific characteristics and use. Researchers, operators, and regulators often question and examine a bioretention system’s “performance”, i.e., does bioretention achieve its intended design objectives? However, there is no unified definition of what “performance” means in the context of bioretention, and no agreement on how to assess if these systems are achieving their intended functions. In addition to directing the design objective of bioretention, site-specific conditions also affect bioretention performance once operational, making comparisons between field studies difficult even when the objectives are broadly similar. To some extent, laboratory studies can overcome limitations associated with field studies by performing experiments under carefully controlled conditions, allowing for reliable, replicable results. However, the difficulty then becomes translating results from controlled laboratory conditions to the specific conditions of the field. A significant advancement in bioretention design over the past decade has been the increasing prominence and utility of computer models for predicting, understanding, and improving system performance. Modelling studies accounted for 21% of the studies screened in this scoping review and provide an essential tool for allowing researchers to overcome the limitations of field studies. Models can be informed by the processes and understanding gained through laboratory studies, allowing for greater understanding of the processes at play in field bioretention systems.
Previous reviews synthesizing research on bioretention have been almost exclusively narrative review [3,4,5,6,7], which are reliant on the potential biases of the experts when selecting references to review [8]. A scoping review is an investigative tool used to give a rigorous, detailed analysis of the state of a field and posit questions to which narrower systematic reviews could feasibly find answers. A scoping review is conducted by systematically searching and screening a defined area of the literature, then synthesizing the knowledge from a broad field into key concepts, types of evidence, and gaps in research [9]. Scoping reviews are particularly useful for bringing together sources of knowledge, definitions and evidence from a range of sources [10]. This scoping review builds and expands on prior reviews which focussed either on specific aspects of bioretention [5,6,11] or on reviewing design guidance and the results of bioretention performance studies [3,4,7].
The aim of this study was to use the scoping review methodology to answer the primary research question: “How is the field performance of bioretention assessed in the literature?”. Under that primary research question are two sub-questions: (1) how is the performance of bioretention defined in the literature? (2) what metrics are used to assess actual and theoretical performance? Herein, we applied the scoping review method [9,12,13,14] to provide a comprehensive overview of the current state of knowledge on the real-life operational performance of bioretention. We provide a comprehensive dataset of journal articles on bioretention from which a subset was reviewed to understand how bioretention research is assessing the in situ performance of bioretention systems. This synthesis allowed us to identify gaps and inconsistencies in the literature, discover areas where systematic conclusions could be drawn about bioretention system performance, characterize barriers to drawing systematic conclusions, recognize trends in the literature (particularly with respect to geographic locations, timing, and performance metrics), and recommend tools and best practices that could enable research on bioretention performance and future directions.

2. Materials and Methods

The methodology for this scoping review followed established protocols [9,12,13,14] of five core steps and one optional step: first, identify the research question; second, identify relevant studies; third, select studies; fourth, extract data (referred to as “charting the data” by some sources); fifth, collate and report results. A graphical representation of the review team’s methodology is shown in a PRISMA (Preferred Reporting Items for Systematic Reviews and Meta-Analyses) diagram (Figure 1).

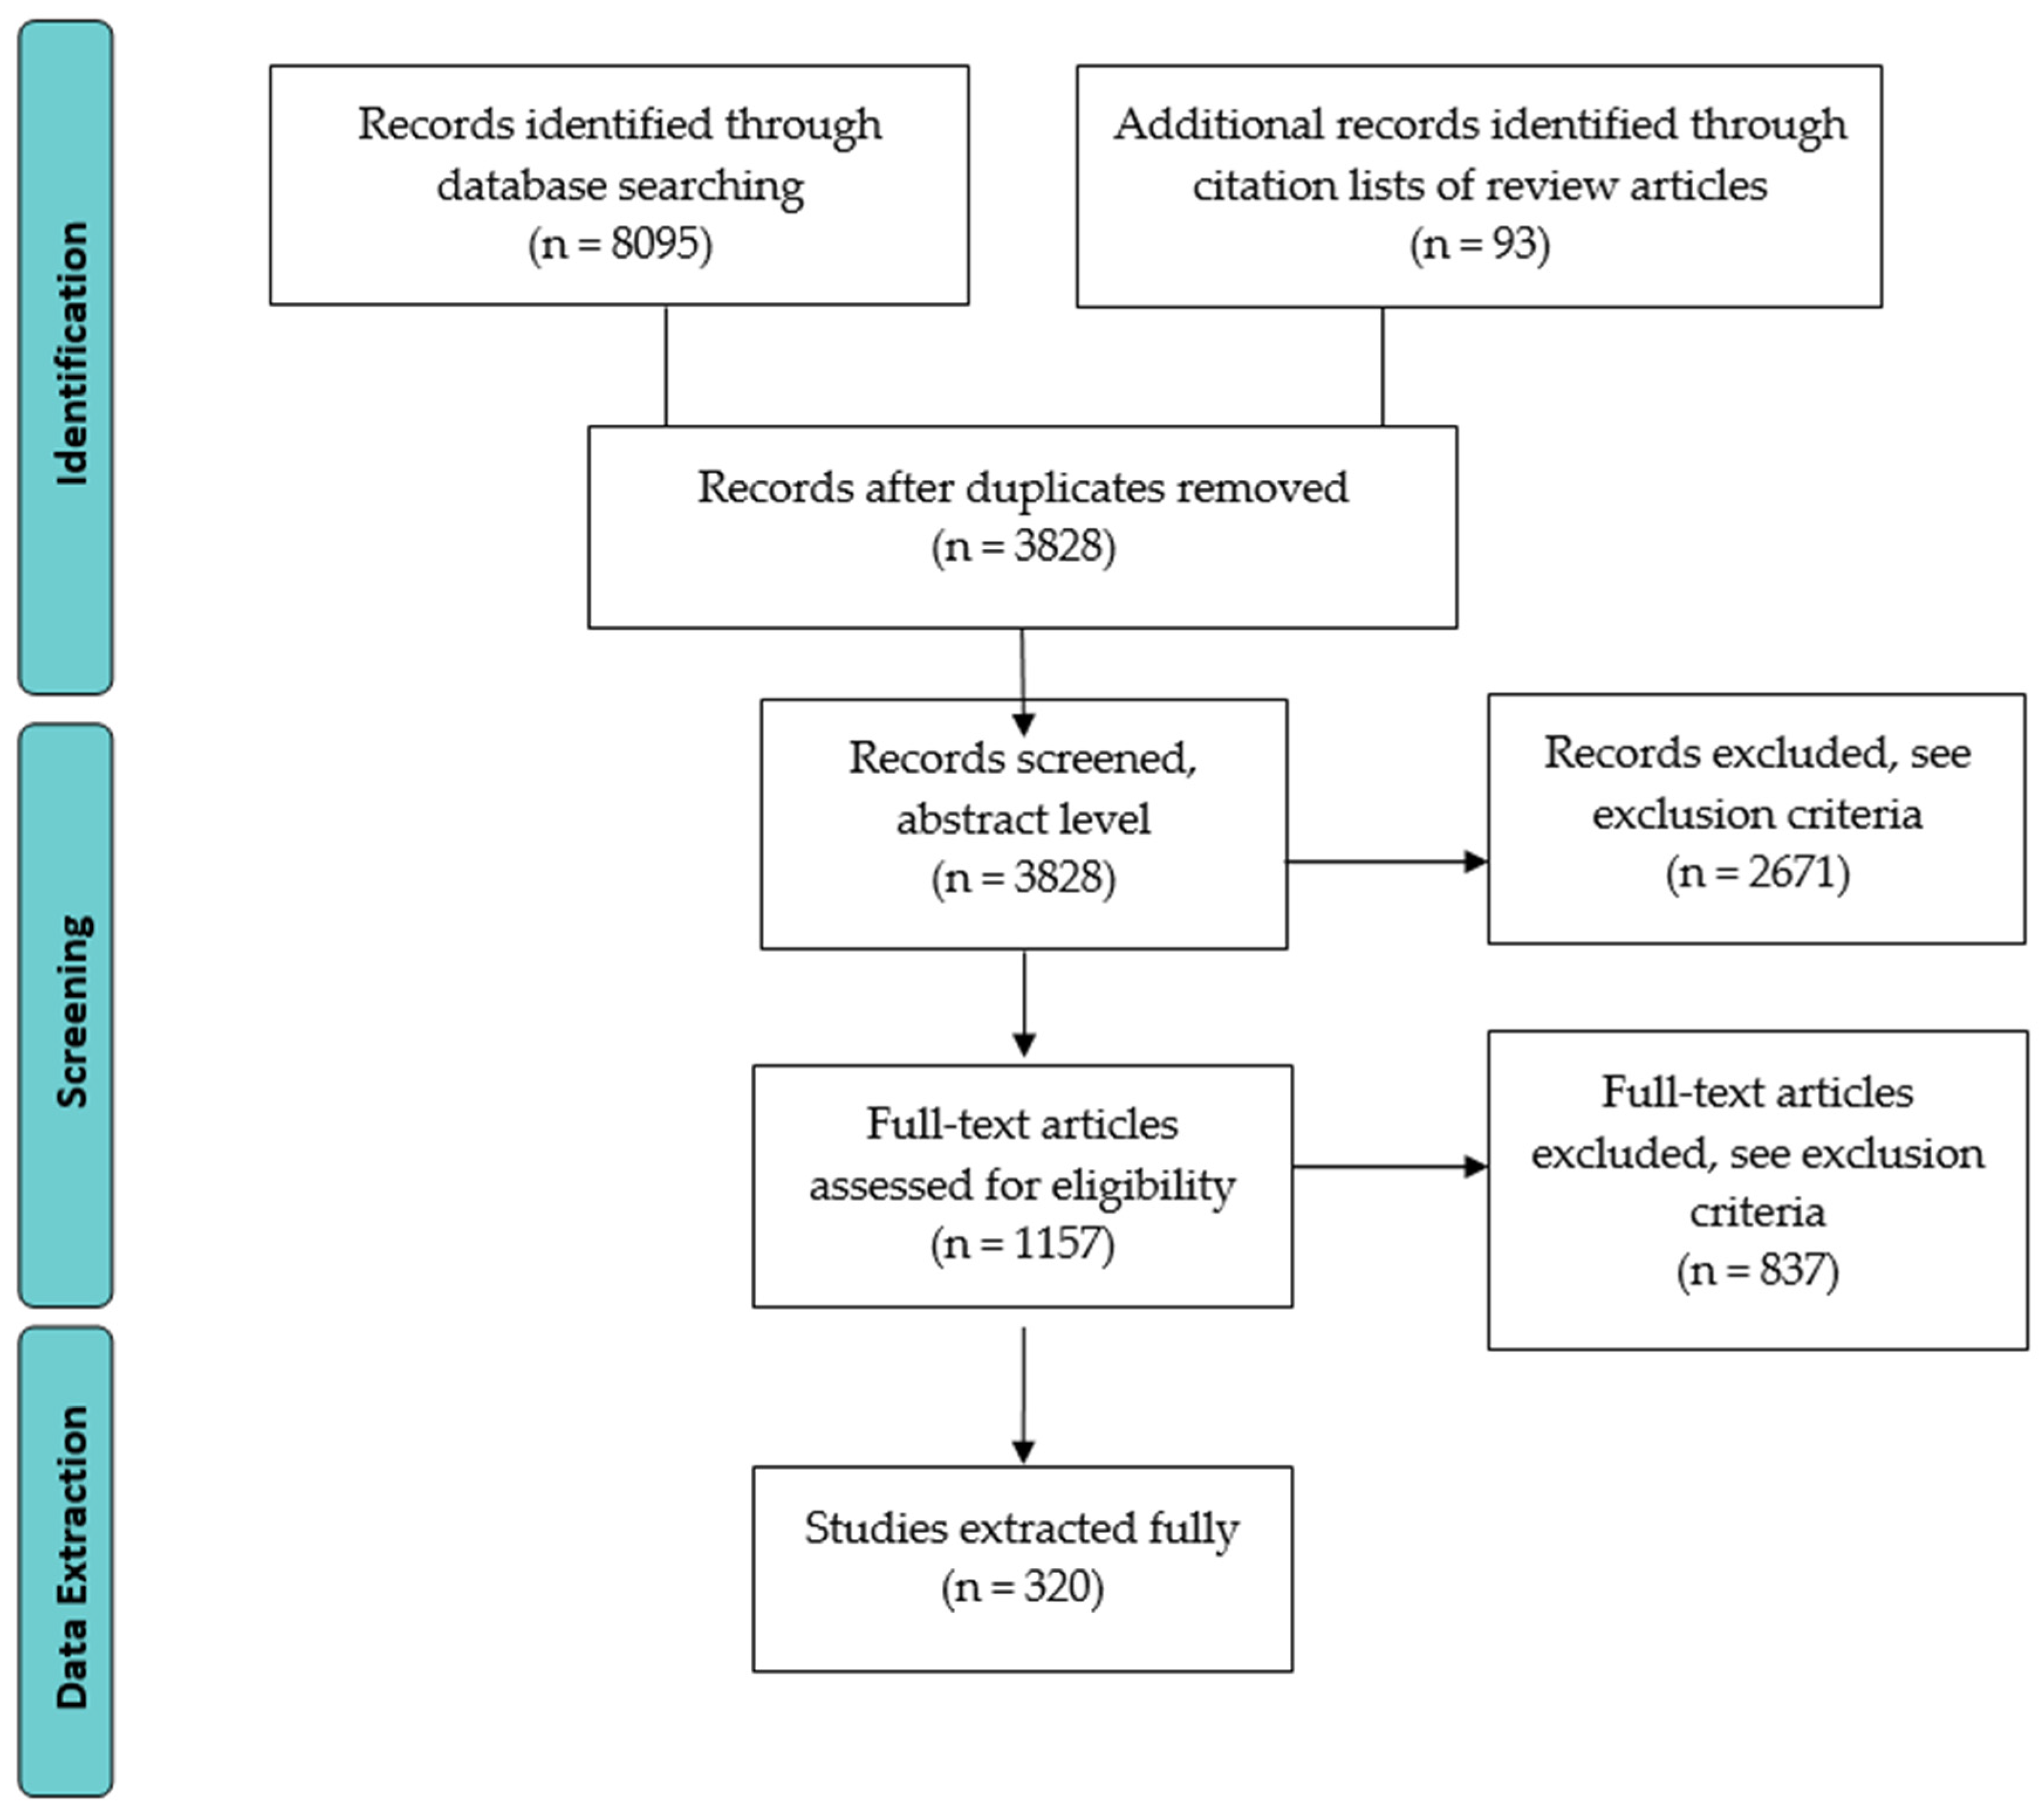
2.1. Identifying Relevant Studies

Relevant studies were identified from peer-reviewed literature. Eleven databases (See Supplementary Information File S1, Table S1, spanning the fields of engineering, urban planning, architecture, earth sciences and biology, were searched between 25 September and 31 October 2018 and again on 4 April 2020. Ninety-three “review articles” were subsequently reviewed for their citation list, with any additional citations screened and added. An intentionally broad range of search terms on variants of the name “bioretention” was used in searching, as well as terms referring to stormwater and hydrology. Search parameters can be found in Supplementary Information File S1. The search resulted in downloading 8095 citations across 11 databases followed by a deduplication process using Endnote [15] that removed 4360 citations.

2.2. Study Selection

A set of inclusion and exclusion criteria, listed in Table 1, were developed to ensure that stormwater systems described in all studies met the definition of a bioretention cell and that the research independently studied the treatment of urban stormwater. We focussed on field and modelling studies, as discussed in the introduction. Other criteria included limits on the type and language of publication. The inclusion and exclusion criteria were developed iteratively, with definitions refined based on the experience of the reviewers. When a new criterion was developed, all previously screened articles were reviewed again.
Two reviewers (co-authors of this paper) screened each article according to the criteria in two phases: first by title and abstract, then by full text. Rayyan, a free online tool for systematic reviews, was used for screening articles for inclusion and exclusion criteria [16]. Conflicting decisions over inclusion were discussed and resolved by the reviewers. In the event of continued disagreement, the inclusion/exclusion decision was resolved by a third reviewer.
At the title and abstract level screen, 2671 articles were excluded as they did not meet the study criteria for inclusion and 1157 articles proceeded to the full-text screen. During the full-text screen, 837 articles were excluded as per the criteria in Table 1. The criteria with the largest number of exclusions (286) were studies where the methodology type was “laboratory”, and as such, this list of publications is included in Supplementary Information File S2. A total of 320 articles remained for data extraction. All extracted articles, including article metadata such as author, year of publication, title and journal title, are listed in Supplementary Information File S2.

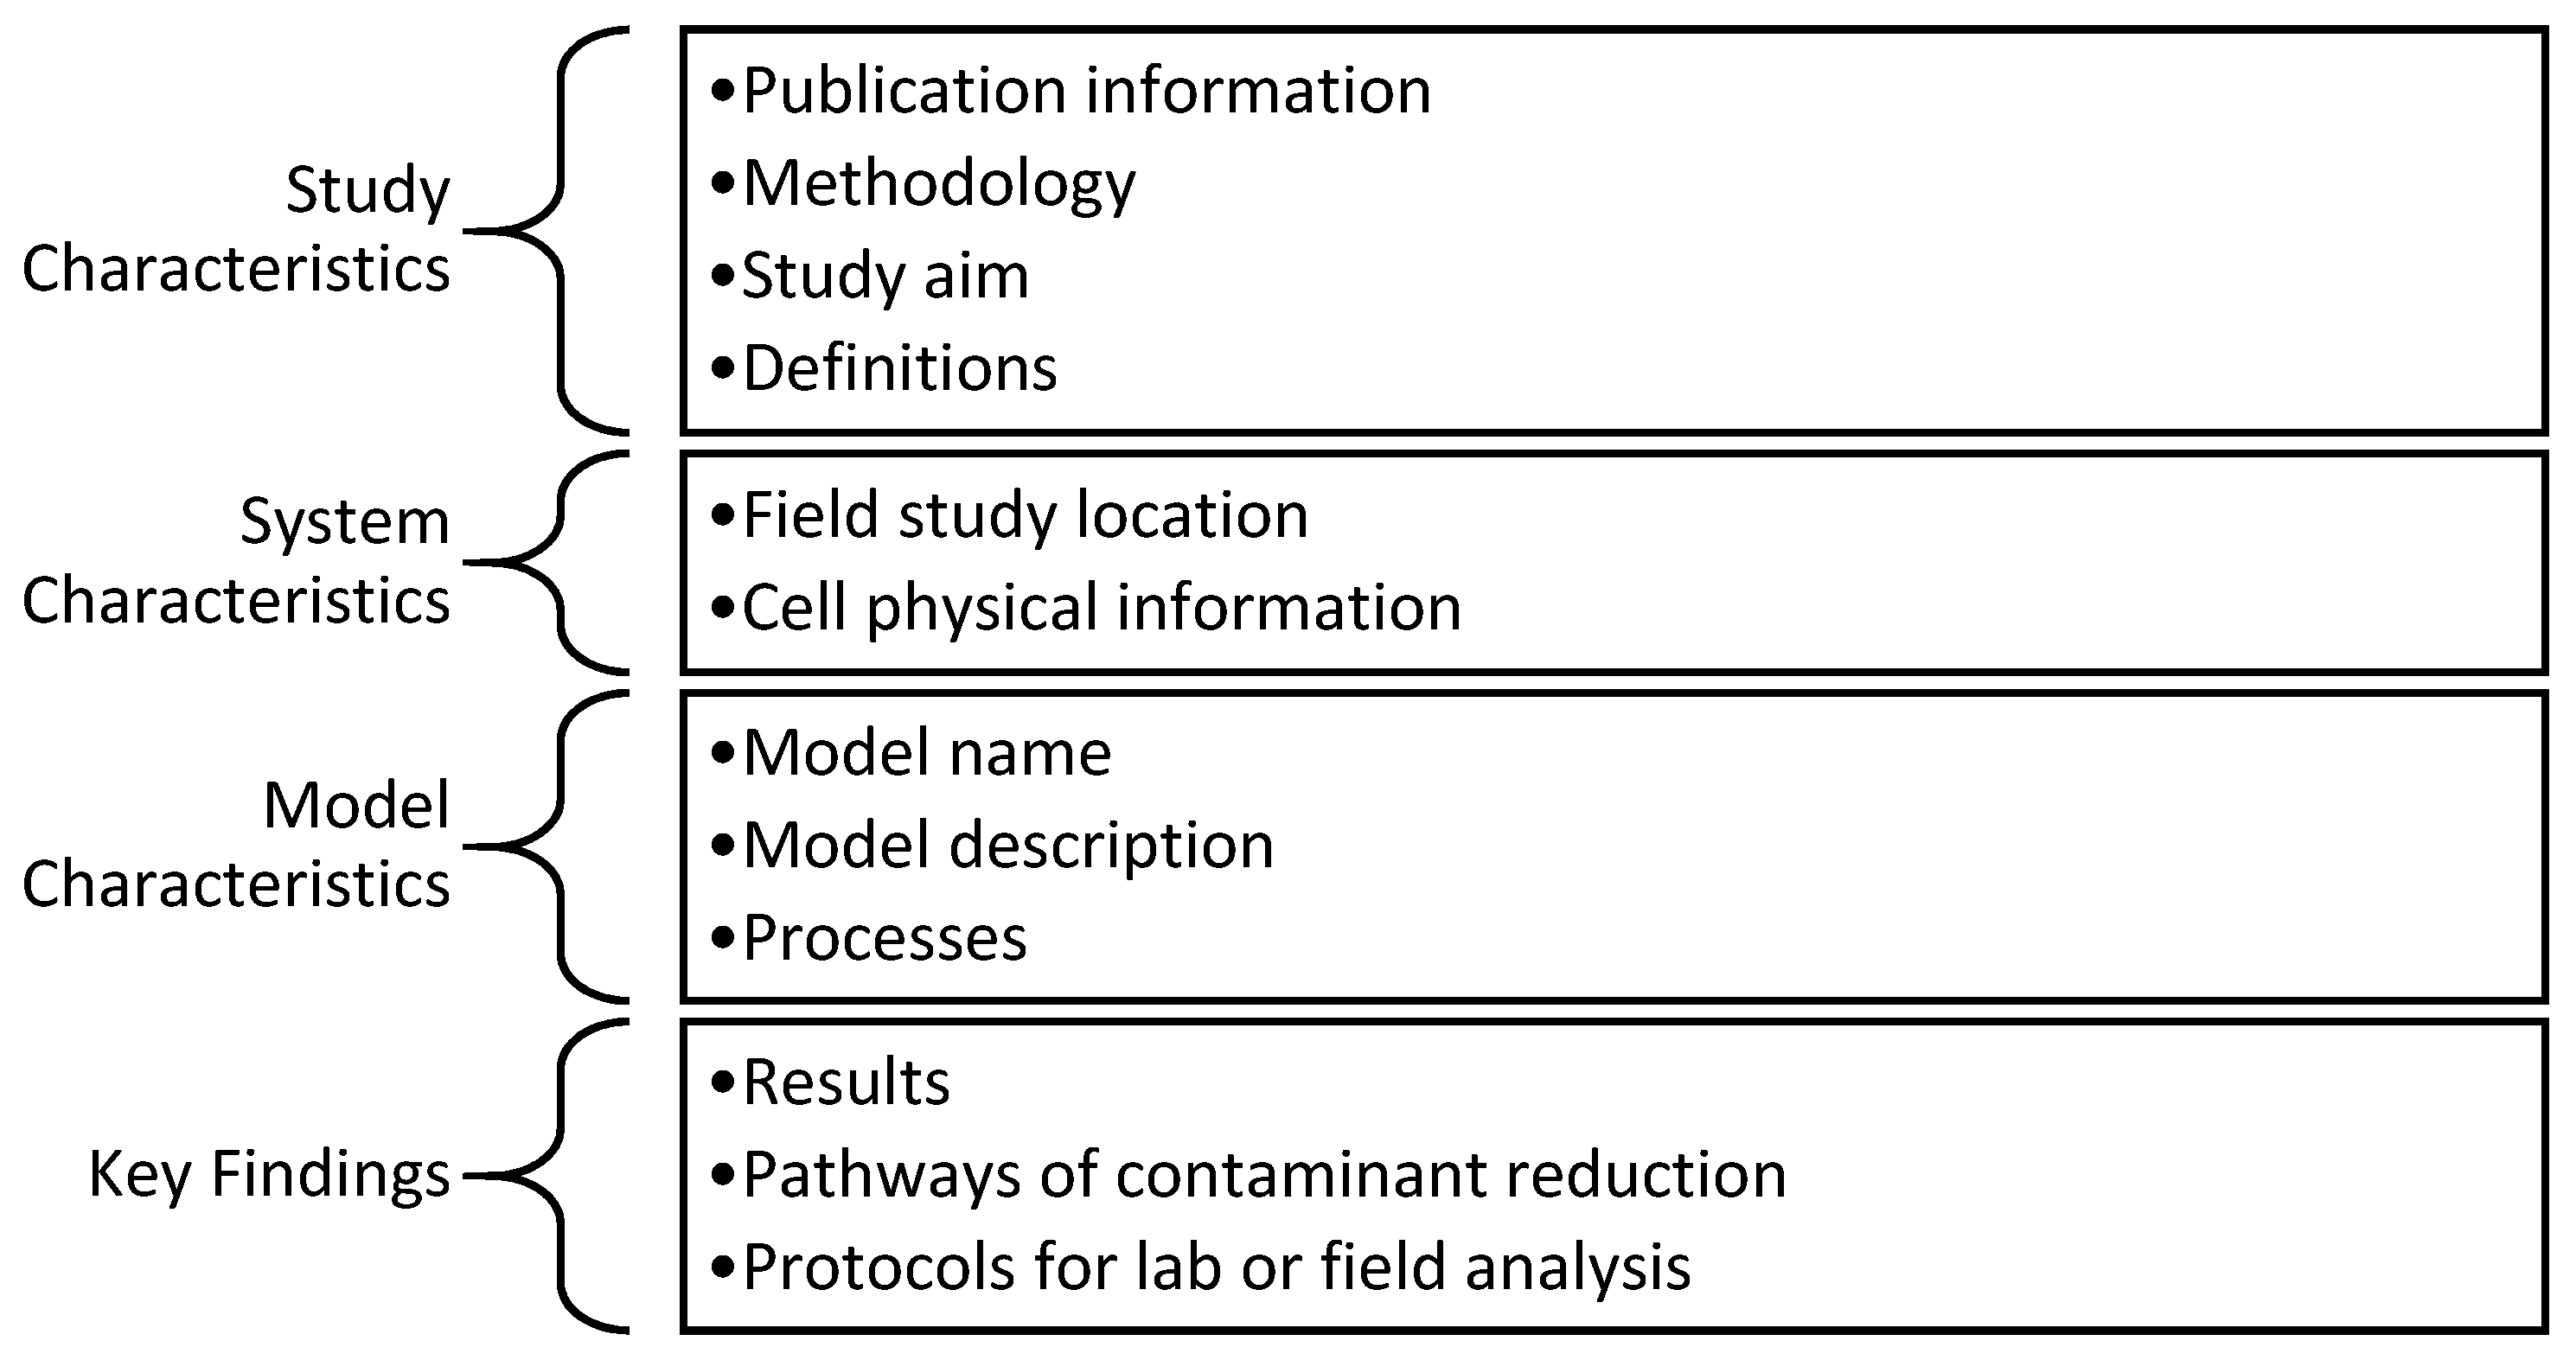
2.3. Data Extraction

Each article was assigned one reviewer for data extraction. To ensure consistency among reviewers, 18 out of 320 articles (5.6%) were extracted by two reviewers. The extracted data included study information such as who was performing the research, the location and specific design parameters of the bioretention cell being studied, how the study was conducted, and the type of results that were reported. The data extraction template, including explanations for each data extraction field, is included in Supplementary Information File S3. The extracted data are also included as a downloadable spreadsheet in Supplementary Information File S4. Data extraction included four broad categories (Figure 2).
The publication information within the study characteristics category was automatically extracted from the citation metadata by Endnote. The author affiliation (academic, government, consulting, or other) was extracted from the listed affiliation of the first author at the time of publication. A collaboration was defined as a publication in which the authors had different affiliation types. Information about the methodology, study aim and definitions was extracted from the full-text, such as information on the duration of the study, its stated aims, etc.
The system characteristics category compiled a field bioretention system’s location, dimensions and configuration (e.g., presence of an underdrain). Data were extracted by the reviewers and analyzed either in Excel or with GIS software [17,18]. Bioretention cell locations were charted with data on their administrative area [19] and Köppen–Geiger climate zone [20]. Characteristics were recorded on a per-cell basis; as field sites frequently include multiple bioretention cells, the denominator when reporting was much higher than the number of studies (602 cells for which data were extracted, across 320 studies). Some field locations included multiple systems, while others were researched multiple times as the system aged. A field location that was studied by five different researchers or included five independent bioretention cells generated the equivalent amount of academic output. Thus, the variable “cell-times studied” was defined as the sum of the number of times a specific bioretention cell was investigated across all studies.
The model characteristics category compiled information on the models used, the processes the models represented and their computational basis. The majority of data in the model characteristics category were extracted by one reviewer experienced in modeling, subject to the same 5% overlap with other reviewers for quality assurance and control.
The key findings category compiled the results presented in the studies, including whether the study focused on hydrology, contaminant transport and fate processes or other types of findings, how the authors defined “performance”, the protocols used for lab and field analysis, etc. The specific contaminants under investigation were tracked and classified as metals, nitrogen, phosphorus, total suspended solids (TSS), organic contaminants (e.g., polyaromatic hydrocarbons), pathogens (e.g., E. coli, viruses), and/or general. The “General” category included measurements such as pH, chemical oxygen demand (COD), temperature, chloride ion concentration and electrical conductivity. A study was identified as using an “established protocol” whenever the methodology referenced a prior researcher or standard for how to report or calculate a parameter. A “researcher-developed protocol” was defined as reporting methods or calculations that were shown but did not reference any precedents or standards. “Black-Box” studies were defined as those that did not specify pathways and only measured results at the inlet and outlet.

3. Results and Discussion

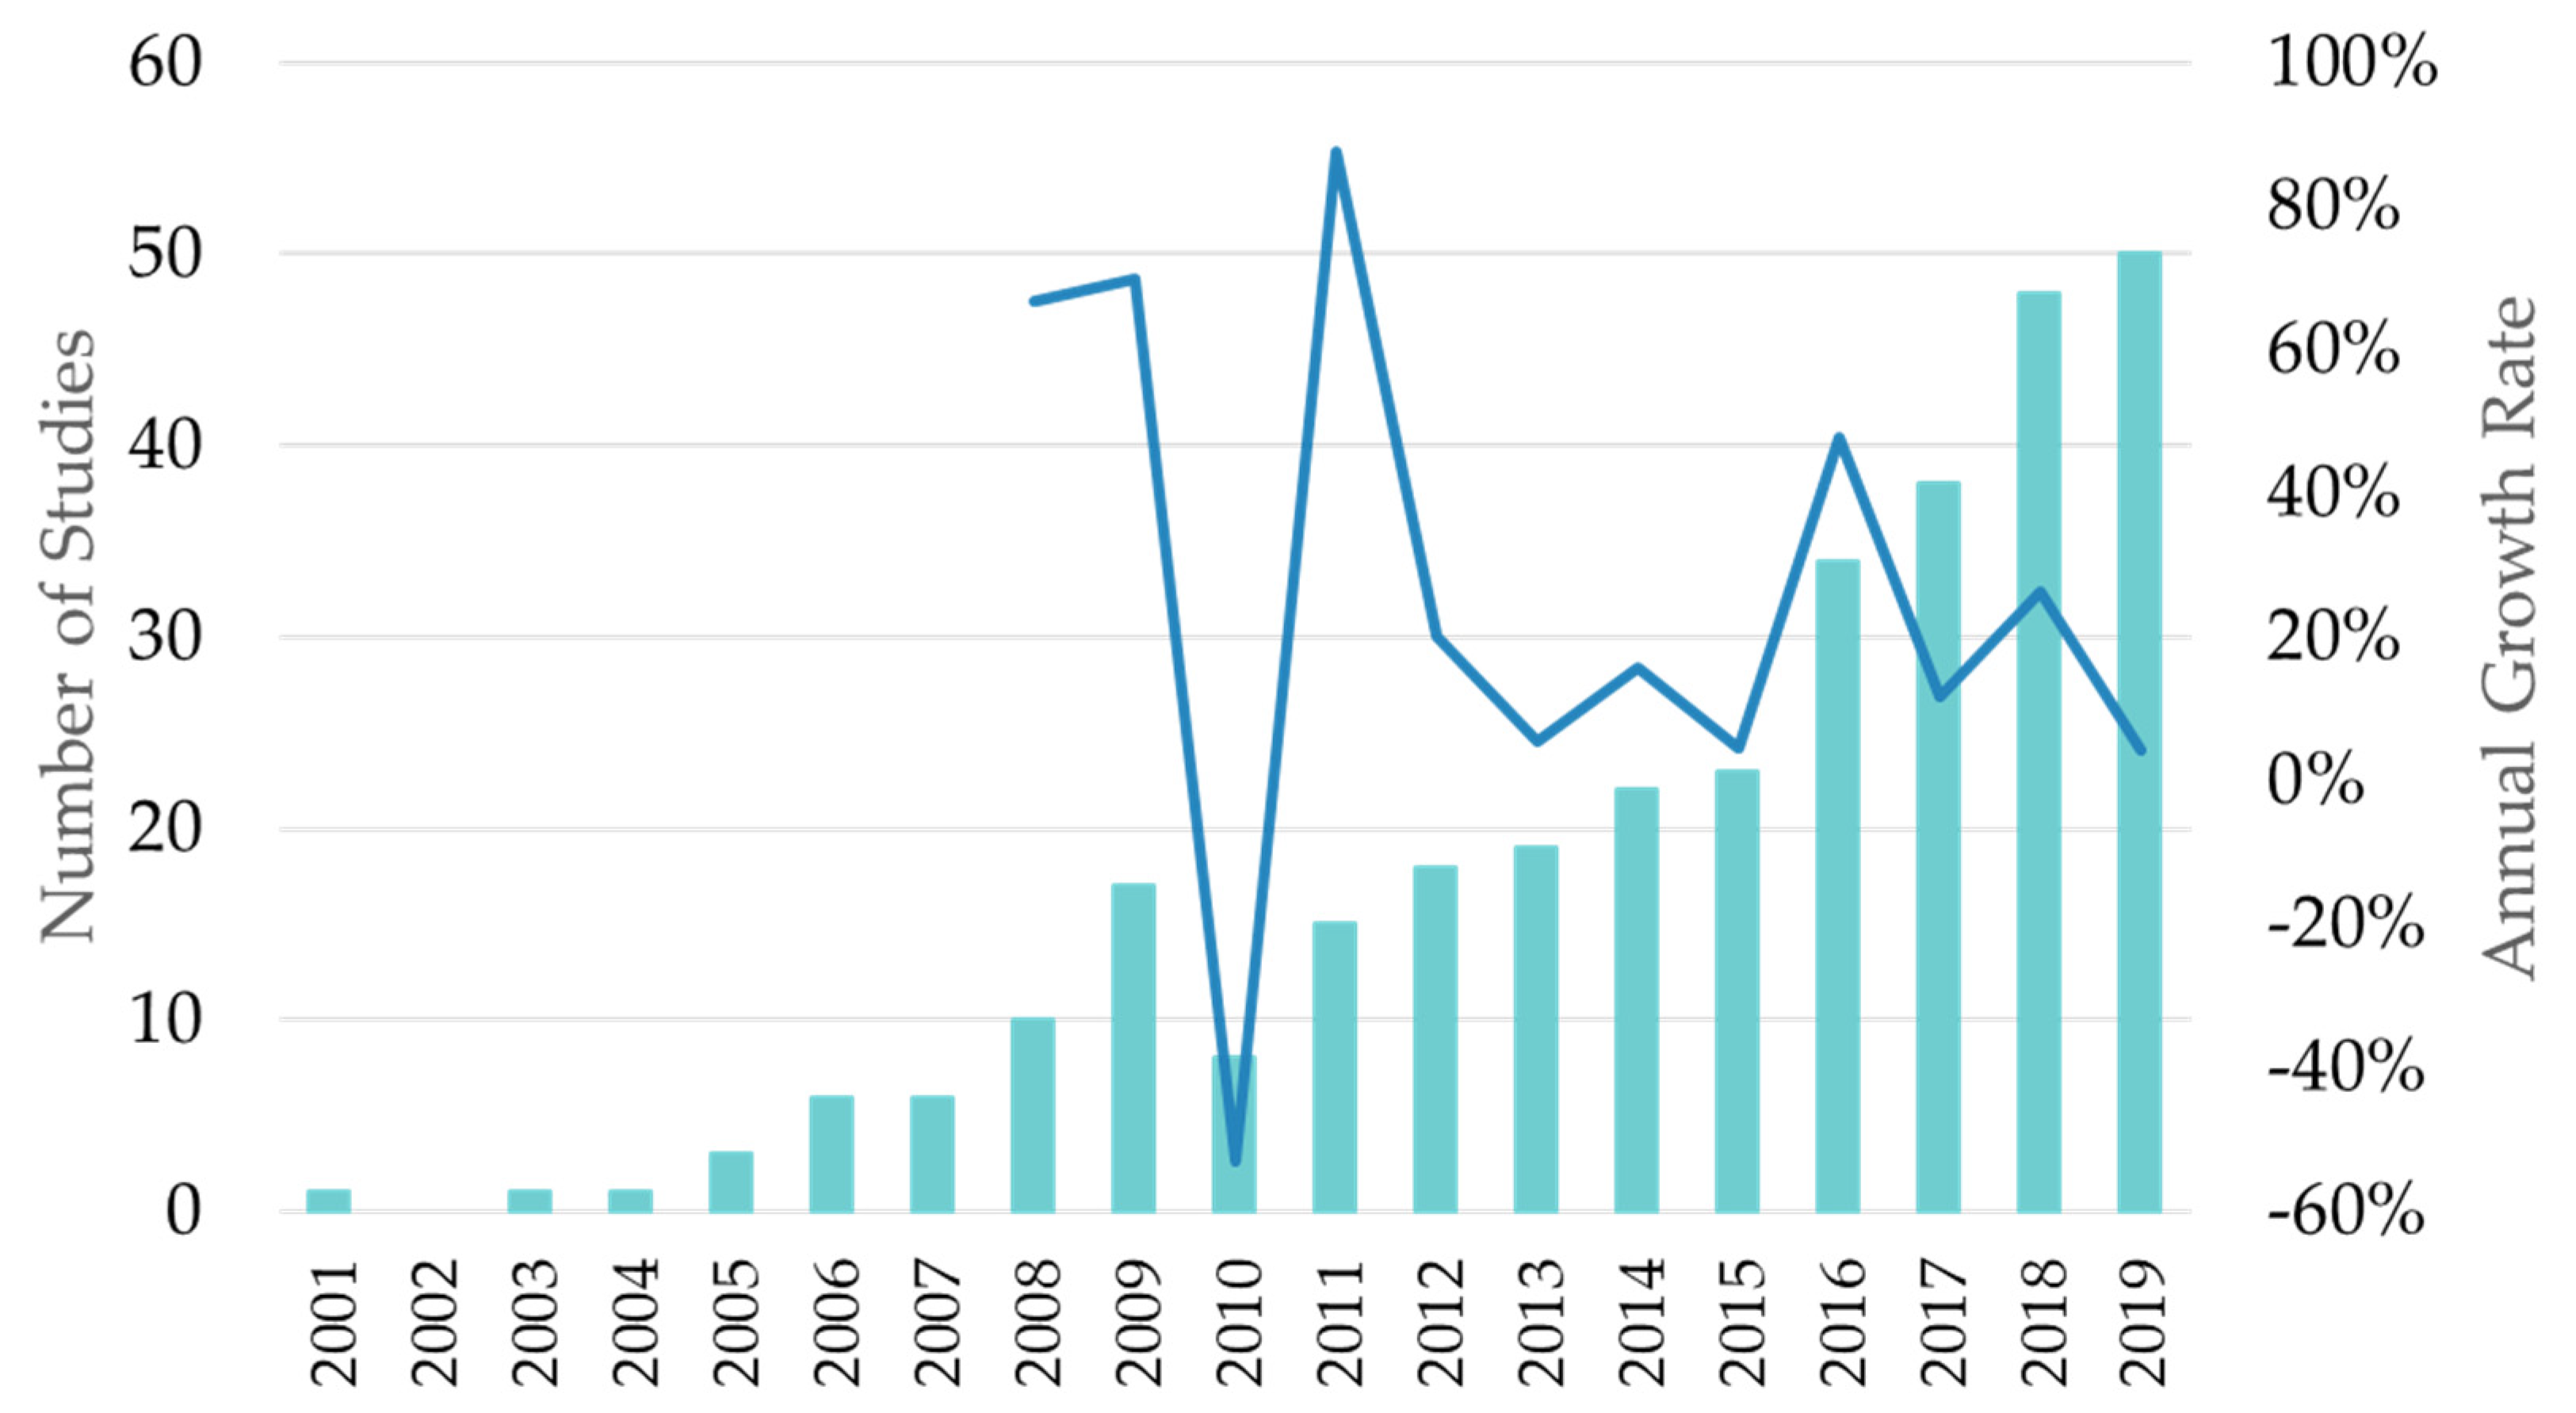
3.1. Study Characteristics

Bioretention research in academia has grown steadily since 2000. The Prince George’s County Maryland Low-Impact Design Manual [21], published in 1993, is the first known guidance document that describes a bioretention system. The first known academic research on bioretention was presented at the American Society of Civil Engineers’ Annual Water Resources Planning and Management Conference in 1999 [22]. As shown in Figure 3, less than 20 studies per year were published prior to 2010. There was a drop in publications in 2010, likely coinciding with reduced research output associated with the 2008 global recession. Annual publications of bioretention research have increased since 2011, as shown in Figure 3. Longitudinal trends in bioretention research over time are discussed further in Section 3.2.1, Section 3.2.4 and Section 3.3.
The literature has been dominated by academics in engineering, with 82% percent of authors (263 out of 320) having their discipline in civil, environmental, chemical, or biological engineering. All articles published before 2006 were authored by researchers in engineering disciplines. Since then, the field has diversified, with an average of 12% of articles published between 2006 and 2015 and 23% of articles published between 2016 and 2019 having authors in fields other than engineering such as environmental science, chemistry, horticultural science, and more. More than 90% of publications (296 out of 320) had a first author affiliated with an academic institution, usually within civil engineering. Only 3% of publications included an author from a government agency and 3% of publications included an author from the private sector. Less than 20% of publications with a first author from an academic institution also included an author from outside of academia, with only 15% (47/320) publications appearing to have collaborated across industry, academic institutions or with government agencies. The journals with the most bioretention publications were the Journal of Environmental Engineering, Water Science and Technology, and Ecological Engineering.
Although 163 different institutions led research in bioretention field or model performance (defined by the home institution of the lead author), research has mostly originated from a few institutions in clusters in the northeastern United States, eastern Australia, and more recently, China. Notable centres of high research output include North Carolina State University (USA), the University of Maryland (USA), Monash University (Australia), Villanova University (USA) and Xi’an University of Technology (China). These five institutions have each published more than ten peer-reviewed studies and account for 24% (77/320) of reviewed articles. Twenty-six institutions, publishing more than three studies apiece, accounted for 50% (159/320). Universities in the northeastern United States were the dominant publishers from 2000 to 2019, with no single other geographic area accounting for significant research in 2000–2005. Australian and Chinese research clusters appeared in the 2006–2010 and the 2011–2019 periods, respectively, and these countries accounted for the second- and third-most publications overall, after researchers from the United States.

3.2. Bioretention System Characteristics

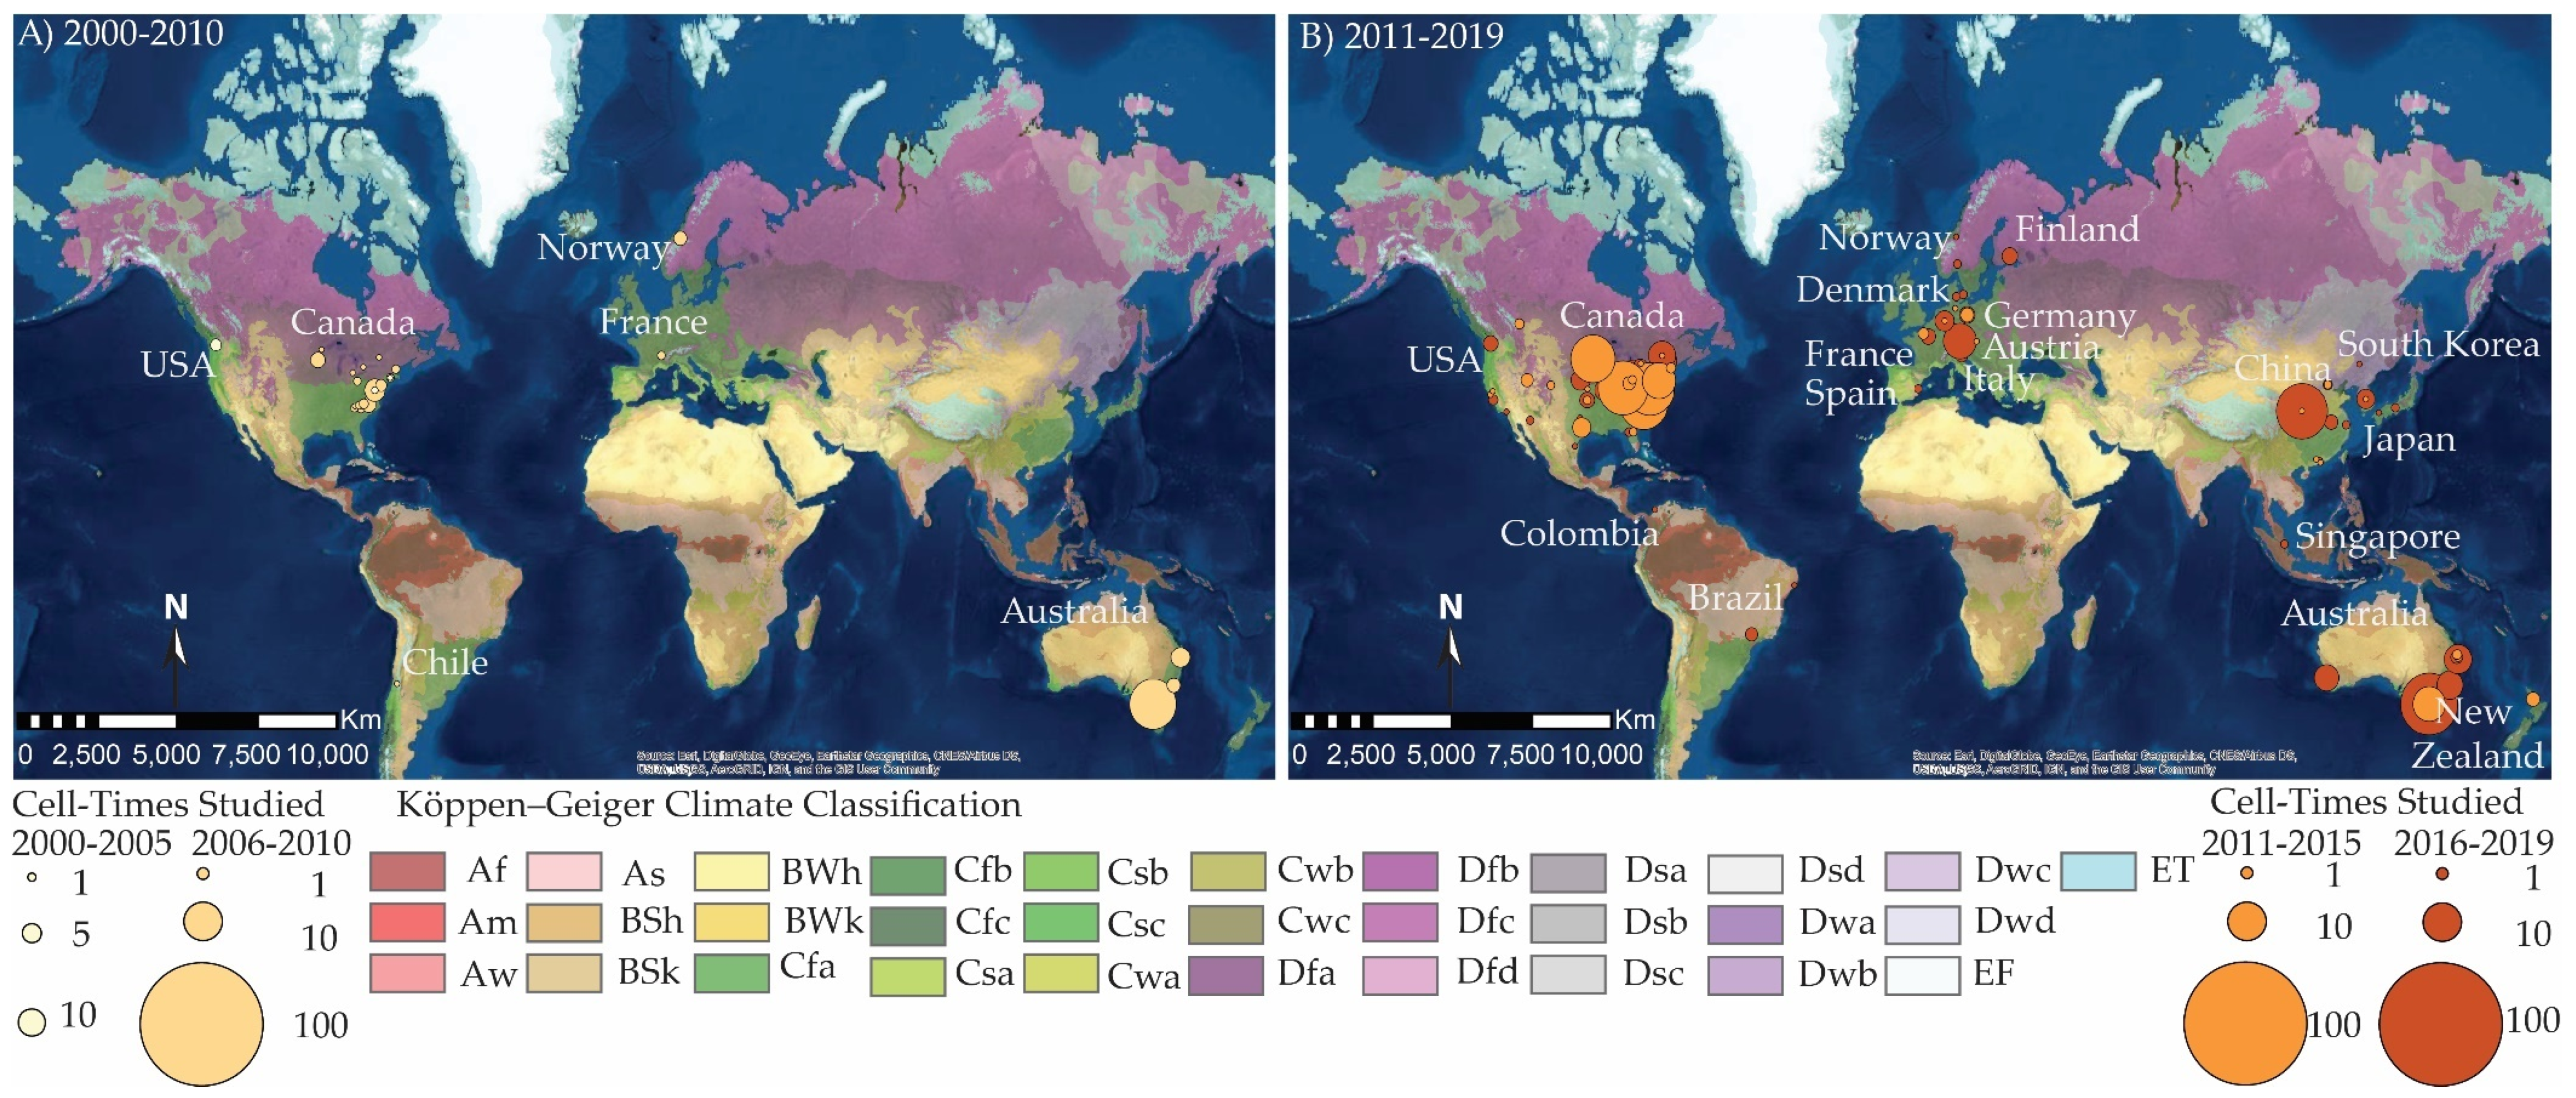
3.2.1. Bioretention System Location

The location of a bioretention cell was a key variable influencing both the design of and results from bioretention field studies. The 237 field articles in our dataset examined a total of 953 bioretention systems across 457 unique locations (some locations contained more than one cell). These 953 cells were studied an average of 1.6 times each, with 44% reported in more than one study. Overall, performance data was published from a total of 1289 cell-times studied. Studied bioretention cells were located in 19 countries from every populated continent except for Africa (Figure 4).
Bioretention field research originated in the United States and was then rapidly adopted in Australia; these two countries accounted for the majority of bioretention field research output with 59% (727/1289) and 22% (310/1289) of cell-times studied, respectively (Figure 4). Other early adopters were Canada and countries in Western Europe, which accounted for 3% (37/1289) and 8% (108/1289) of cell-times studied, respectively. Beginning in 2015, the dominance of Australia and the United States dropped from >90% of cell-times studied before 2016 to approximately 65% afterwards. Much of this change was due to a rapid increase in research originating in China, which accounted for 8% (103/1289) of cell-times studied overall but 15% (98/668) after 2016.
Unsurprisingly, field studies have tended to be conducted in cities close to lead research institutions. American field research was clustered on the Eastern Seaboard from Washington D.C. to Middlesex, Connecticut [23,24,25,26], while there are three Australian clusters centered close to or within Melbourne [27,28,29], Brisbane [27,28,30], and Sydney [28,31]. The rapid increase in research from China nearly all came from the province of Shaanxi [32,33,34,35], which developed as a cluster after 2015. The median distance between a bioretention cell and a research institution was 18 km. Most studies, i.e., 90%, were within 230 km of a research institution, and 75% were within 60 km.
Generally, we observed that the spread of bioretention field research between countries followed a pattern where investigation first occurred in institutions and areas of similar climate to established research clusters and then spread to institutions and areas in more diverse climate zones. The clearest example of this is in Australia, where between 2006–2015, all 127 of the cell-times studied were in temperate climate zones without a dry-season (Cfa or Cfb), the same climate zone as the original American cluster on the Eastern Seaboard, but after 2016, 12% (22/183) were in regions with a dry season (Csa or Csb). In China, a similar pattern has emerged as most of the first (2014–2015) domestically published results on full-scale bioretention cells were in temperate climate zones around Guangdong and Hong-Kong. At the same time, the now-larger research cluster near Xi’an University first built several pilot and prototype-scale systems before expanding to investigations of full-scale systems and publishing research findings in 2017. One exception to this pattern is a bioretention cell that was studied in Beijing [35] (located on the border of the temperate and arid-steppe climate zones) in 2014, which supports the contention that research locations are being driven by proximity to institutions as well as by the climate. More recent research in tropical climate zones has explicitly noted the lack of research on bioretention in tropical regions as a barrier to implementation [36]. These regions face climate-related challenges such as high rainfall intensity and long dry seasons. Interestingly, the first bioretention cells in our dataset from Brazil were from regions with a Cfa climate zone, for which there has been a significant amount of research in Australia, while more recently Brazilian research has been performed in an As (tropical savanna, dry summer) climate zone. Researchers from Colombia have also reported good results in translating bioretention practices to tropical conditions [37], indicating that a community of practice is developing for bioretention research in tropical areas. Two publications [38,39] from the Ferdowsi University (Iran) in collaboration with researchers from Australia, provide examples of knowledge transfer between two geographically separated arid regions.
The rise of bioretention research has often followed environmental policy within the country of research institutions. We found either guidelines on LID technologies or governmental policies promoting their use [2,40,41,42,43,44,45,46,47] in all countries with studied field bioretention cells. However, the existence of policy alone was insufficient in spurring or accelerating bioretention research. For example, the US EPA Clean Water Act established regulations targeting non-point source pollution in 1992 [48], and guidelines and research for Low Impact Development followed suit [21,49]. These guidelines were followed by bioretention research starting in the year 2000. Similarly, in Australia, Water Sensitive Urban Drainage came into usage in the 1990s to protect water quality and conserve water [50], however research in Australia only began to be published after 2005. Several studies and guidelines on source control of urban drainage were published in European countries between 1990 and 2006 [42]. The expansion of publications on bioretention in China in 2015–2018 closely follows the Sponge City initiatives launched by the Chinese government in response to increased surface water flooding in rapidly urbanizing areas [2]. However, in the UK, no studies have followed from policy and guidelines that were published in 2007 and 2015 for stormwater urban drainage systems [1]. Similarly, in Brazil, a Sustainable Urban Drainage Manual was published in 2004 [51] and further legislation passed in 2007 [45], but output in English-language journals only began in 2017.
Overall, we observed that the locations where bioretention field research occurred depended on policy, climate similar to that of established research clusters, and the presence of research institutions with prolific researchers in the field. All but three of the 19 countries in which bioretention cells were located in our study are members of the Organization of Economic Cooperation and Development (OECD), a group of mostly high-income countries [52], indicating a gap in applications of bioretention for less affluent countries. Although less well studied than in Global North countries, water scarcity and polluted water supplies caused by untreated stormwater are identified problems in South Africa [53,54] and in India [55], and in both regions a combination of urbanization and climate change are further threatening water supplies [56,57], all problems that bioretention can help to ameliorate. As mentioned in Section 2.2, this scoping review only included research published in English, so any articles published in regional journals in other languages are not captured in the reviewed literature. This may explain the lack of results from South and Central America, where there were only eight cell-times studied from Chile (1) [58], Colombia (1) [37] and Brazil (6) [59], and that there were no studied cells in Africa, Eastern Europe, the Middle East, Central Asia and South Asia.

3.2.2. Terminology and Definitions

Bioretention systems have been called many different names in the literature, including bioretention, biofilter, bioinfiltration, bioswale, and rain garden. Sixty percent of articles (214/320) used more than one term to define the system, though bioretention was often the first mentioned term. While these terms are used interchangeably in most cases, they can also refer to other water treatment technologies that incorporate filtration through natural media. “Bioretention” is the preferred term for the technology by most researchers globally, as 70% of the publications in this scoping review (224/320) used the term “bioretention” and only 30% of publications used terms such as bioswale, biofilter, bioinfiltration, and rain garden. In 32% of the articles (102/320), the authors defined the bioretention system themselves (i.e., no citation included). Davis, Hunt (two north-eastern American researchers) and the Prince George’s County are the next most cited sources for definitions, at 14% (46/320), 7% (22/320) and 4% (14/320), respectively, again highlighting the influence this region has had on the field of study. Though solutions to stormwater issues generally evolve locally [42], there is some international agreement for the use of the term “bioretention”, suggesting an international community is coalescing around this shared technology.
The choice and frequency of words used within the literature provided insight into how performance is defined and assessed by researchers. Bioretention performance was defined by authors in terms of hydrology (e.g., reducing runoff volume and peak flow) and reduction of pollutants (also often referred to as treatment of water quality). In definitions of performance, “runoff” was the most frequently used word (102 instances) and “pollutant” and “reduce/reducing” were the next most frequently used word with 77 and 70 instances, respectively. Other most frequently used words in the definition of performance include: water quality, peak flow, volume, infiltration, filtration and urban.

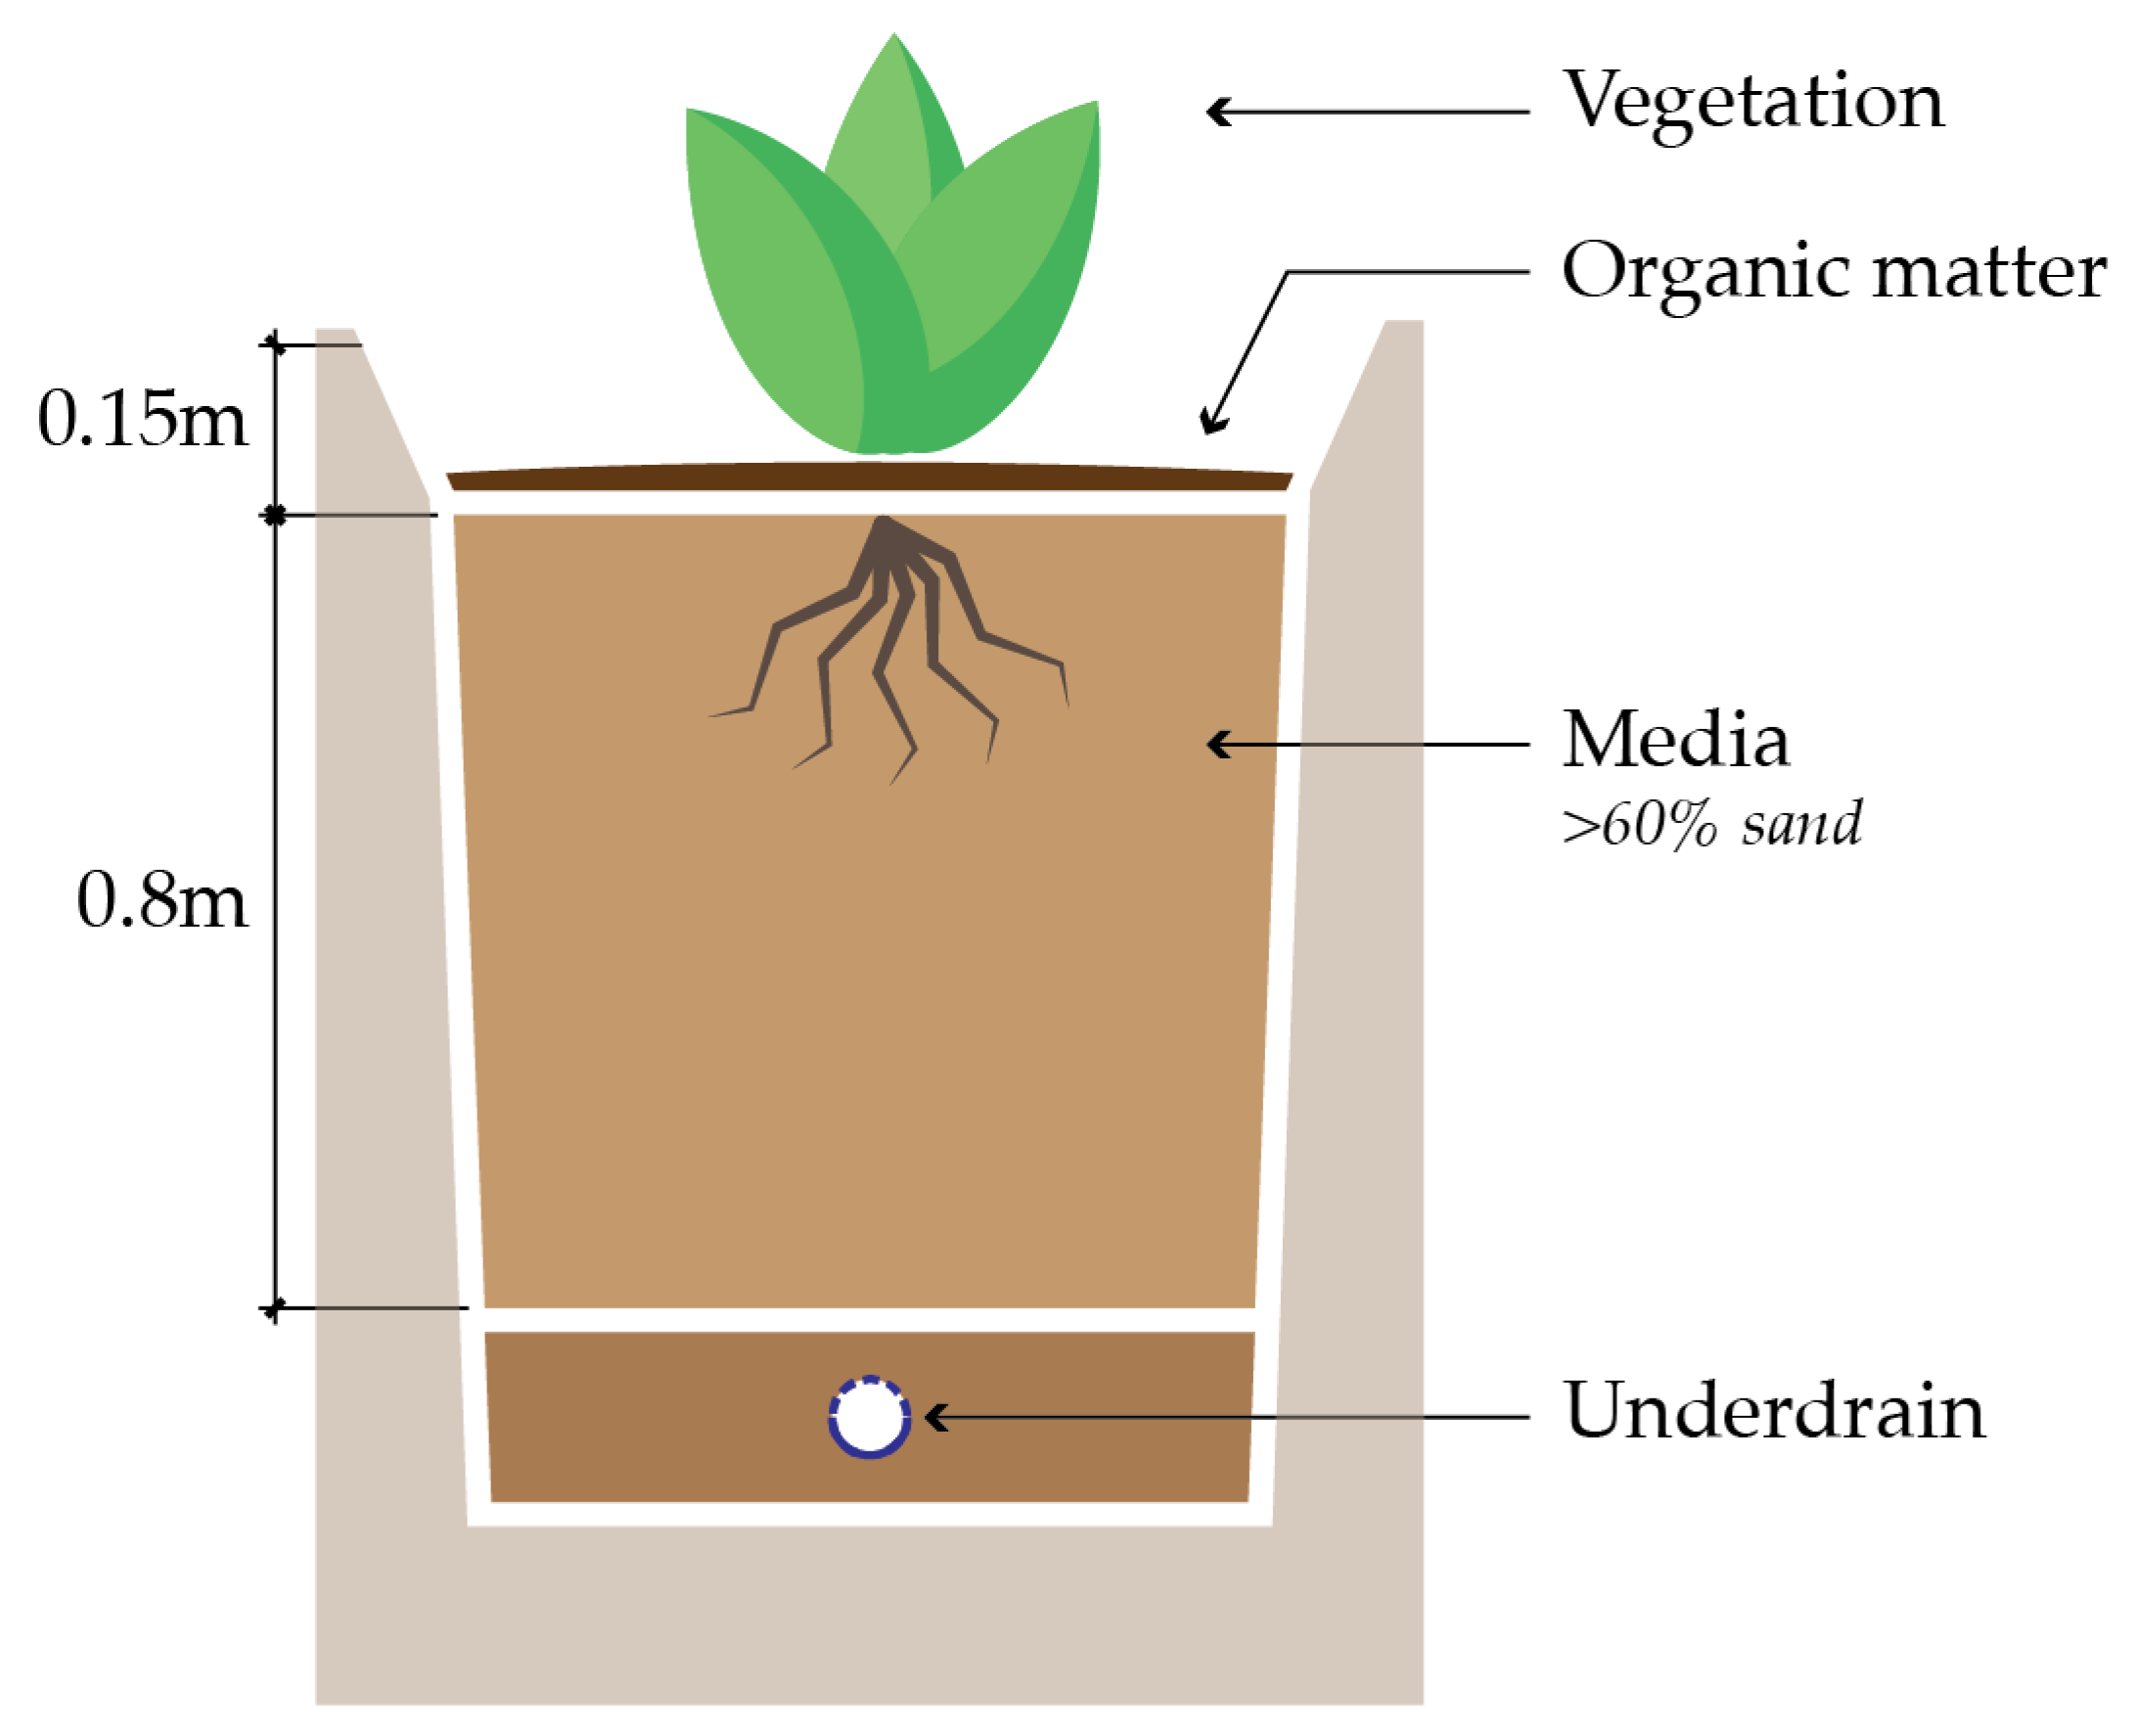
3.2.3. Physical Characteristics

A schematic of a typical bioretention cell composed of the most frequently reported components is shown in Figure 5. The most commonly identified aspects of a bioretention cell (i.e., vegetation, organic matter, media and underdrains) aligned well with system descriptions provided in early publications [60,61] and guidelines [21]. Bioretention components that directly affect the system’s hydrologic performance (e.g., media, underdrain) were often described in more detail than components that affect the system’s biological or ecological performance, such as plant species names, plant traits and selection of vegetation. Although bioretention cells are almost always described as vegetated, researchers tend to have a limited understanding of the impact of vegetation on performance.
The engineered soil media in the bioretention cell is the primary element that determines its hydrologic performance. Researchers typically followed local or commonly cited guidelines in selecting media. The high proportion of sand in the bioretention soil mix, as well as the inclusion of organic matter, was reflective of design guidelines [21,62] that recommend primarily sandy materials and low clay content for bioretention media. Fifty-four bioretention cells studied in 29 field studies incorporated a novel amendment in their soil mix, which is commonly used to enhance the hydraulic and/or chemical characteristics. For example, zeolite and granular activated carbon have been studied for metal sorption [63], alumina or ferric oxide based water treatment residuals for phosphorus sorption [64,65], and fly-ash for microbial and heavy metal sorption [66].
The presence of vegetation was frequently reported, but little detail was given on vegetation characteristics or the role vegetation plays in achieving hydrologic or ecological performance objectives. Overall, the vast majority of papers did not identify plants according to their scientific names or have any discussion of specific plant traits (see Table 2 for more details).
Bioretention research was often conducted on single systems, including ones purpose-built for research or demonstration. Fifty-five articles (out of 320 studied, 17%) published results from one bioretention cell, 37 articles (12%) using results from two bioretention cells, and 21 articles (7%) from three cells. Fifty-three articles (17%) did not provide a clear indication of how many cells were installed, while 81 studies (57%) with a modelling component either based their models on theoretical bioretention cells or compared their models to catchments without bioretention. Aside from one modelling study and one life-cycle assessment study (classified as Study Type: “Other”), all journal articles that assessed more than 20 cells were field surveys, which generally studied the long-term performance of existing cells. While the greatest number of cells studied within one article was 78 [67], the greatest number of cells studied in pilot-scale and full-scale field studies were 18 [68] and 12 [69,70], respectively.
The studied bioretention cells were predominantly small systems, receiving runoff from a small drainage area, and not often connected to other bioretention cells or other stormwater management technologies. Most bioretention cells (299/329 reported) were not part of a treatment train where two or more stormwater management practices were placed in series with each other. The system size was defined as the ground footprint of the bioretention cell at the bottom of the ponding area. The system size distribution was left-skewed (see Figure 6a), with cells less than 5 m² accounting for 25% of all cells that reported a system size (103/413). Similarly, the catchment areas supplying stormwater to these systems were also left-skewed, with 65% of reported catchment areas (214/253) being less than 0.25 hectares, and areas > 500 m² being the most commonly represented size, as shown in Figure 6b. Based on the reported system sizes and catchment areas, the ratio of drainage area to system size was calculated, with the histogram of the ratios shown in Figure 6c.
Although our study’s exclusion criteria may have partially contributed to the low number of bioretention systems incorporated in treatment trains (See Table 1 and criteria “independently assesses bioretention”), the lack of data on bioretention as part of a stormwater treatment train appears to be a significant gap in the literature, as we were careful to include all results where the performance of the bioretention cell could be independently assessed. More information and study is needed to improve our understanding of how to effectively combine bioretention systems with additional stormwater management technologies to achieve the full spectrum of hydrologic targets.

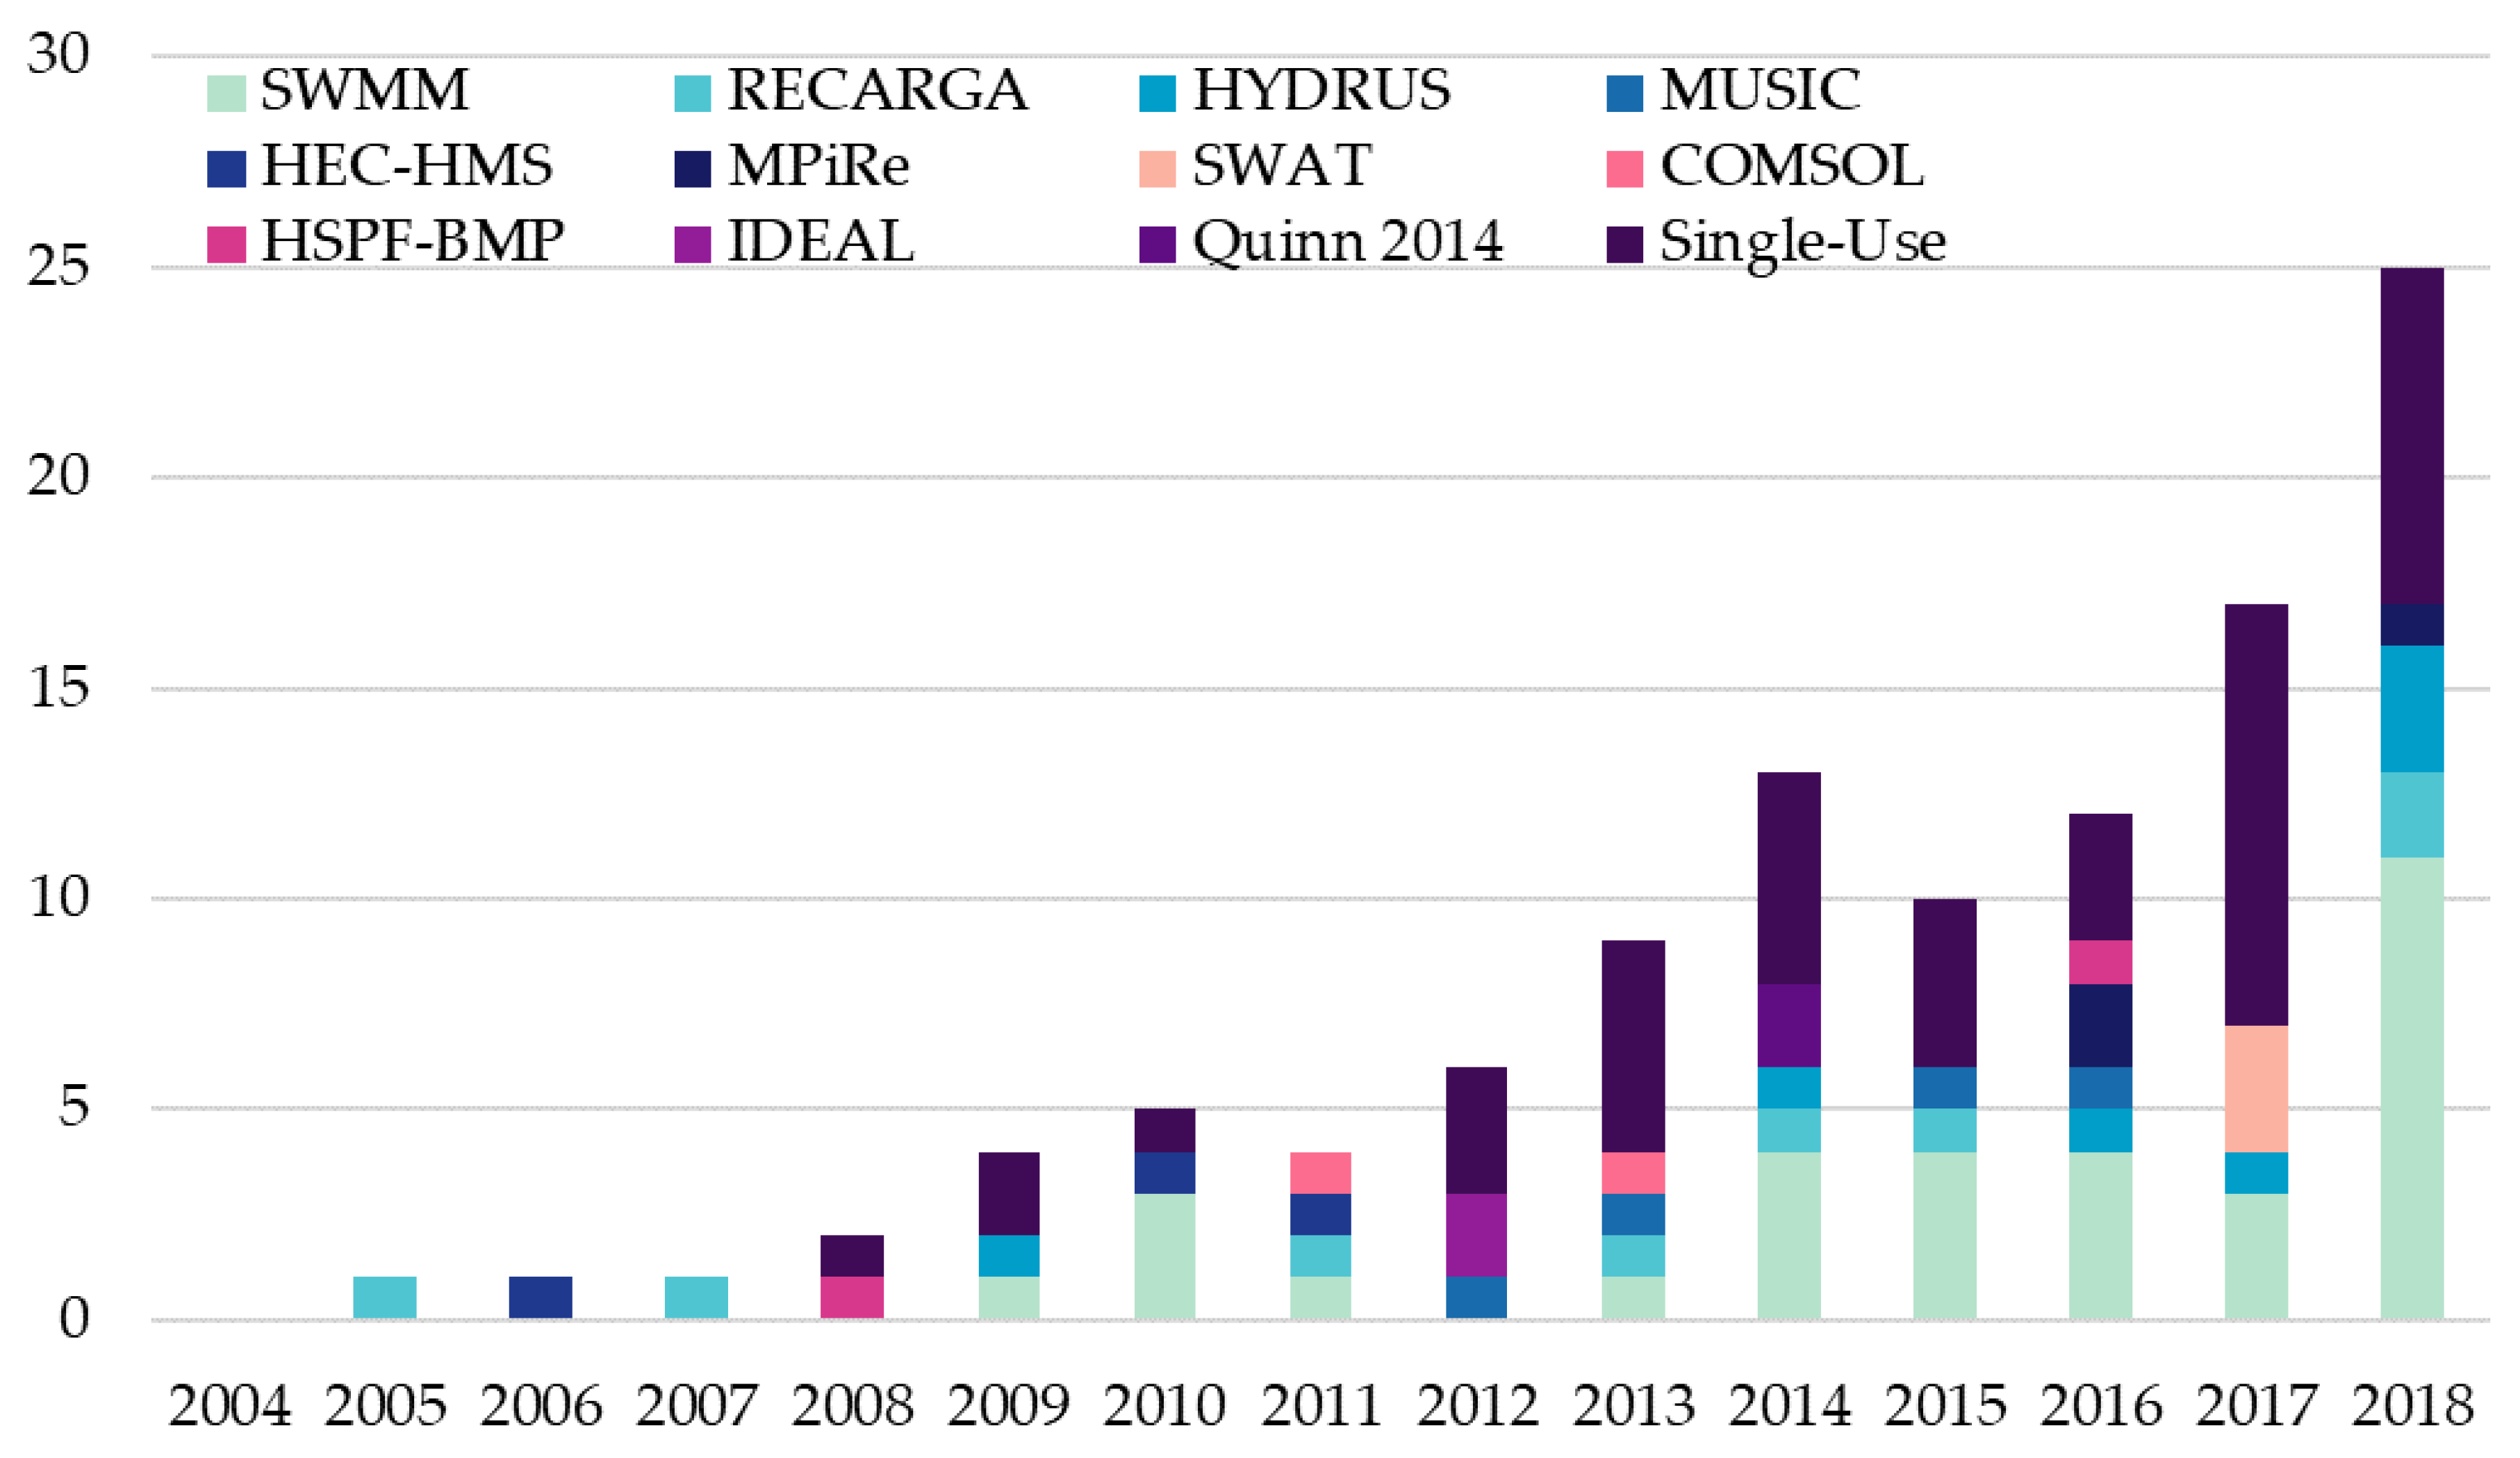
3.2.4. Bioretention Modelling

Models are an essential tool to overcome the site-specific limitations of field-based research and to allow researchers to investigate a broader spectrum of questions than can be answered through measurement alone. Models are used to transfer results from the lab to the field scale and to allow researchers to understand often-complex internal dynamic processes involved in the movement of water, fate, transport and retention of contaminants within a bioretention cell. Overall, 41% (130/320) of studies had a model component, of which 24% (31/130) contained both model and field results. Considering different versions of a given model (e.g., grouping a two- and a one-dimensional version of the same model) 14 models were used more than once and 53 models were used a single time in a total of 141 model instances (defined as independent model parameterizations) (Figure 7). The number of model instances has increased rapidly from a single publication with a model component in 2004 [71] to 24 model instances in 2019.
As with field-based research, modelling efforts have emphasized the hydrologic and hydraulic functions of bioretention over contaminant transport and fate. Only 25% (35/141) of modelling articles addressed contaminant transport and fate, while 75% (106/141) of modelling articles addressed bioretention hydrology or hydraulics. The US EPA’s Storm Water Management Model (SWMM) was the most commonly used model, at 31% (44/141 model instances), followed by RECARGA at 7% (10/141) and HYDRUS-1D or 2D at 5% (7/141). Seven models were used three or more times in this study’s dataset (Table 3).
Models were used to study a variety of different hydraulic and contaminant transport problems, and had varying levels of complexity from empirical equations describing bioretention as a “black-box” to fully mechanistic models describing bioretention contaminant transport and fate, or hydrology [72], using time- and space-dependent partial differential equations [35]. Mechanistic models were used in most studies that looked at specific processes in bioretention, representing 88% (104/118) and 61% (20/33) of mechanistically-explicit hydrologic and contaminant transport and fate studies, respectively. The processes captured during data extraction can be divided into those dealing primarily with hydrology and those pertaining to contaminant transport and fate, and are shown graphically in Figure 8.
Table 3. Most commonly used models (≥3 model instances), their purpose, distribution, example references (including the first-used instance and examples of any specific uses), model applicability and model processes observed in our study.
Model NameModel Type (# of Model Instances)DistributionExample ReferencesModel ApplicabilityObserved Modeled Processes
Storm Water Management Model (SWMM)Hydrology (29) and Contaminant Transport and Fate (2, modified versions)Freely available and open-source [73][74,75,76]Model used in the evaluation of stormwater runoff systems. LID module can be used to represent a variety of technologies for reducing runoff, including bioretention.Hydrology: drainage, infiltration, evapotranspiration, overflow, exfiltration, interception, submerged zone flow.
Contaminant Transport: filtration, sedimentation, diffusion, degradation.
RECARGAHydrology (8)Freely available [77][78,79,80]Model for evaluating the hydrologic performance of bioretention facilities, rain gardens and infiltration basins. Allows for up to 3 soil layersHydrology: drainage, infiltration, evapotranspiration, overflow, exfiltration.
HYDRUSHydrology (5) and Contaminant Transport and Fate (1)HYDRUS-1D is freely available [81], HYDRUS 2D/3D is paid software [82][58,83,84]Models’ flow in variably-saturated porous media. Both 1D and 2D versions are available, allowing for complex modelling of subsurface processes. Can mechanistically simulate water and solute flow, with several customizable options for varying levels of complexity.Hydrology: drainage, evapotranspiration, infiltration, overflow, sorption, groundwater mounding, soil moisture content, preferential flow, submerged zone flow.
Contaminant Transport: 1D advection dispersion reaction equation, sorption, first-order overall “sink” term (accounting for degradation, etc.)
Model for Urban Stormwater Improvement Conceptualisation (MUSIC)Hydrology and Contaminant Transport and Fate (4)MUSIC is a commercial software [85], a free 21 day trial is available.[86,87,88]A unified model for a range of LID devices to estimate compliance with relevant local stormwater discharge regulations. Stochastic modelling of pollutant removal.Hydrology: drainage, infiltration, overflow, scour velocity.
Contaminant Transport: bulk removal, empirical estimation.
Hydrologic Modelling System (HEC-HMS)Hydrology (3)Freely available [89][90,91,92]Event or continuous modelling of dendritic watershed systems. Can be used for LID systems by simulating soil moisture across multiple soil layers. Overflow, infiltration, evapotranspiration, exfiltration, drainage, groundwater mounding.
MicroPollutants In RaingardEns (MPiRe)Hydrology and Contaminant Transport and Fate (3)Not publicly available, originally published by Randelovic, Zhang, Jacimovic, McCarthy and Deletic [72][72,93,94] A continuous, mechanistic model allowing for the simulation of contaminant transport and fate in a bioretention cell. Has been used for trace organic compounds and faecal matter.Hydrology: overflow, infiltration, exfiltration, drainage, evapotranspiration.
Contaminant Transport: first-order degradation, kinetic and equilibrium sorption, volatilization.
Soil and Water Assessment Tool (SWAT)Hydrology (3)Freely available [95][96,97]A multi-scale hydrological model allowing for the simulation of catchments and LID technologies in heterogeneous watersheds. Hydrology: infiltration, evapotranspiration, drainage, overflow.
The 141 model instances explicitly investigated 34 unique processes. The most commonly investigated processes were the fundamental hydrologic processes of a bioretention, including infiltration (87%, 122/141), overflow (72%, 102/141), and drainage through an underdrain (65%, 92/141). Evapotranspirative flows were considered by approximately half (49%, 69/141) of model instances, reinforcing the idea that plant dynamics are under-represented in bioretention field research.
General modelling best-practices would be to determine whether an existing tool could be used before developing a new tool. However, single-use models were common, representing 38% (53/141) of model instances. Single-use models were often used to investigate more specialized processes (e.g., filter cake formation [98], metal complexation [99]) that were not found in any of the more commonly applied models. To aid researchers in identifying applicable modelling tools for different applications, Table 3 shows the focuses and processes included in the most common modelling tools found in this study, and Supplementary Information File S4 Table S3 has a complete list of all models evaluated and the processes they included.
In some cases, it was difficult to tell which processes were considered, due to inconsistencies in reporting information regarding model parameter selection, calibration and evaluation. More rigorous attention is needed when describing and reporting model development and evaluation to ensure the transparency and reproducibility of modelled results. Moreover, publicly available models should be used over developing custom-built models, if the current tools adequately describe the processes of interest, and open-source models should be preferred to those with proprietary software, as open-source models provide full transparency by allowing users to access and edit the code. The US EPA SWMM program is particularly noteworthy in this respect since it is widely used, user-friendly and completely open-source.

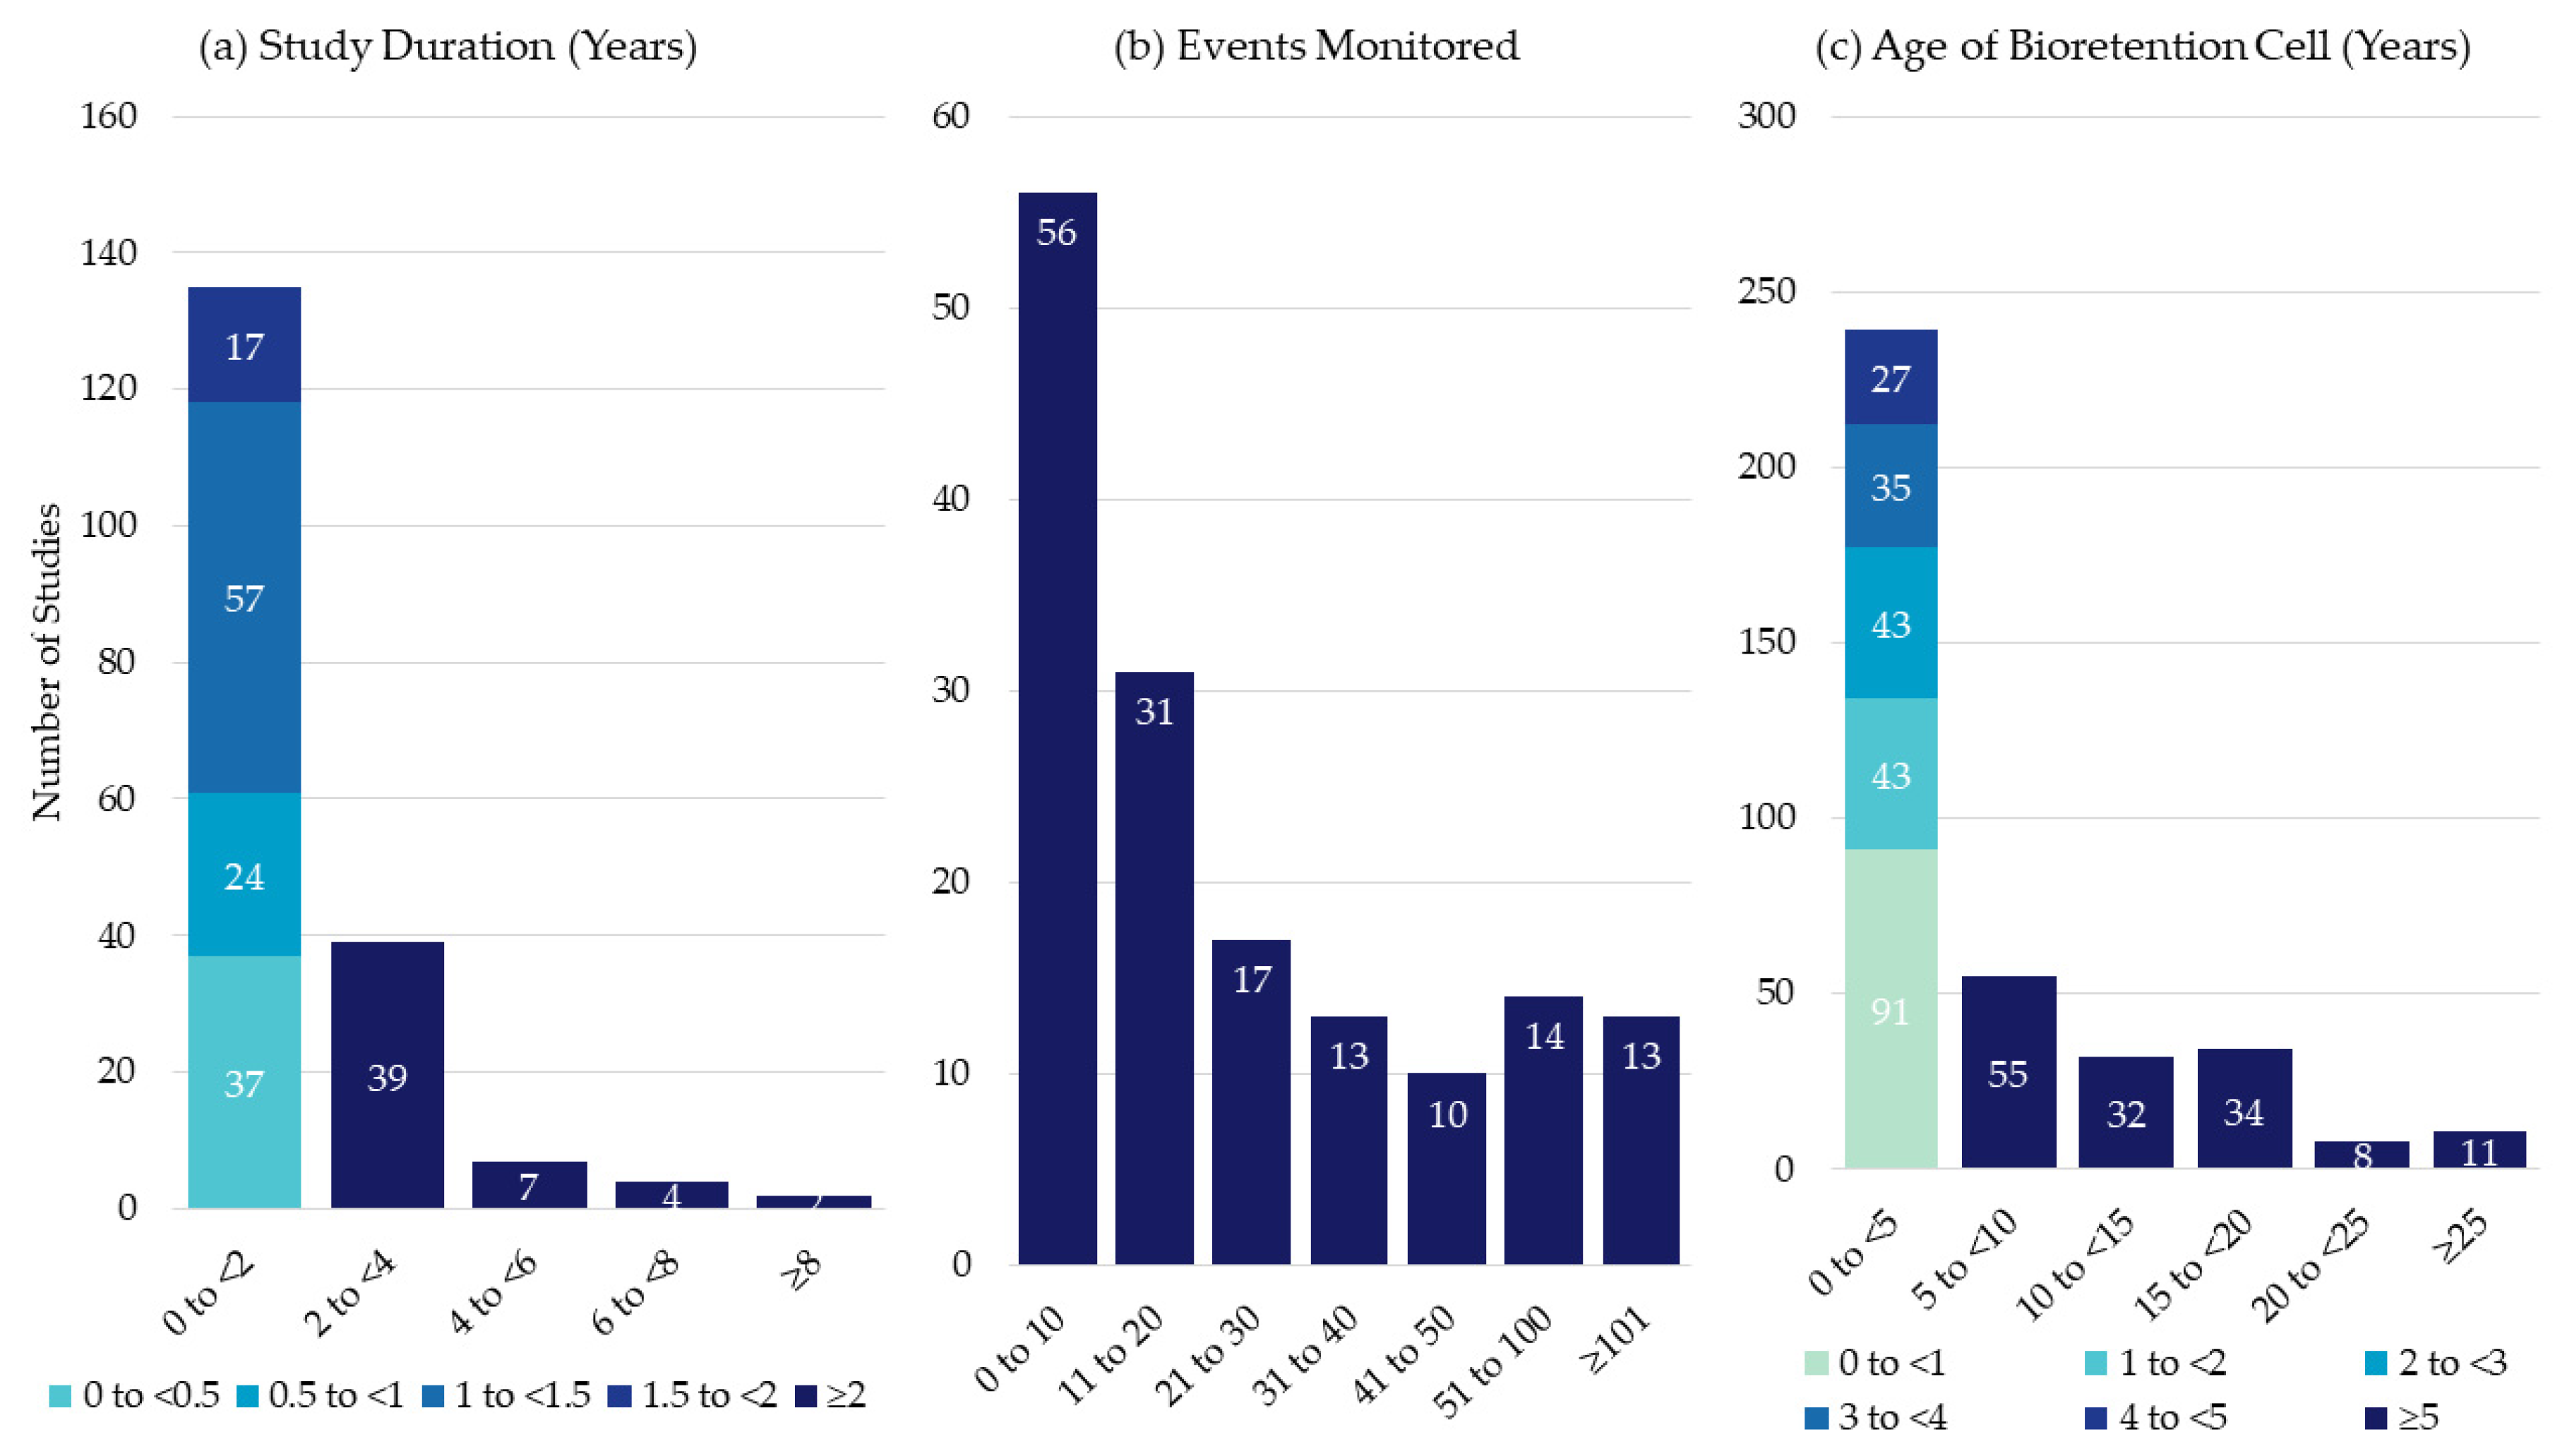
3.2.5. Temporal Characteristics

Long-term performance of established systems is inadequately examined in the existing bioretention literature. Most field bioretention systems studied less than 20 rain events on systems that were operational for less than two years. As shown in Figure 9a, 72% (135/187) of studies that reported a duration of 0–2 years with 6 months to 1 year being most common. The distribution of the number of events observed per publication is shown in Figure 9b. More than half of the studies (55% or 87/154) that reported the number of events monitored collected data from less than 20 rainfall events. Overall, only 8% of studies (13/154) included more than 100 events. The highest number of storms studied in a publication was 966 [100].
The operational life of bioretention cells has been estimated to be anywhere between 35 and 50 years [101,102], so there is a need for a more critical examination of the performance of mature (>10 years) systems. Of the 320 articles included in this review, 17 studies examined bioretention cells at 10 or more years of maturity. The oldest bioretention was 34 years old and was assessed as part of a field survey studying the impacts of heavy metal concentration in topsoil [103]. Seventy-one percent (239/370) of the bioretention cells reported a system age of less than 5 years (see Figure 9c). Ninety-one sites were less than one year old, suggesting that they were purpose-built for the study or that the study took advantage of new construction to gather data. Older bioretention cells were often studied as part of field surveys, where data was collected over a short period of time (usually at a single point in time) across many bioretention cells.
Studying mature bioretention systems can be difficult for a range of reasons, for example, lack of access, as well as land-use and property ownership changes. Modelling tools are one way to overcome these obstacles. Models can be built based on detailed results taken from a few bioretention cells, and then evaluated through their application in other systems. Models can also use field data to contribute to long term or continuous simulations to determine long term performance changes.
The plurality of modelled studies relied upon event-based analysis (38%, 54/141) or modelled over the seasonal or annual scales (37%, 53/141), with only 14% (20/141) investigating multi-annual processes. Wadzuk, Lewellyn, Lee and Traver [100] had the longest modelling study duration of 12 years, while the longest study in a field setting was 7 years long and performed by Guo, et al. [104] and Komlos and Traver [105]. Komlos and Traver’s study was also notable in that it studied a cell for 7 years, providing a rare combination of studying a relatively mature system (greater than 2 years maturity at start of study) cell for a long time (7 years) [105]. Many modelling tools enabled practitioners to explore system processes at different spatial scales, which could be difficult to evaluate using field monitoring programs alone. Most modelling work focused solely on the bioretention system (53%, 75/141) or catchment (23%, 32/141) scale; 20% (28/141) of model instances explicitly modelled both the bioretention system and the catchment together, and 4.2% (6/141) modelled aquifer or subsurface hydrologic response to a bioretention cell.

3.3. Processes and Results

Data extracted on the key findings of each article provided insight into the metrics used to assess the performance of bioretention cells. In this section, the data were classified into four categories: hydrologic processes and metrics, contaminant transport and fate processes and metrics, the methodology for results reporting, and other key findings. Hydrologic or water quantity processes (327 publications) were significantly better represented in published results than water quality or contaminant fate and transfer processes (185 publications). Collection of water quality data is more expensive and time-consuming than collection of hydrologic data, hence the dominance of hydrologic studies in the field. The hydrology of bioretention systems was a better understood phenomenon within the modelling research as compared to processes of contaminant transport and fate.

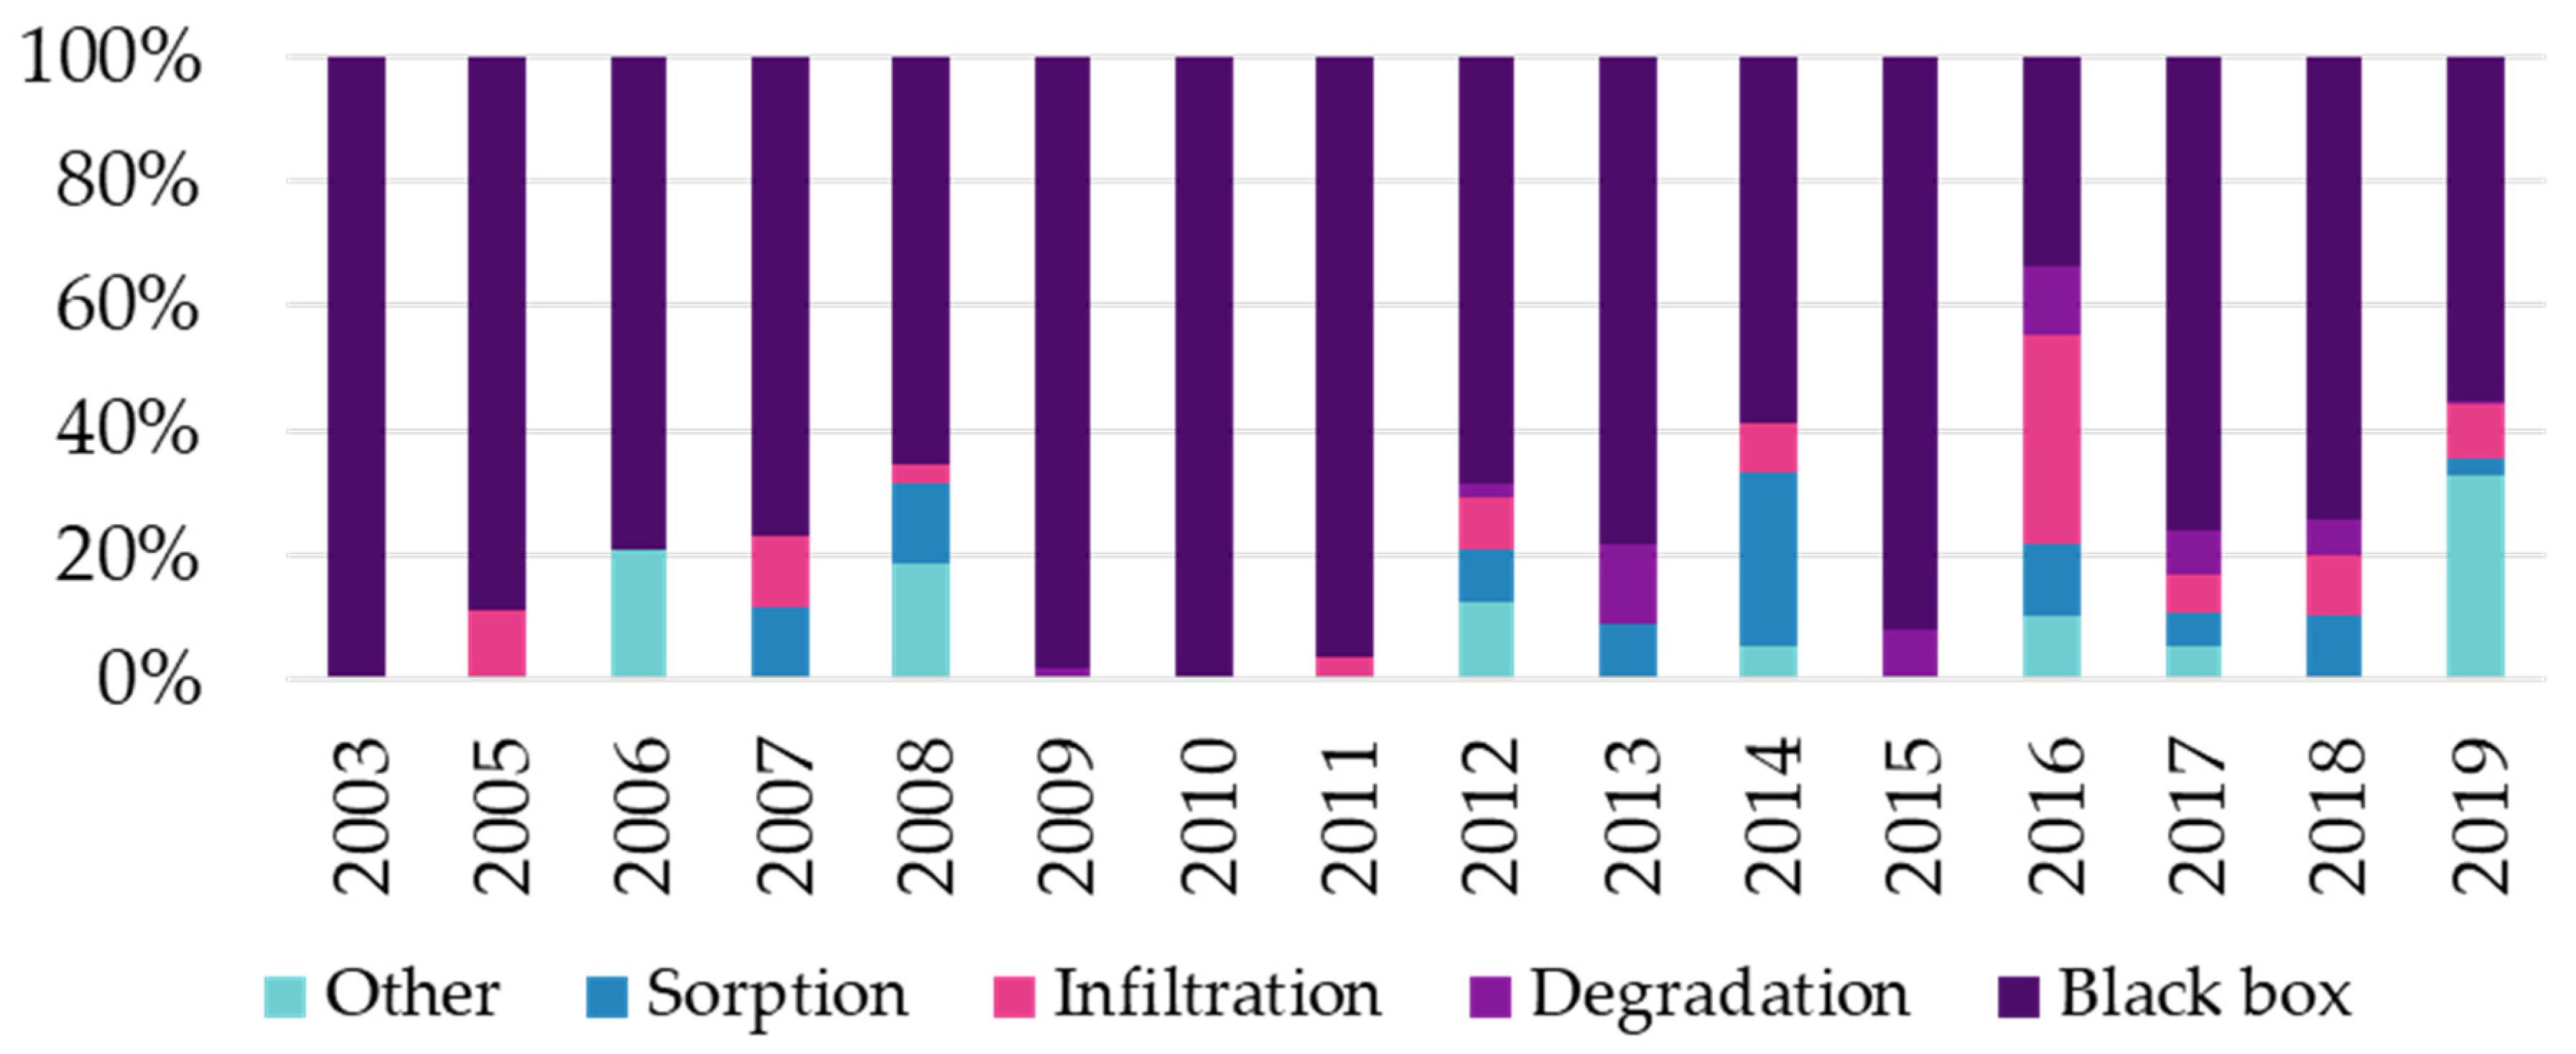
3.3.1. Hydrologic Processes and Metrics

Studied or modelled bioretention water balances typically included infiltration, drainage and overflow but often ignored or omitted evapotranspiration. Twenty-five percent of field studies reported on infiltration (89 out of 356 pathways reported), 10% on drainage (37/356) and 13% on overflow (46/356), representing the movement of water through the media, through the underdrain, and overtop of the ponding zone, respectively. Only 8% of field studies reported or estimated evapotranspiration rates from the studied bioretention system (27/356). Field researchers occasionally measured evapotranspiration via weighing lysimeter [106,107,108] but otherwise estimated evapotranspiration through water balances or evapotranspiration models [25,109,110,111].
Similarly to field research, hydrological modelling processes included infiltration (92%, 98/106), overflow (79%, 84/106), drainage (72%, 76/106), and evapotranspiration (58%, 61/106). Of the water quantity models that neglected to model infiltration, three [112,113,114] were fully empirical and so implicitly considered infiltration, one [115] considered only detention storage and overflow from bioretention systems and two were from a paper that only modelled evapotranspirative flows [116]. Models that did not consider overflow investigated the dynamics of water movement within the subsoil only (e.g., the model instances of R2D and Hydrus-2D from Aravena and Dussaillant [58]), while those that did not consider underdrain drainage simulated full exfiltration bioretention systems. Evapotranspiration is commonly neglected in event-scale models, with the implicit or explicit assumption that evapotranspiration losses are negligible during and after a single event.
Volume reduction and peak flow reduction were the most commonly used hydrologic metrics (see Table 4), but there was a lack of consistency in calculating this metric. Davis [117] defined volume discharge ratio (outflow divided by inflow) and suggested plotting that against exceedance probability to evaluate bioretention performance. While this approach has been employed by a few authors in the United States [109,118,119], most report volume reduction as a percentage change, or (inflow–outflow) divided by inflow (e.g., [104,120,121,122]), with no associated criteria for acceptable percent change. However, if researchers were to synthesize results from multiple papers in a systematic review to evaluate performance against criteria, it would require a transformation of data. A black-box approach, i.e., reporting flow and volume reductions between inlet and outlet only, was employed in 28% of field studies (62/221) and used exclusively (i.e., no other pathways reported) in 20% (44/221) of field studies.

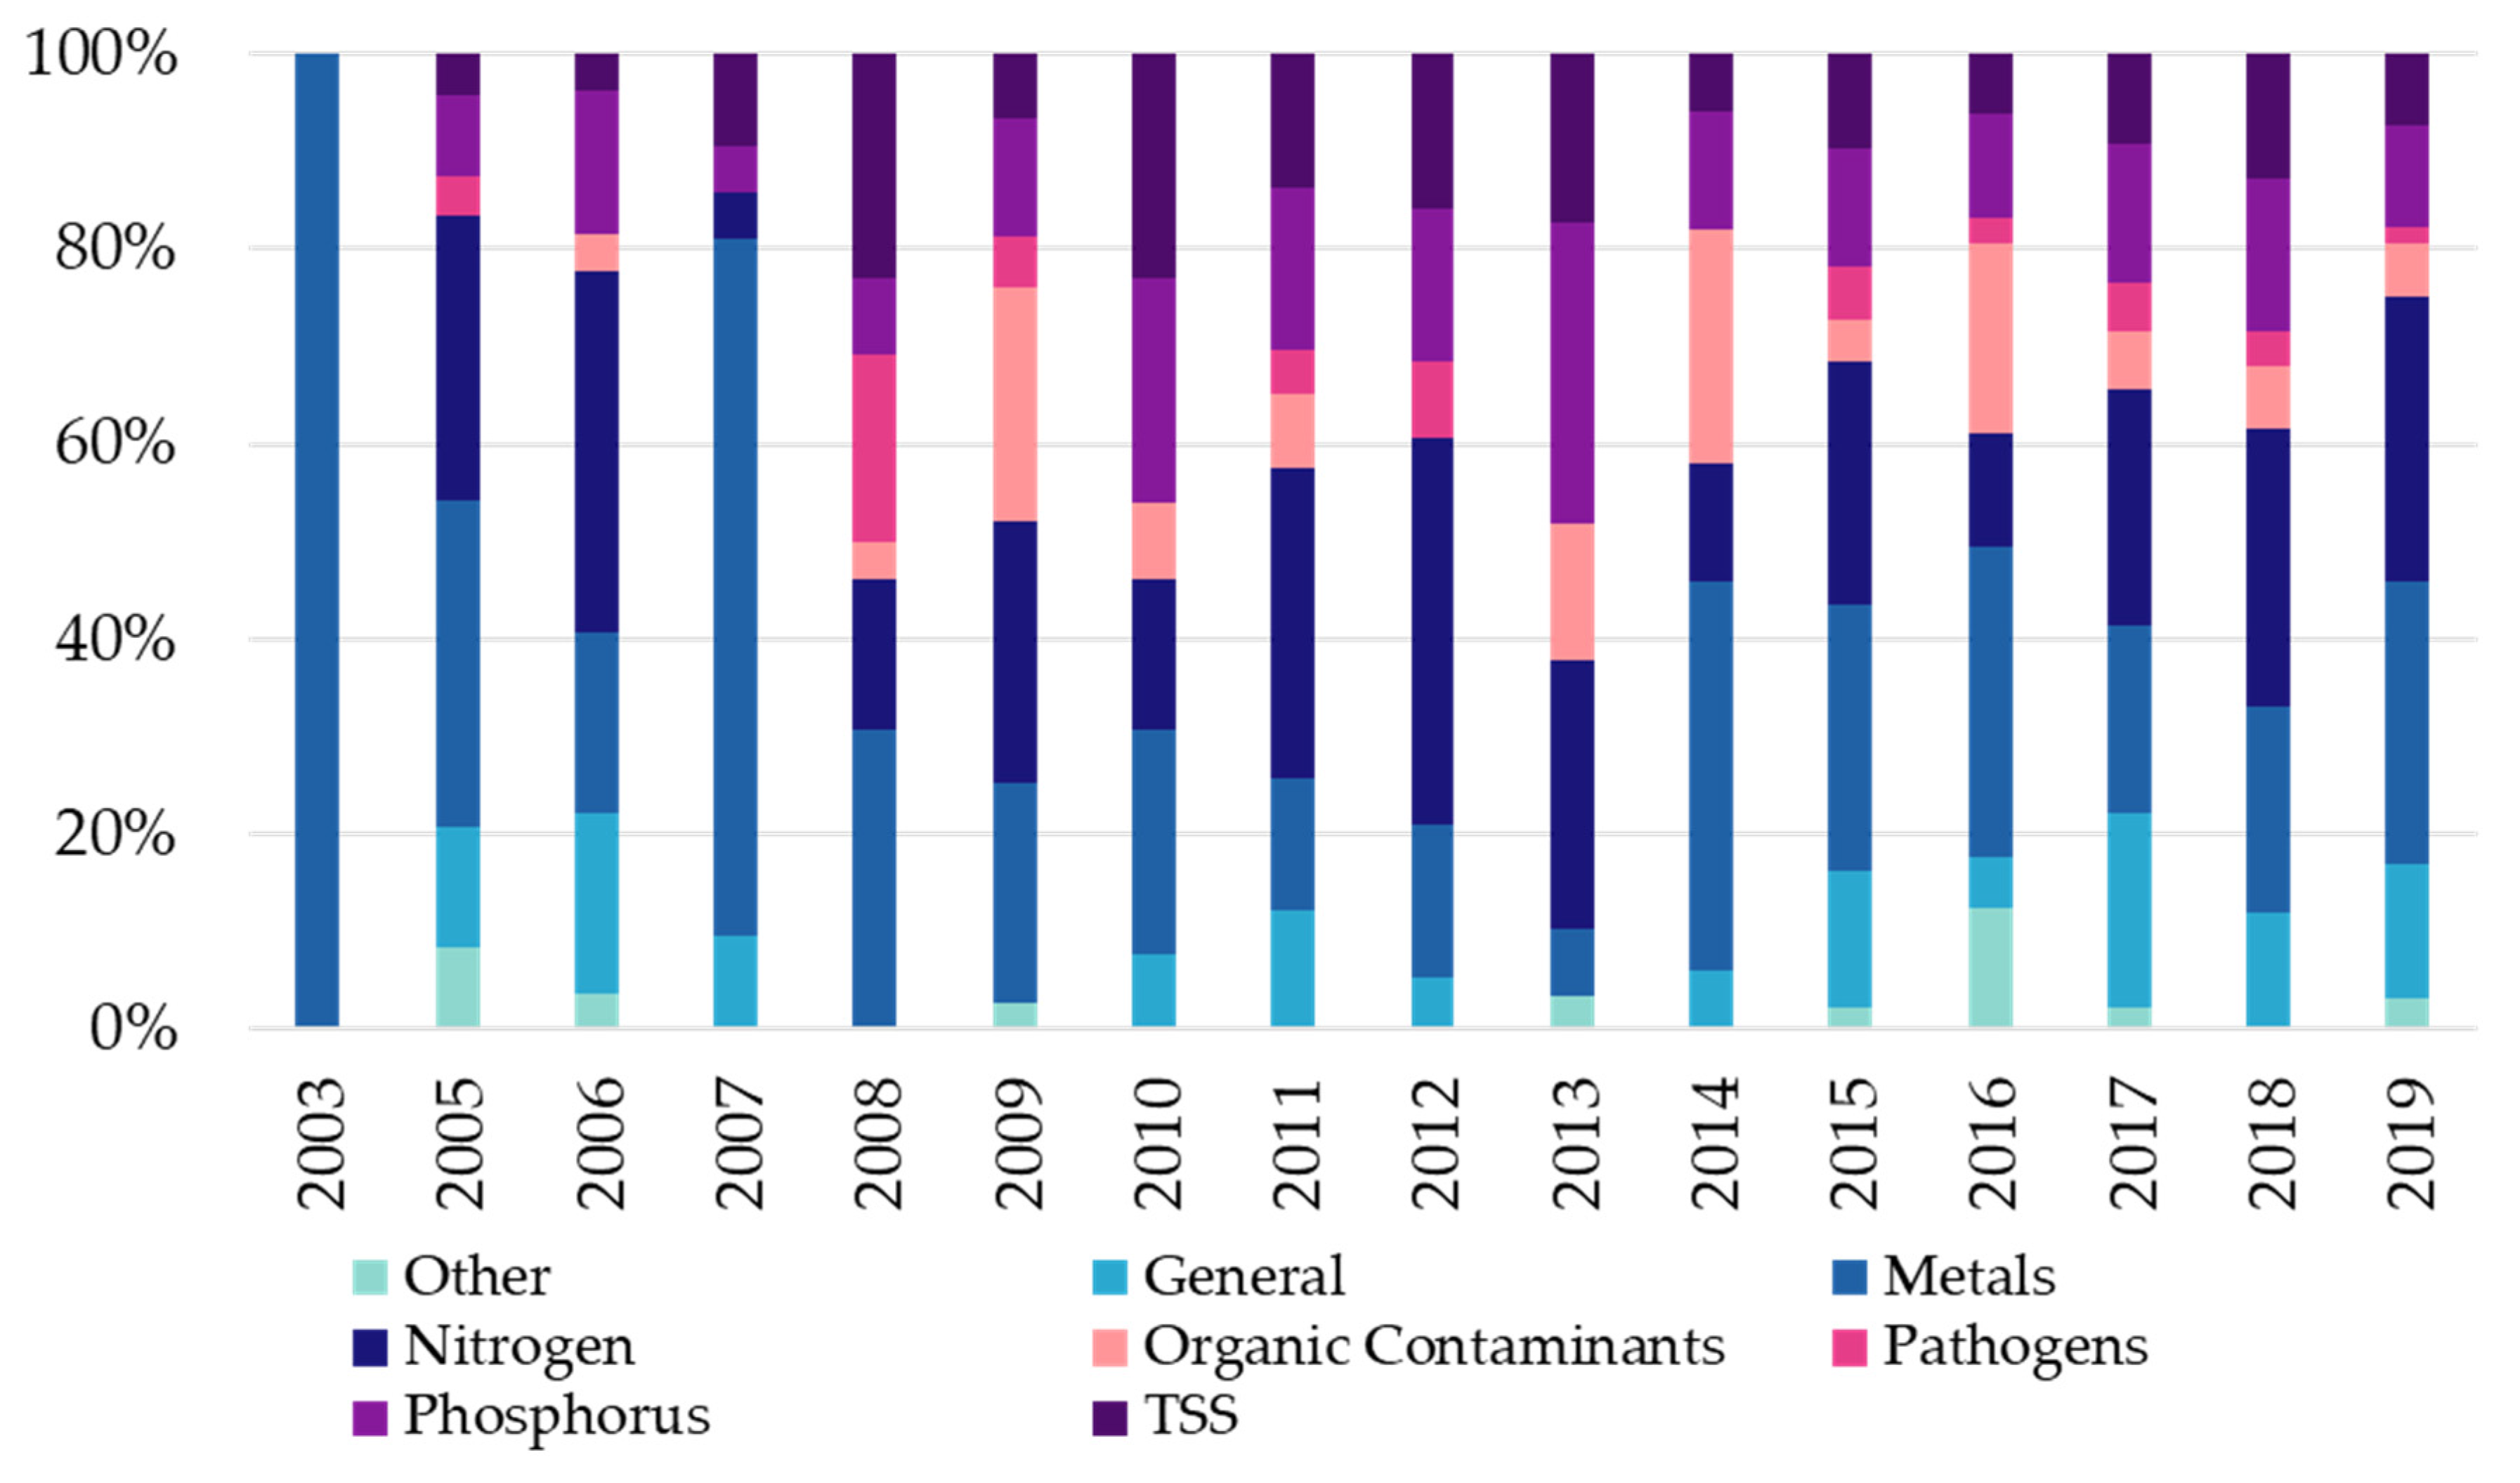
3.3.2. Contaminant Transport and Fate, Processes and Metrics

The most commonly used performance metric for contaminant transport and fate were effluent concentration and mass loading, followed by calculated metrics such as a reduction in concentration, reduction in mass, and comparisons with regulatory criteria or water quality standards (Table 5). Field research has moved from primarily looking at the bioretention system as a black-box (defined here as looking solely at the inlet and outlet contaminant concentration or mass) to distinguishing the pathways by which contaminants are reduced. More studies have recently separated pathways into degradation, sorption, and loss to infiltration, as shown in Figure 10. Advances in measurement technology may account for the increase in field studies that study removal pathways, such as with Chen, et al. [125], who studied the precise location of nitrification and denitrification via DNA extraction from soil samples.
The contaminants studied have remained relatively constant over time (Figure 11). In field studies, metals and nitrogen accounted for the largest share of results reported overall, at 25% (218/864) and 25% (215/864), respectively. Modelling studies focused most on nutrients (51%, 18/35), followed by suspended solids (34%, 12/35) and metals (29%, 10/35). Zinc, copper and lead were the three most commonly studied metals with 50, 46, and 33 results reported in studies with a field component (out of 218), respectively, whereas nitrate/nitrite, total nitrogen, and ammonia/ammonium were the three most commonly reported nitrogen species with 74, 52, and 39 (out of 218), respectively. Phosphorus, total suspended solids (TSS), water quality characteristics (noted as “General” in Figure 11, such as pH and conductivity) and organic contaminants comprised 10–13% of field results reported each. In modelling studies, organic contaminants represented ~5% (2/35) while the “General” characteristics were less frequently modeled. Pathogens comprised 4% (32/864) of field results and 5% (2/35) of model results reported, and all other types of results (e.g., temperature and ecological indicators) comprised 3% (27/864) of total field results reported. The focus on metals and nutrients reflects societal concerns with contaminants that are harmful to aquatic species (metals, solids), drinking water quality (nitrogen, pathogens), and surface water ecological status such as eutrophication (phosphorus).
The different target pollutants investigated also required modeling different processes. Most of the contaminant transport and fate models included processes that diverted water from the bioretention system’s effluent through infiltration (69%, 24/35) or overflow (51%, 18/35) while models investigating other compounds with more complex fates, such as organic contaminants, considered sorption (34%, 12/35) and degradation (26%, 9/35). Models investigating chemical transport and fate often failed to account for the role of vegetation. Only one model instance [126] investigated plant uptake, while many either ignored plants entirely or only looked at their impact on hydrology through evapotranspiration. This indicates a gap among researchers evaluating bioretention performance, where the focus has largely been on hydraulic and hydrologic functions as opposed to ecologic and environmental details.
Unlike the hydrologic modelling work, where researchers have favoured established programs like SWMM, RECARGA or HYDRUS, no single model dominated the contaminant transport and fate modelling efforts. Versions of SWMM that investigated water quality issues were used in 17% (6/35) of model instances, the Model for Urban Stormwater Improvement Conceptualisation (MUSIC) was used in 11% (4/35) of model instances while MicroPollutants In RaingardEns (MPiRe) (the flow module of which is based on the one used in MUSIC) was used in 9% (3/35) of model instances, leaving most water quality modelling done with either custom-built models used to investigate specific processes or models used only by a single author. Depending on the research questions being asked, contaminant transport and fate models can fall on a continuum between black-box or empirical representation of contaminant removal [127] to process-based models based on the mechanistic understanding of chemical behaviour in a bioretention cell. A promising mechanistically-based model is MPiRe, which was developed for modelling micropollutants such as pesticides [72] but has since been applied to the more traditional water quality metric of faecal microorganisms.

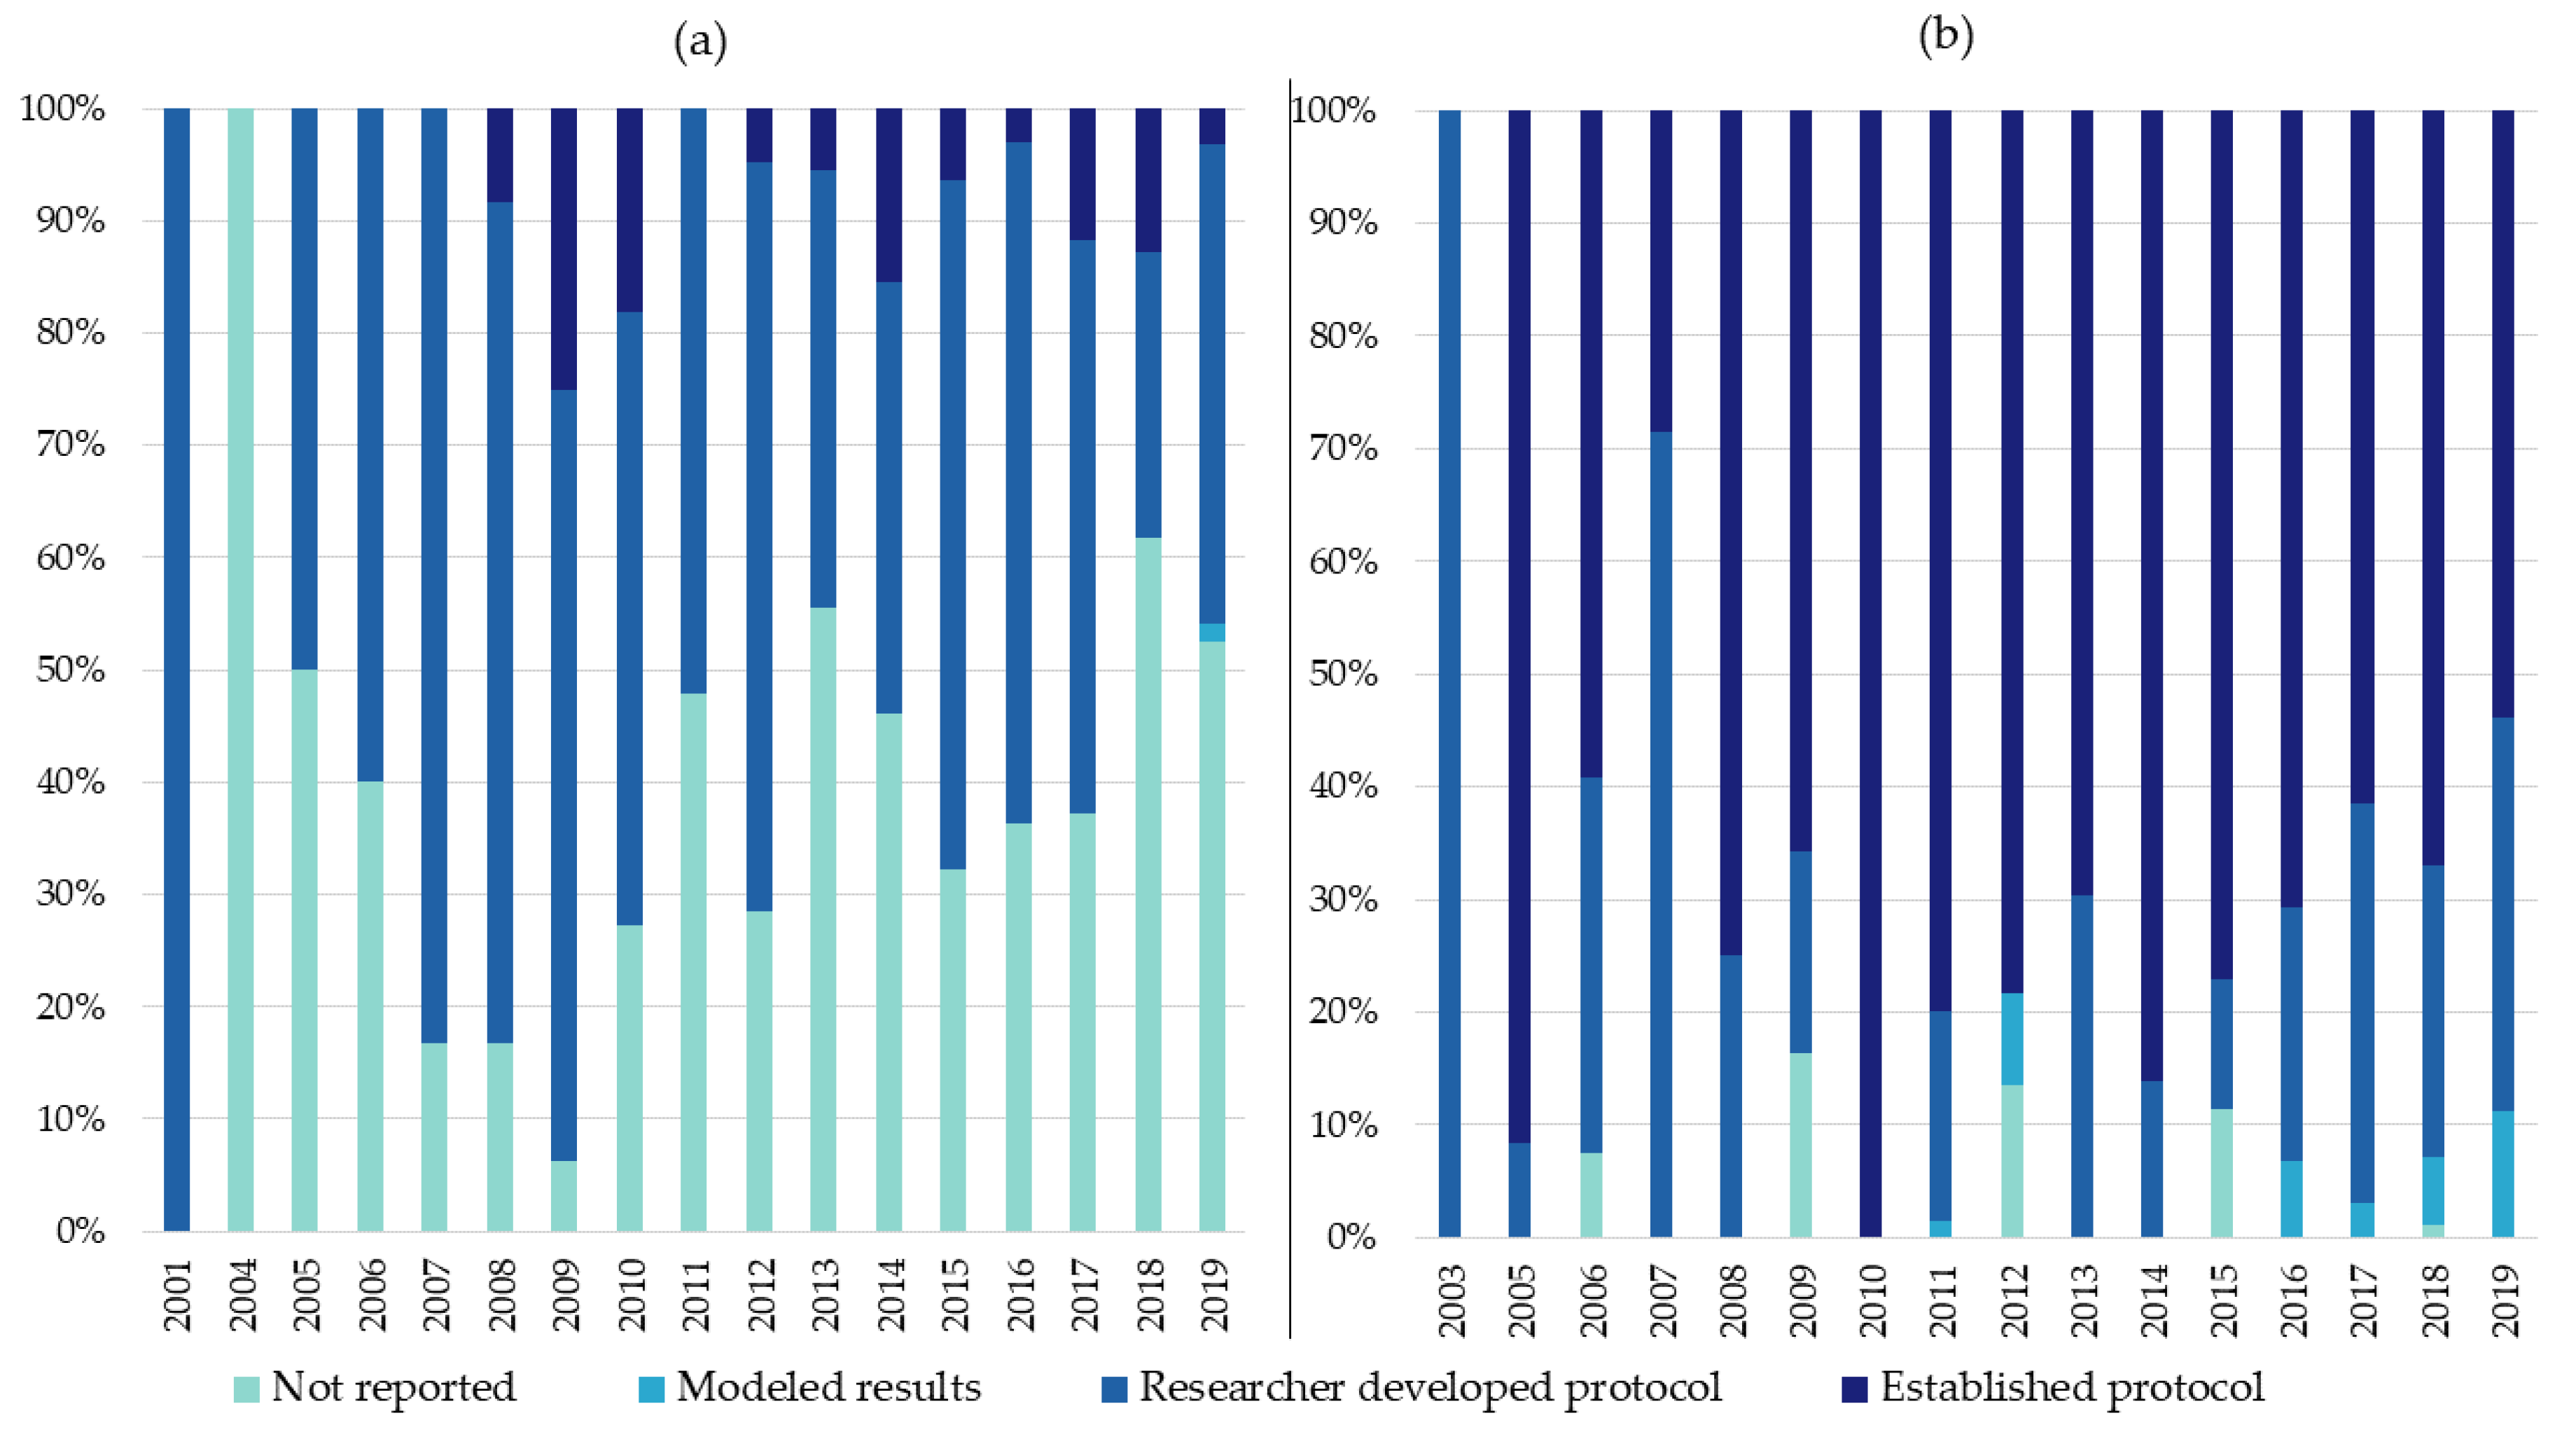
3.3.3. Reporting of Results

In both field and modelling bioretention studies, the collection, analysis and reporting of results does not follow any standardized or established practices. The lack of standardization presents difficulties for meta-analyses or systematic reviews, as results from each study must be transformed to allow for comparison. In field studies, guidelines for reporting results do exist (e.g., the International Stormwater Best Management Practice Database [128] and the US EPA 2009 publication of guidelines for urban stormwater BMP monitoring [129]), but they have not been taken up widely. Similarly, in modelling, protocols for evaluating models exist [130], but these recommendations were rarely incorporated.
In contaminant transport and fate studies (see Figure 12a), researchers often used established protocols for ensuring the reproducibility of laboratory techniques used for water sampling in field studies [27,131,132]. In hydrologic studies (see Figure 12b), researcher-developed protocols (such as the calculation of volume reduction) were used exclusively until 2008. In 2009 and after, a few studies began using established protocols [100,124,133,134,135,136,137,138,139,140,141], which appears to correspond to the publication of the US EPA guidance on standardized reporting [129]. Standardization in collecting and reporting results for stormwater management technologies has been increasing, but there is no dominant guideline or standard that researchers are following.
In modelling practice, standardization and quality assurance can be achieved via model evaluation vs. measured or observed results and sensitivity analysis [130]. The rigour used in evaluating models varied, however, and 45% (64/141) of studies did not include any quantitative evaluation of model accuracy or fit. More robust modelling exercises tended to use either the r² value or the Nash–Sutcliffe coefficient to compare measured and modeled results, which together, were used in 33% (47/141) of model instances. Similarly, most models did not explicitly consider their sensitivity to input parameters, with 80% (113/141) not mentioning sensitivity analysis in any way. Of the studies that included sensitivity analysis 6% (8/141) used global sensitivity analysis techniques, while 16% (22/141) used local or one-at-a-time techniques. More thorough sensitivity analysis methods provide confidence that the results of a model will be valid across a range of assumptions [142]. Thorough sensitivity analysis can also aid in improving models by suggesting areas where more accurate measurements would increase the precision of results [142]. Using established, previously evaluated models where the sensitivity is well understood, can reduce the need for full sensitivity analysis with every model instance, although the impact of the model sensitivity on particular model applications still needs to be considered. The uncertainty of model predictions was rarely provided, which means decision makers attempting to use these results will lack a critical understanding of the confidence with which the model predictions were made. Following best-practices in rigorously testing and evaluating the models used (e.g., Jakeman, et al. [143]) is a prerequisite for understanding how well these models can accurately represent bioretention performance.
Standardization of results reporting, monitoring and performance assessment are all common procedures in other disciplines, and stormwater managers and researchers can learn from outside of their discipline. A move to standardization has been seen in other environmental fields, such as in river restoration [144] and wetlands assessment [145], and should be reviewed as guides for the standardization of stormwater monitoring.

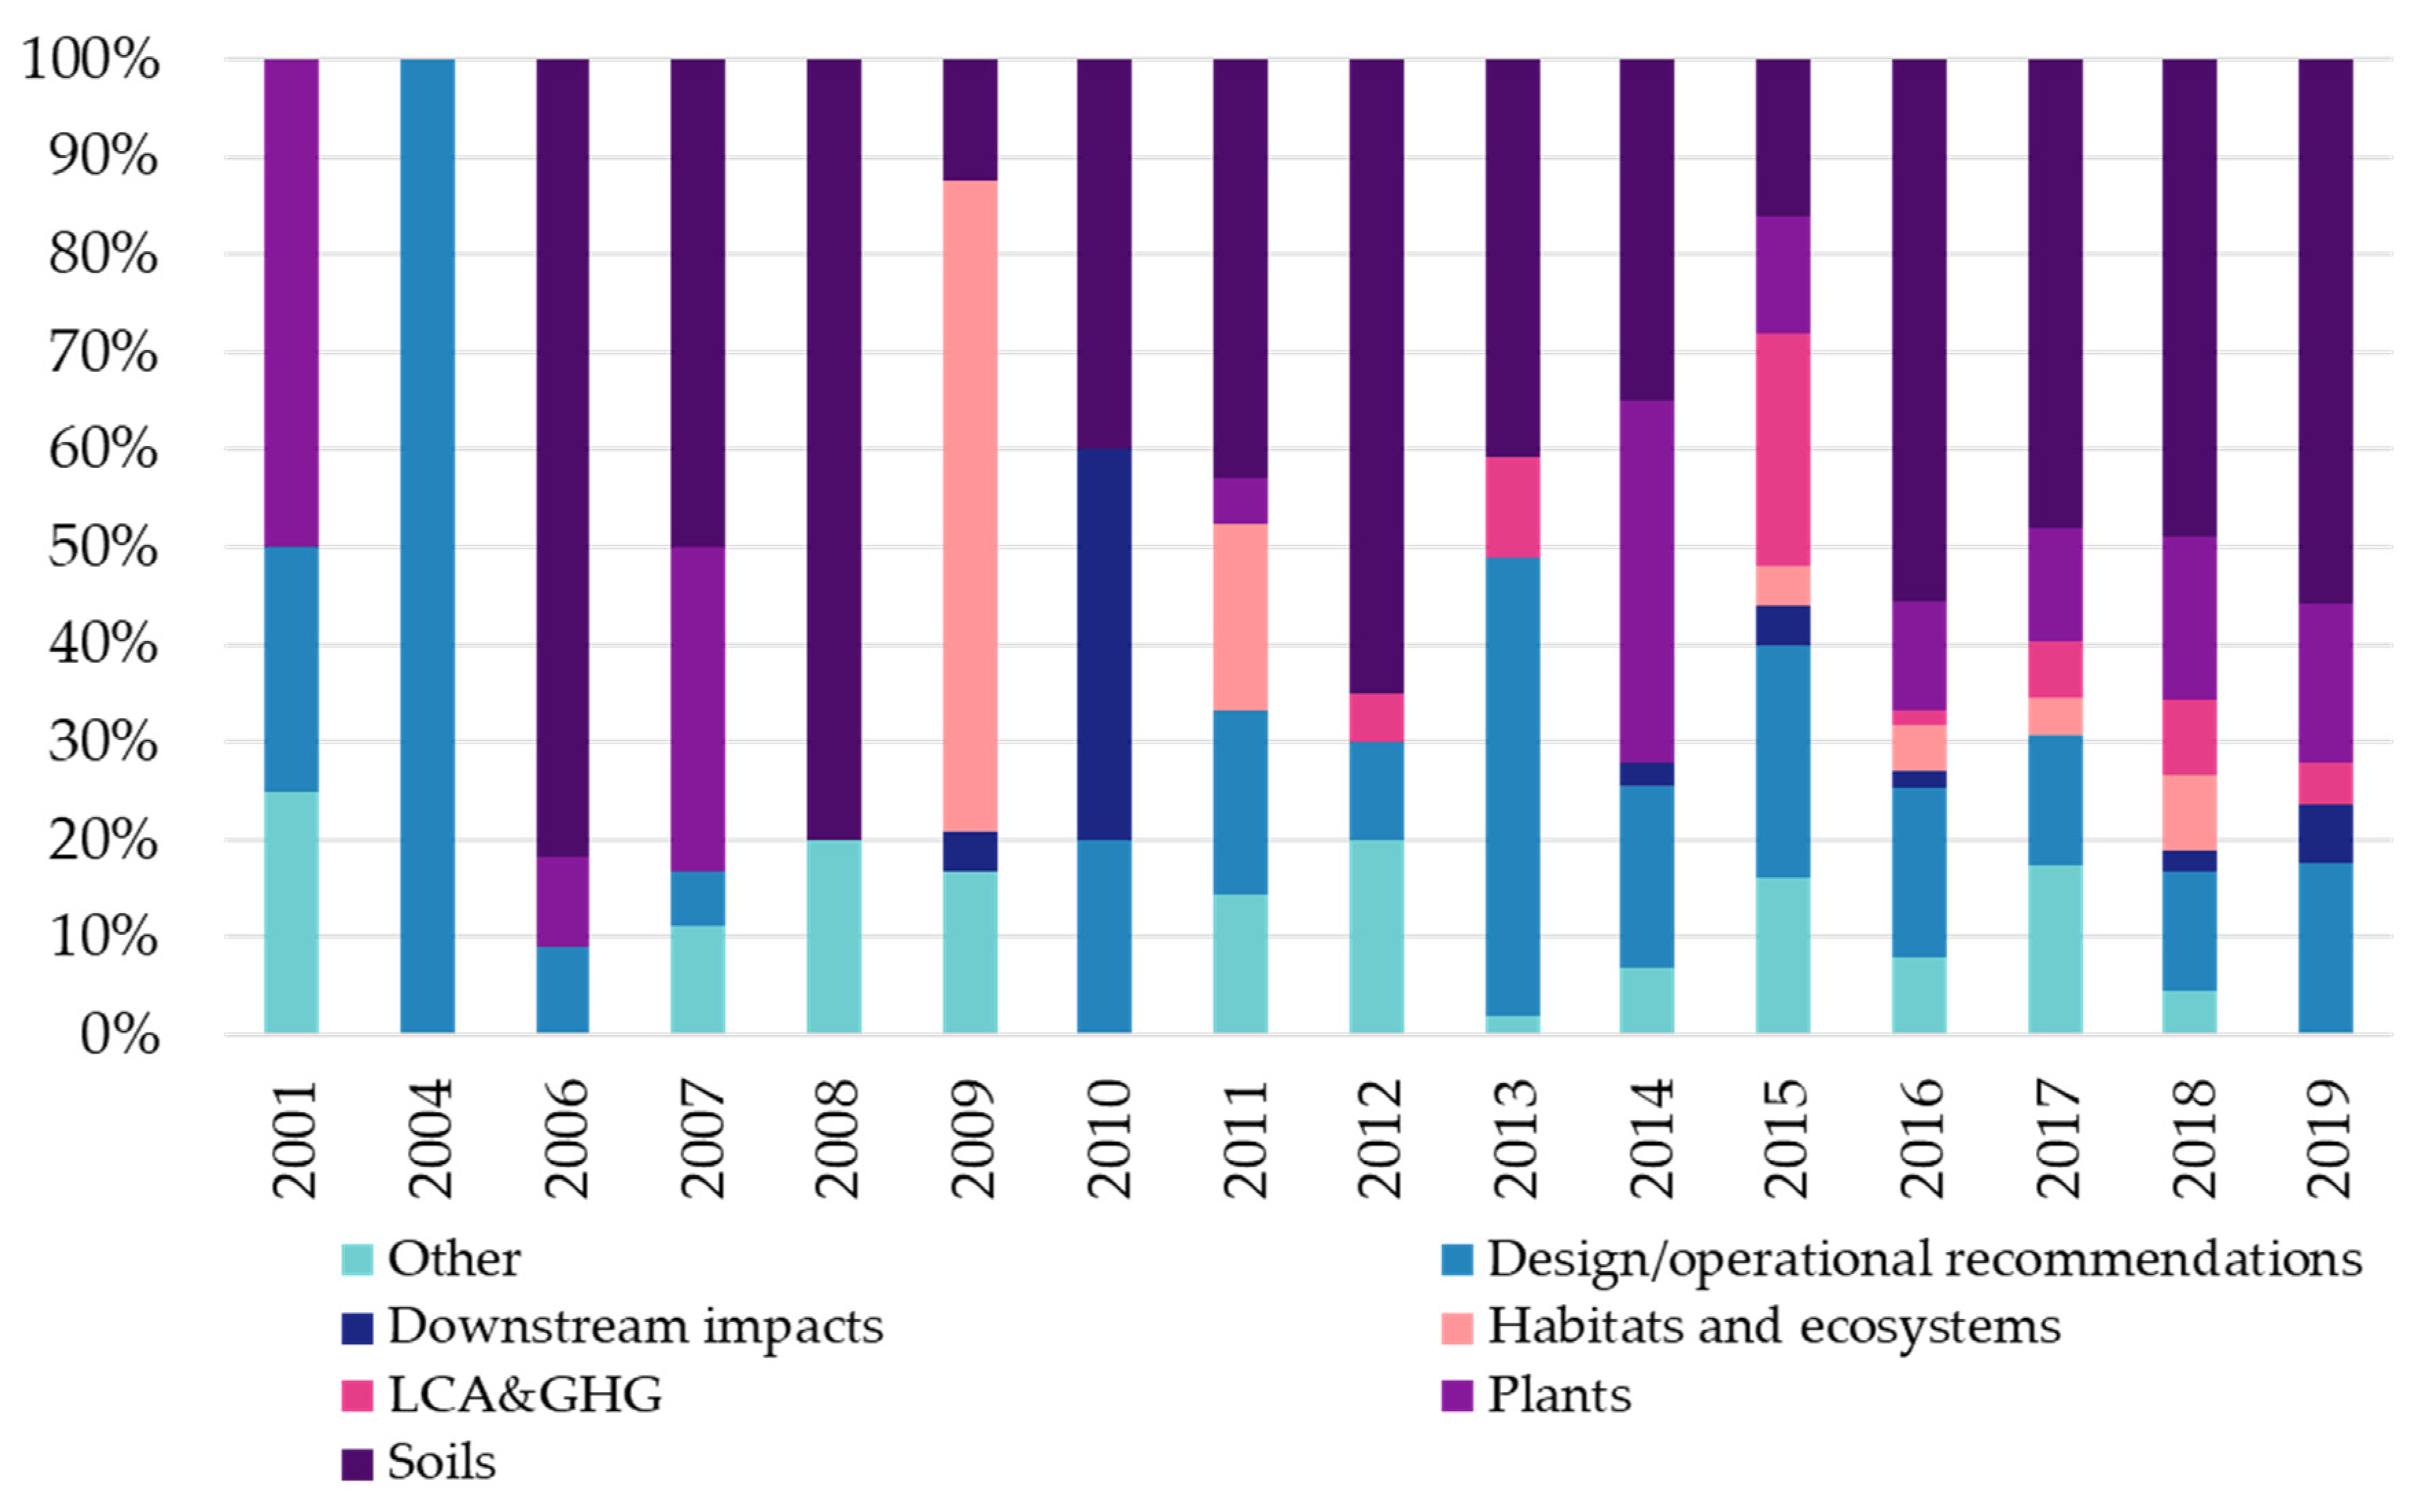
3.3.4. Other Types of Key Findings

Overall, the diversity of other findings beyond hydrology and contaminant transport and fate has increased since 2010. Hydrologic and contaminant processes are not the only performance measures and findings reported in the literature. The next most common category of results (234 out of 507 results) published by researchers was soil characteristics of the bioretention cell. These findings often include soil pH, moisture content, conductivity, and contamination levels. Other findings that are frequently reported include design and maintenance recommendations (92 results), findings related to the vegetation (68 results), and findings related to the habitats and ecosystems of either the bioretention cell or downstream areas (33 results). Figure 13 shows a breakdown of topics relating to bioretention systems that have been studied in the reviewed articles. Studies including design and operational recommendations increased the most in 2013 and continue to be a regular part of the study findings. Studies using life cycle assessment and other method to assess greenhouse gas emissions have increased since 2013 as well. Multidisciplinary research teams could improve the variety and types of studies, which could lead to a better understanding of bioretention co-benefits and drawbacks. Clearly, the least studied portion of a bioretention cell has been the vegetation, and broader collaboration could help to understand the role of vegetation in long-term maintenance, reduction of pollutants, or how to best design bioretention to function as landscape features.

4. Conclusions and Recommendations

This scoping review has provided an overview of the field of bioretention field and modeling studies, to determine gaps in the literature and to answer the overall research question: “How is the field performance of bioretention assessed in the literature?” Under that primary research question are two sub-questions: (1) how is the performance of bioretention defined in the literature? (2) what metrics are used to assess actual and theoretical performance?
Bioretention field performance is being assessed mainly by researchers in engineering disciplines located in temperate regions, especially the Eastern Seaboard of the United States and large urban areas of Australia. Bioretention research has emerged in places with strong policy and research cluster interest, and then spread gradually to locations with other climates. Research is primarily conducted in Global North countries, and the literature is missing perspectives from locations with water stresses in the Global South that could benefit from this technology.
Field research in bioretention was conducted through the investigation of systems in the field and through modeling studies that translate research into removal pathways from laboratory or bench-scale studies to the field scale. Although bioretention cells are expected to be operational for 35 to 50 years, research on bioretention cells is focused primarily on systems that were purpose-built for research and conducted over a short duration. Modeling studies suffer from similar limitations, with event-based simulations outnumbering continuous simulations throughout the literature.
The definitions of “performance” used by researchers consistently emphasized hydrology and reduction of pollutants in runoff; however, in practice more studies looked at hydrology than contaminant transport and fate. Many hydrology-focussed studies used “volume reduction” to assess performance, although the methods of deriving volume reduction were inconsistent and not always adequately described. Studies that focussed on contaminant transport and fate often reported overall “removal” by either concentration or mass; again, definitions were inconsistent and dependent on the context.
We have three main recommendations from this review:
  • Provide all original data on inlet/outlet flows or concentrations along with calculated values, such as volume reduction or removal. As many performance metrics can depend on the specific context of a bioretention cell or a study, reporting the underlying data is essential in allowing results to be generalized to other locations and applications. In addition to this, detailed information on the locations where bioretention is practiced (e.g., latitude/longitude) and the physical characteristics of studied bioretention cells, such as the year they were built, vegetation species and characteristics, and characteristics of the bioretention media and of the native soil are necessary to ensure that lessons learned in one location can be used to inform researchers in other parts of the world.
  • Prioritize investigating the processes that determine bioretention performance. As a profession, we need to better understand the underlying mechanisms (biological, physical and chemical) that lead to volume reduction and water treatment. Experiments that combine modeling and field monitoring results have been successfully used to investigate different aspects of performance, allowing the complex processes to be estimated. Additionally, research methods allowing for the investigation of specific processes, such as lysimetric data for investigating the role of plants in the bioretention water balance, are critical tools in understanding the ultimate efficacy of bioretention systems. More detailed research into the role of plants would be particularly warranted, as they are a key feature of bioretention design that has been somewhat neglected by the civil-engineering dominated bioretention community of practice.
  • Standardize the collection, analysis and reporting of results for stormwater management best practices, including bioretention systems. We recommend that researchers follow the reporting standards outlined in the US EPA 2009 publication of guidelines for urban stormwater BMP monitoring [129]), as they are the most current and up-to-date standards available. Researchers should continue to use the word “bioretention” to refer to these systems, and other terms should be phased-out or provided as secondary names. Harmonization of investigative methods will allow for the optimization of bioretention cell performance in a way that is currently difficult due to problems translating research from one system to another.

Supplementary Materials

The following are available online at https://www.mdpi.com/2073-4441/12/11/3122/s1. Table S1: Identifying relevant studies—databases used and number of results identified, prior to deduplication, Supplementary Information File S1—Searching methodology notes, Supplementary Information File S2—Included and lab articles spreadsheet, Supplementary Information File S3—Data extraction template spreadsheet, Supplementary Information File S4—Complete data extraction spreadsheet.

Funding

This research was supported by a Natural Sciences and Engineering Research Council of Canada (NSERC) Strategic Partnership grant to Elodie Passeport, Jennifer Drake and Miriam Diamond, as well as an NSERC Collaborative Research and Training Experience (CREATE) grant and Discovery Grant to Jennifer Drake and an Ontario Graduate Scholarship, Francis Bradfield Scholarship, Edward Jarvis Tyrell Fellowship and NSERC Canada Graduate Scholarship to Tim Rodgers.

Acknowledgments

We would like to thank Harrison Cole, a research assistant in Miriam Diamond’s research group in summer 2019, for his mapping of the bioretention cell locations. We would also like to thank Peter Last for creating the bioretention cell figures.

Conflicts of Interest

The authors declare no conflict of interest.

References

  1. CIRIA. The SUDS Manual; CIRIA Report No. C753: Dundee, Scotland, 2015. [Google Scholar]
  2. Chan, F.K.S.; Griffiths, J.A.; Higgitt, D.; Xu, S.; Zhu, F.; Tang, Y.-T.; Xu, Y.; Thorne, C.R. “Sponge city” in china—A breakthrough of planning and flood risk management in the urban context. Land Use Policy 2018, 76, 772–778. [Google Scholar] [CrossRef]
  3. Roy-Poirier, A.; Champagne, P.; Filion, Y. Review of bioretention system research and design: Past, present, and future. J. Environ. Eng-Asce 2010, 136, 878–889. [Google Scholar] [CrossRef]
  4. Davis, A.P.; Hunt, W.F.; Traver, R.G.; Clar, M.L. Bioretention technology: Overview of current practice and future needs. J. Environ. Eng-Asce 2009, 135, 109–117. [Google Scholar] [CrossRef]
  5. Kratky, H.; Li, Z.; Chen, Y.; Wang, C.; Li, X.; Yu, T. A critical literature review of bioretention research for stormwater management in cold climate and future research recommendations. Front. Environ. Sci. Eng. 2017, 11, 16. [Google Scholar] [CrossRef]
  6. LeFevre, G.H.; Paus, K.H.; Natarajan, P.; Gulliver, J.S.; Novak, P.J.; Hozalski, R.M. Review of dissolved pollutants in urban storm water and their removal and fate in bioretention cells. J. Environ. Eng-Asce 2015, 141, 04014050. [Google Scholar] [CrossRef]
  7. Liu, J.; Sample, D.; Bell, C.; Guan, Y. Review and research needs of bioretention used for the treatment of urban stormwater. Water J. 2014, 6, 1069–1099. [Google Scholar] [CrossRef] [Green Version]
  8. Yuan, Y.; Hunt, R. Systematic reviews: The good, the bad, and the ugly. Am. J. Gastroenterol. 2009, 104, 1086–1092. [Google Scholar] [CrossRef]
  9. Colquhoun, H.L.; Levac, D.; O’Brien, K.K.; Straus, S.; Tricco, A.C.; Perrier, L.; Kastner, M.; Moher, D. Scoping reviews: Time for clarity in definition, methods, and reporting. J. Clin. Epidemiol. 2014, 67, 1291–1294. [Google Scholar] [CrossRef] [PubMed]
  10. Peters, M.D.J.; Godfrey, C.M.; Khalil, H.; McInerney, P.; Parker, D.; Soares, C.B. Guidance for conducting systematic scoping reviews. Int. J. Evid. Based Healthc 2015, 13, 141–146. [Google Scholar] [CrossRef] [Green Version]
  11. Marvin, J.T.; Passeport, E.; Drake, J. State-of-the-art review of phosphorus sorption amendments in bioretention media: A systematic literature review. J. Sustain. Water Built Environ. 2020, 6, 03119001. [Google Scholar] [CrossRef]
  12. Arksey, H.; O’Malley, L. Scoping studies: Towards a methodological framework. Int. J. Soc. Res. Methodol. 2005, 8, 1364–5579. [Google Scholar] [CrossRef] [Green Version]
  13. Levac, D.; Colquhoun, H.; O’Brien, K.K. Scoping studies: Advancing the methodology. Implement. Sci. 2010, 5, 69. [Google Scholar] [CrossRef] [Green Version]
  14. Peters, M.; Godfrey, C.; McInerney, P.; Baldini Soares, C.; Khalil, H.; Parker, D. Chapter 11: Scoping reviews. In Joanna Briggs Institute Reviewer’s Manual; Aromataris, E., Munn, Z., Eds.; The Joanna Briggs Institute: Adelaide, Australia, 2017. [Google Scholar]
  15. Bramer, W.M.; Giustini, D.; de Jonge, G.B.; Holland, L.; Bekhuis, T. De-duplication of database search results for systematic reviews in endnote. J. Med. Libr. Assoc. 2016, 104, 240–243. [Google Scholar] [CrossRef] [PubMed]
  16. Ouzzani, M.; Hammady, H.; Fedorowicz, Z.; Elmagarmid, A. Rayyan-a web and mobile app for systematic reviews. Syst. Rev. 2016, 5, 210. [Google Scholar] [CrossRef] [Green Version]
  17. Google Earth. Map Showing World Imagery. Available online: Earth.google.com/web (accessed on 16 March 2020).
  18. ESRI; DigitalGlobe; GeoEye; i-cubed; USDA FSA; USGS; AEX; Getmapping; Aerogrid; IGN; et al. Available online: https://www.arcgis.com/home/item.html?id=10df2279f9684e4a9f6a7f08febac2a9 (accessed on 30 March 2020).
  19. GADM. Available online: www.gadm.org (accessed on 29 March 2020).
  20. Rubel, F.; Brugger, K.; Haslinger, K.; Auer, I. The climate of the european alps: Shift of very high resolution köppen-geiger climate zones 1800–2100. Meteorol. Z. 2017, 26, 115–125. [Google Scholar] [CrossRef]
  21. Prince George’s County. Low-Impact Development Design Manual; Prince George’s County, MD, USA. 1997. Available online: https://www.princegeorgescountymd.gov/DocumentCenter/View/86/Low-Impact-Development-Design-Strategies-PDF (accessed on 29 March 2020).
  22. Yu, S.L.; Zhang, X.; Earles, A.; Sievers, M. Field testing of ultra-urban BMPs. In Proceedings of the 29th Annual Water Resources Planning and Management Conference, WRPMD 1999, Tempe, AZ, USA, 6–9 June 1999. [Google Scholar]
  23. Davis, A.P.; Shokouhian, M.; Sharma, H.; Minami, C.; Winogradoff, D. Water quality improvement through bioretention: Lead, copper, and zinc removal. Water Environ. Res. 2003, 75, 73–82. [Google Scholar] [CrossRef]
  24. Hsieh, C.-H.; Davis, A.P. Multiple-event study of bioretention for treatment of urban storm water runoff. Water Sci. Technol. 2005, 51, 177–181. [Google Scholar] [CrossRef]
  25. Dietz, M.E.; Clausen, J.C. A field evaluation of rain garden flow and pollutant treatment. WaterAirSoil Pollut. 2005, 167, 123–138. [Google Scholar] [CrossRef]
  26. Glass, C.; Bissouma, S. Evaluation of a parking lot bioretention cell for removal of stormwater pollutants. Wit Trans. Ecol. Environ. 2005, 81, 699–708. [Google Scholar]
  27. Hatt, B.E.; Fletcher, T.D.; Deletic, A. Hydrologic and pollutant removal performance of stormwater biofiltration systems at the field scale. J. Hydrol. 2009, 365, 310–321. [Google Scholar] [CrossRef]
  28. Le Coustumer, S.; Fletcher, T.D.; Deletic, A.; Barraud, S. Hydraulic performance of biofilters for stormwater management: First lessons from both laboratory and field studies. Water Sci. Technol. 2007, 56, 93–100. [Google Scholar] [CrossRef] [PubMed] [Green Version]
  29. Kazemi, F.; Beecham, S.; Gibbs, J.; Clay, R. Factors affecting terrestrial invertebrate diversity in bioretention basins in an Australian urban environment. Landsc. Urban Plan. 2009, 92, 304–313. [Google Scholar] [CrossRef]
  30. Hatt, B.E.; Fletcher, T.D.; Deletic, A. Pollutant removal performance of field-scale stormwater biofiltration systems. Water Sci. Technol. 2009, 59, 1567–1576. [Google Scholar] [CrossRef]
  31. Le Coustumer, S.; Fletcher, T.D.; Deletic, A.; Barraud, S.; Lewis, J.F. Hydraulic performance of biofilter systems for stormwater management: Influences of design and operation. J. Hydrol. 2009, 376, 16–23. [Google Scholar] [CrossRef]
  32. Li, Z.Y.; Lam, K.M. Statistical evaluation of bioretention system for hydrologic performance. Water Sci. Technol. 2015, 71, 1742–1749. [Google Scholar] [CrossRef] [PubMed]
  33. Jia, H.; Wang, X.; Ti, C.; Zhai, Y.; Field, R.; Tafuri, A.N.; Cai, H.; Yu, S.L. Field monitoring of a LID-BMP treatment train system in China. Environ. Monit. Assess. 2015, 187, 187. [Google Scholar] [CrossRef]
  34. Huang, T.L.; Wang, B.S.; Xu, J.; Nie, X.B. Pollutants removal performance of runoff ecological vegetation. Sustain. Environ. Res. 2011, 21, 161–166. [Google Scholar]
  35. Meng, Y.; Wang, H.; Chen, J.; Zhang, S. Modelling Hydrology of a Single Bioretention System with HYDRUS-1D. Sci. World J. 2014, 2014, 521047. [Google Scholar] [CrossRef]
  36. de Macedo, M.B.; do Lago, C.A.F.; Mendiondo, E.M.; Giacomoni, M.H. Bioretention performance under different rainfall regimes in subtropical conditions: A case study in São Carlos, Brazil. J. Environ. Manag. 2019, 248, 109266. [Google Scholar] [CrossRef]
  37. Fajardo-Herrera, R.J.; Valdelamar-Villegas, J.C.; Mouthon Bello, J. A Rain Garden for Nitrogen Removal from Storm Runoff in Tropical Cities. Rev. Cienc. Ambient. 2019, 53, 132–146. [Google Scholar] [CrossRef]
  38. Kazemi, F.; Beecham, S.; Gibbs, J. Streetscale bioretention basins in Melbourne and their effect on local biodiversity. Ecol. Eng. 2009, 35, 1454–1465. [Google Scholar] [CrossRef]
  39. Kazemi, F.; Golzarian, M.R.; Myers, B. Potential of combined Water Sensitive Urban Design systems for salinity treatment in urban environments. J. Environ. Manag. 2018, 209, 169–175. [Google Scholar] [CrossRef] [PubMed]
  40. Asplund, R.; Adbelkarim, O.B.; Skalli, A. An equity perspective on access to, enrolment in and finance of tertiary education. Educ. Econ. 2008, 16, 261–274. [Google Scholar] [CrossRef]
  41. Charlesworth, S.M.; Mezue, M. Sustainable Drainage Out of the Temperate Zone: The Humid Tropics. In Sustainable Surface Water Management: A Handbook for SUDS; Wiley-Blackwell: Hoboken, NJ, USA, 2016; p. 301. [Google Scholar]
  42. Fletcher, T.D.; Shuster, W.; Hunt, W.F.; Ashley, R.; Butler, D.; Arthur, S.; Trowsdale, S.; Barraud, S.; Semadeni-Davies, A.; Bertrand-Krajewski, J.-L.; et al. SUDS, LID, BMPs, WSUD and more—The evolution and application of terminology surrounding urban drainage. Urban Water J. 2015, 12, 525–542. [Google Scholar] [CrossRef]
  43. Itsukushima, R.; Ogahara, Y.; Iwanaga, Y.; Sato, T. Investigating the influence of various stormwater runoff control facilities on runoff control efficiency in a small catchment area. Sustainability 2018, 10, 407. [Google Scholar] [CrossRef] [Green Version]
  44. Lim, H.; Lu, X. Sustainable urban stormwater management in the tropics: An evaluation of Singapore’s ABC Waters Program. J. Hydrol. 2016, 538, 842–862. [Google Scholar] [CrossRef]
  45. Miguez, M.G.; Veról, A.P. Sustainable Drainage Systems in Brazil. In Sustainable Surface Water Management: A Handbook for SUDS; Charlesworth, S.M., Booth, C.A., Eds.; Wiley Online Library: Hoboken, NJ, USA, 2016; pp. 315–327. [Google Scholar]
  46. Shafique, M.; Kim, R. Recent progress in Low-Impact Development in South Korea: Water-management policies, challenges and opportunities. Water J. 2018, 10, 435. [Google Scholar] [CrossRef] [Green Version]
  47. Slätmo, E.; Nilsson, K.; Turunen, E. Implementing green infrastructure in spatial planning in Europe. Land Use Policy 2019, 8, 62. [Google Scholar] [CrossRef] [Green Version]
  48. US Environmental Protection Agency. Water quality planning and management: Total maximum daily loads (tmdl) and individual water quality-based effluent limitations. In 40 C.F.R. 130.7.; Regulations, C.O.F., Ed.; US Environmental Protection Agency: Washington, DC, USA, 2011. [Google Scholar]
  49. US Environmental Protection Agency. Low Impact Development (LID): A Literature Review; US EPA Office of Water (4203): Washington, DC, USA, 2000.
  50. Victorian Stormwater Committee. Urban Stormwater: Best-Practice Environmental Management Guidelines; CSIRO Publishing: Clayton, Australia, 1999.
  51. Brasil Ministerio das Cidades. Manual de Drenagem Urbana Sustentavel; Brasil Ministerio das Cidades: Brasilia, DF, Brazil, 2009.
  52. OECD. List of Oecd Member Countries. Available online: https://www.oecd.org/about/document/list-oecd-member-countries.htm (accessed on 2 March 2020).
  53. Nel, N.; Parker, A.; Silbernag, P. Improving water quality in stormwater & river systems: An approach for determining resources. J. S. Afr. Inst. Civ. Eng. 2013, 55, 22–35. [Google Scholar]
  54. Jagals, P. Stormwater runoff from typical developed and developing south african urban developments: Definitely not for swimming. Water Sci. Technol. 1997, 35, 133–140. [Google Scholar] [CrossRef]
  55. Arora, A.S.; Reddy, A. Multivariate analysis for assessing the quality of stormwater from different urban surfaces of the patiala city, punjab (india). Urban Water J. 2012, 10, 422–433. [Google Scholar] [CrossRef]
  56. de Wit, M.; Stankiewicz, J. Changes in Surface Water Supply across Africa with Predicted Climate Change. Science 2006, 311, 1917–1921. [Google Scholar] [CrossRef] [Green Version]
  57. Mall, R.K.; Gupta, A.; Singh, R.; Singh, R.S.; Rathore, L.S. Water resources and climate change: An Indian perspective. Curr. Sci. 2006, 90, 1610–1626. [Google Scholar]
  58. Aravena, J.E.; Dussaillant, A. Storm-water infiltration and focused recharge modeling with finite-volume two-dimensional Richards equation: Application to an experimental rain garden. J. Hydraul. Eng. 2009, 135, 1073–1080. [Google Scholar] [CrossRef] [Green Version]
  59. Lizarraga-Mendiola, L.; Vazquez-Rodriguez, G.A.; Lucho-Constantino, C.A.; Bigurra-Alzati, C.A.; Beltran-Hern, R.I.; Ortiz-Hern, J.E.; Lopez-Leon, L.D. Hydrological design of two low-impact development techniques in a semi-arid climate zone of central Mexico. Water 2017, 9, 561. [Google Scholar] [CrossRef] [Green Version]
  60. Davis, A.P.; Shokouhian, M.; Sharma, H.; Minami, C. Laboratory study of biological retention for urban stormwater management. Water Environ. Res. 2001, 73, 5–14. [Google Scholar] [CrossRef]
  61. Kim, H.; Seagren, E.A.; Davis, A.P. Engineered bioretention for removal of nitrate from stormwater runoff. Water Environ. Res. 2003, 75, 355–367. [Google Scholar] [CrossRef]
  62. CVC; TRCA. Low Impact Development Stormwater Management Planning and Design Guide. 2010. Available online: https://cvc.ca/low-impact-development/low-impact-development-support/stormwater-management-lid-guidance-documents/low-impact-development-stormwater-management-planning-and-design-guide/ (accessed on 6 November 2020).
  63. Berretta, C.; Aiello, A.; Jensen, H.S.; Tillotson, M.R.; Boxall, A.; Stovin, V. Influence of design and media amendments on the performance of stormwater biofilters. Proc. Inst. Civ. Eng. Water Manag. 2018, 171, 87–98. [Google Scholar] [CrossRef]
  64. Lee, L.Y.; Wang, B.; Guo, H.; Hu, J.Y.; Ong, S.L. Aluminum-based water treatment residue reuse for phosphorus removal. Water 2015, 7, 1480–1496. [Google Scholar] [CrossRef]
  65. O’Neill, S.W.; Davis, A.P. Water treatment residual as a bioretention amendment for phosphorus. I: Evaluation studies. J. Environ. Eng. (United States) 2012, 138, 318–327. [Google Scholar] [CrossRef]
  66. Zhang, W.; Brown, G.O.; Storm, D.E. Enhancement of heavy metals retention in sandy soil by amendment with fly ash. Trans. Asabe 2008, 51, 1247–1254. [Google Scholar] [CrossRef]
  67. Al-Ameri, M.; Hatt, B.; Le Coustumer, S.; Fletcher, T.; Payne, E.; Deletic, A. Accumulation of heavy metals in stormwater bioretention media: A field study of temporal and spatial variation. J. Hydrol. 2018, 567, 721–731. [Google Scholar] [CrossRef]
  68. Li, J.; Jiang, C.; Lei, T.; Li, Y. Experimental study and simulation of water quality purification of urban surface runoff using non-vegetated bioswales. Ecol. Eng. 2016, 95, 706–713. [Google Scholar] [CrossRef]
  69. Chapman, C.; Horner, R.R. Performance assessment of a street-drainage bioretention system. Water Environ. Res. 2010, 82, 109–119. [Google Scholar] [CrossRef] [PubMed]
  70. Turk, R.L.; Kraus, H.T.; Bilderback, T.E.; Hunt, W.F.; Fonteno, W.C. Rain Garden Filter Bed Substrates Affect Stormwater Nutrient Remediation. Hortscience 2014, 49, 645–652. [Google Scholar] [CrossRef]
  71. Dussaillant, A.; Wu, C.H.; Potter, K.W. Richards equation model of a rain garden. J. Hydrol. Eng. 2004, 9, 219–225. [Google Scholar] [CrossRef]
  72. Randelovic, A.; Zhang, K.; Jacimovic, N.; McCarthy, D.; Deletic, A. Stormwater biofilter treatment model (MPiRe) for selected micro-pollutants. Water Res. 2016, 89, 180–191. [Google Scholar] [CrossRef]
  73. US Environmental Protection Agency. Stormwater Management Model (SWMM). Available online: https://www.epa.gov/water-research/storm-water-management-model-swmm (accessed on 7 August 2020).
  74. Endreny, T.; Collins, V. Implications of bioretention basin spatial arrangements on stormwater recharge and groundwater mounding. Ecol. Eng. 2009, 35, 670–677. [Google Scholar] [CrossRef]
  75. Lynn, T.J.; Nachabe, M.H.; Ergas, S.J. Modeling denitrifying stormwater biofilters using SWMM5. J. Environ. Eng. 2017, 143, 04017017. [Google Scholar] [CrossRef]
  76. Huang, C.-L.; Hsu, N.-S.; Liu, H.-J.; Huang, Y.-H. Optimization of low impact development layout designs for megacity flood mitigation. J. Hydrol. 2018, 564, 542–558. [Google Scholar] [CrossRef]
  77. Wisconsin Department of Natural Resources. RECARGA Model. Available online: https://dnr.wi.gov/topic/stormwater/standards/recarga.html (accessed on 7 August 2020).
  78. Dussaillant, A.R.; Cuevas, A.; Potter, K.W. Raingardens for stormwater infiltration and focused groundwater recharge: Simulations for different world climates. Water Sci. Technol. 2005, 5, 173–179. [Google Scholar] [CrossRef]
  79. Hoskins, J.; Peterein, J. Case Study of St. Louis, Missouri: Comparison of Bioretention Performance to the Runoff Component of a Restored Water Balance. J. Environ. Eng. 2015, 139, 516–521. [Google Scholar] [CrossRef]
  80. Boanca, P.; Dumitras, A.; Luca, L.; Bors-Oprisa, S.; Laczi, E. Analysing Bioretention Hydraulics and Runoff Retention through Numerical Modelling Using RECARGA: A Case Study in a Romanian Urban Area. Pol. J. Environ. Stud. 2018, 27, 1965–1973. [Google Scholar] [CrossRef]
  81. PC-Progress. Hydrus-1D Downloads. Available online: https://www.pc-progress.com/en/Default.aspx?H1d-downloads (accessed on 7 August 2020).
  82. PC-Progress. HYDRUS (2D/3D) Downloads. Available online: https://www.pc-progress.com/en/Default.aspx?h3d-downloads (accessed on 7 August 2020).
  83. Stewart, R.D.; Lee, J.G.; Shuster, W.D.; Darner, R.A. Modelling hydrological response to a fully-monitored urban bioretention cell. Hydrol. Process. 2017, 31, 4626–4638. [Google Scholar] [CrossRef]
  84. Li, J.; Zhao, R.; Li, Y.; Chen, L. Modeling the effects of parameter optimization on three bioretention tanks using the HYDRUS-1D model. J. Environ. Manag. 2018, 217, 38–46. [Google Scholar] [CrossRef]
  85. eWater. Access & Licensing. Available online: https://ewater.org.au/products/music/access-licensing/ (accessed on 7 August 2020).
  86. Beecham, S.; Chowdhury, R. Effects of changing rainfall patterns on WSUD in Australia. Proc. Inst. Civ. Eng. Water Manag. 2012, 165, 285–298. [Google Scholar] [CrossRef]
  87. Imteaz, M.A.; Ahsan, A.; Rahman, A.; Mekanik, F. Modelling stormwater treatment systems using MUSIC: Accuracy. Resour. Conserv. Recycl. 2013, 71, 15–21. [Google Scholar] [CrossRef]
  88. Rahman, M.A.; Imteaz, M.A.; Arulrajah, A. Suitability of reclaimed asphalt pavement and recycled crushed brick as filter media in bioretention applications. Int. J. Environ. Sustain. Dev. 2016, 15, 32–48. [Google Scholar] [CrossRef]
  89. US Army Corps of Engineers. HEC-HMS Downloads. Available online: https://www.hec.usace.army.mil/software/hec-hms/downloads.aspx (accessed on 7 August 2020).
  90. Heasom, W.; Traver, R.G.; Welker, A. Hydrologic modeling of a bioinfiltration best management practice. J. Am. Water Resour. Assoc. 2006, 42, 1329–1347. [Google Scholar] [CrossRef]
  91. Palhegyi, G.E. Modeling and sizing bioretention using flow duration control. J. Hydrol. Eng. 2010, 15, 417–425. [Google Scholar] [CrossRef]
  92. Machusick, M.; Welker, A.; Traver, R. Groundwater Mounding at a Storm-Water Infiltration BMP. J. Irrig. Drain. Eng. 2011, 137, 154–160. [Google Scholar] [CrossRef]
  93. Zhang, K.F.; Randelovic, A.; Deletic, A.; Page, D.; McCarthy, D.T. Stormwater biofilters: A new validation modelling tool. Ecol. Eng. 2016, 87, 53–61. [Google Scholar] [CrossRef]
  94. Shen, P.; Deletic, A.; Urich, C.; Chandrasena, G.I.; McCarthy, D.T. Stormwater biofilter treatment model for faecal microorganisms. Sci. Total Environ. 2018, 630, 992–1002. [Google Scholar] [CrossRef]
  95. Soil & Water Assessment Tool. Download SWAT 2012. Available online: https://swat.tamu.edu/ (accessed on 7 August 2020).
  96. Her, Y.; Jeong, J.; Arnold, J.; Gosselink, L.; Glick, R.; Jaber, F. A new framework for modeling decentralized low impact developments using Soil and Water Assessment Tool. Environ. Model. Softw. 2017, 96, 305–322. [Google Scholar] [CrossRef]
  97. Shannak, S. The effects of green infrastructure on exceedance of critical shear stress in Blunn Creek watershed. Appl. Water Sci. 2017, 7, 2975–2986. [Google Scholar] [CrossRef]
  98. Li, H.; Davis, A.P. Urban particle capture in bioretention media. II: Theory and model development. J. Environ. Eng. 2008, 134, 419–432. [Google Scholar] [CrossRef]
  99. Kabir, M.I.; Daly, E.; Maggi, F. Geochemical modelling of heavy metals in urban stormwater biofilters. Ecol. Eng. 2017, 102, 565–576. [Google Scholar] [CrossRef]
  100. Wadzuk, B.M.; Lewellyn, C.; Lee, R.; Traver, R.G. Green Infrastructure Recovery: Analysis of the Influence of Back-to-Back Rainfall Events. J. Sustain. Water Built Environ. 2017, 3, 04017001. [Google Scholar] [CrossRef]
  101. Bhatt, A.; Bradford, A.; Abbassi, B.E. Cradle-to-grave life cycle assessment (LCA) of low-impact-development (LID) technologies in southern Ontario. J Environ. Manag. 2019, 231, 98–109. [Google Scholar] [CrossRef]
  102. Vineyard, D.; Ingwersen, W.W.; Hawkins, T.R.; Xue, X.; Demeke, B.; Shuster, W. Comparing Green and Grey Infrastructure Using Life Cycle Cost and Environmental Impact: A Rain Garden Case Study in Cincinnati, OH. J. Am. Water Resour. Assoc. 2015, 51, 1342–1360. [Google Scholar] [CrossRef]
  103. Horstmeyer, N.; Huber, M.; Drewes, J.E.; Helmreich, B. Evaluation of site-specific factors influencing heavy metal contents in the topsoil of vegetated infiltration swales. Sci. Total Environ. 2016, 560, 19–28. [Google Scholar] [CrossRef]
  104. Guo, C.; Li, J.; Li, H.; Zhang, B.; Ma, M.; Li, F. Seven-year running effect evaluation and fate analysis of rain gardens in Xi’an, Northwest China. Water 2018, 10, 944. [Google Scholar] [CrossRef] [Green Version]
  105. Komlos, J.; Traver, R.G. Long-term orthophosphate removal in a field-scale storm-water bioinfiltration rain garden. J. Environ. Eng. 2012, 138, 991–998. [Google Scholar] [CrossRef]
  106. Hess, A.; Wadzuk, B.; Welker, A. Evapotranspiration in rain gardens using weighing lysimeters. J. Irrig. Drain. Eng. 2017, 143, 4017004. [Google Scholar] [CrossRef]
  107. Wadzuk, B.M.; Hickman, J.M.; Traver, R.G. Understanding the Role of Evapotranspiration in Bioretention: Mesocosm Study. J. Sustain. Water Built Environ. 2015, 1, 4014002. [Google Scholar] [CrossRef]
  108. Denich, C.; Bradford, A. Estimation of evapotranspiration from bioretention areas using weighing lysimeters. J. Hydrol. Eng. 2010, 15, 522–530. [Google Scholar] [CrossRef]
  109. Brown, R.A.; Hunt, W.F. Impacts of Media Depth on Effluent Water Quality and Hydrologic Performance of Undersized Bioretention Cells. J. Irrig. Drain. Eng. 2011, 137, 132–143. [Google Scholar] [CrossRef]
  110. Khan, U.T.; Valeo, C.; Chu, A.; van Duin, B. Bioretention cell efficacy in cold climates: Part 1-hydrologic performance. Can. J. Civ. Eng. 2012, 39, 1210–1221. [Google Scholar] [CrossRef]
  111. Muthanna, T.M.; Viklander, M.; Thorolfsson, S.T. Seasonal climatic effects on the hydrology of a rain garden. Hydrol. Process. 2008, 22, 1640–1649. [Google Scholar] [CrossRef]
  112. Liu, Y.; Engel, B.A.; Flanagan, D.C.; Gitau, M.W.; McMillan, S.K.; Chaubey, I.; Singh, S. Modeling framework for representing long-term effectiveness of best management practices in addressing hydrology and water quality problems: Framework development and demonstration using a Bayesian method. J. Hydrol. 2018, 560, 530–545. [Google Scholar] [CrossRef]
  113. Wolf, J.M.; Bell, C.D.; Boehm, A.B.; Hogue, T.S.; Luthy, R.G. Multiple Pathways to Bacterial Load Reduction by Stormwater Best Management Practices: Trade-Offs in Performance, Volume, and Treated Area. Environ. Sci. Technol. 2018, 52, 11968–11969. [Google Scholar]
  114. Gulbaz, S.; Kazezyilmaz-Alhan, C.M.; Temur, R. Development of an empirical formula for estimation of bioretention outflow rate. Water Sa 2019, 45, 209–215. [Google Scholar] [CrossRef] [Green Version]
  115. James, M.B.; Dymond, R.L. Bioretention hydrologic performance in an urban stormwater network. J. Hydrol. Eng. 2012, 17, 431–436. [Google Scholar] [CrossRef] [Green Version]
  116. Hess, A.; Wadzuk, B.; Welker, A. Predictive Evapotranspiration Equations in Rain Gardens. J. Irrig. Drain. Eng. 2019, 145, 4019010. [Google Scholar] [CrossRef]
  117. Davis, A.P. Field performance of bioretention: Hydrology impacts. J. Hydrol. Eng. 2008, 13, 90–95. [Google Scholar] [CrossRef] [Green Version]
  118. Brown, R.A.; Hunt, W.F. Improving bioretention/biofiltration performance with restorative maintenance. Water Sci. Technol. 2012, 65, 361–367. [Google Scholar] [CrossRef] [PubMed] [Green Version]
  119. Davis, A.P.; Traver, R.G.; Hunt, W.F.; Lee, R.; Brown, R.A.; Olszewski, J.M. Hydrologic Performance of Bioretention Storm-Water Control Measures. J. Hydrol. Eng. 2012, 17, 604–614. [Google Scholar] [CrossRef]
  120. Carpenter, D.D.; Hallam, L. Influence of planting soil mix characteristics on bioretention cell design and performance. J. Hydrol. Eng. 2010, 15, 404–416. [Google Scholar] [CrossRef]
  121. de Macedo, M.B.; Rosa, A.; do Lago, C.A.F.; Mendiondo, E.M.; de Souza, V.C.B. Learning from the operation, pathology and maintenance of a bioretention system to optimize urban drainage practices. J. Environ. Manag. 2017, 204, 454–466. [Google Scholar] [CrossRef]
  122. Debusk, K.M.; Wynn, T.M. Storm-water bioretention for runoff quality and quantity mitigation. J. Environ. Eng. 2011, 137, 800–808. [Google Scholar] [CrossRef]
  123. Walsh, C.J.; Roy, A.H.; Feminella, J.W.; Cottingham, P.D.; Groffman, P.M.; Morgan, R.P. The urban stream syndrome: Current knowledge and the search for a cure. J. N. Am. Benthol. Soc. 2005, 24, 706–723. [Google Scholar] [CrossRef]
  124. Bradford, A.; Gharabaghi, B. Evolution of ontario’s stormwater management planning and design guidance. Water Qual. Res. J. Can. 2004, 39, 343–355. [Google Scholar] [CrossRef]
  125. Chen, X.; Peltier, E.; Sturm, B.S.M.; Young, C.B. Nitrogen removal and nitrifying and denitrifying bacteria quantification in a stormwater bioretention system. Water Res. 2013, 47, 1691–1700. [Google Scholar] [CrossRef]
  126. Sun, Y.; Zhang, D.; Wang, Z.-W. The potential of using biological nitrogen removal technique for stormwater treatment. Ecol. Eng. 2017, 106, 482–495. [Google Scholar] [CrossRef]
  127. Daly, E.; Deletic, A.; Hatt, B.E.; Fletcher, T.D. Modelling of stormwater biofilters under random hydrologic variability: A case study of a car park at Monash University, Victoria (Australia). Hydrol. Process. 2012, 26, 3416–3424. [Google Scholar] [CrossRef]
  128. Water Research Foundation. International Stormwater Bmp Database. Available online: http://www.bmpdatabase.org/ (accessed on 29 February 2020).
  129. Geosyntec Consultants and Wright Water Engineers Inc. Urban Stormwater BMP Performance Monitoring; US EPA: Washington, DC, USA, 2009.
  130. McCutcheon, S.C. Water Quality Modeling. In Encyclopedia of Hydrological Sciences; Wiley Online Library: Hoboken, NJ, USA, 2005. [Google Scholar] [CrossRef]
  131. Johnson, J.P.; Hunt, W.F. Evaluating the spatial distribution of pollutants and associated maintenance requirements in an 11 year-old bioretention cell in urban Charlotte, NC. J. Environ. Manag. 2016, 184, 363–370. [Google Scholar] [CrossRef]
  132. Jia, W.; Chua, L.H.C.; Shanahan, P. Evaluation of pollutant removal efficiency of a bioretention basin and implications for stormwater management in tropical cities. Environ. Sci. Water Res. Technol. 2017, 3, 78–91. [Google Scholar]
  133. Anderson, A.R.; Franti, T.G.; Shelton, D.P. Hydrologic evaluation of residential rain gardens using a stormwater runoff simulator. Trans. Asabe 2018, 61, 495–508. [Google Scholar] [CrossRef]
  134. David, N.; Leatherbarrow, J.E.; Yee, D.; McKee, L.J. Removal Efficiencies of a Bioretention System for Trace Metals, PCBs, PAHs, and Dioxins in a Semiarid Environment. J. Environ. Eng. 2015, 141, 04014092. [Google Scholar] [CrossRef] [Green Version]
  135. Fassman, E. Stormwater BMP treatment performance variability for sediment and heavy metals. Sep. Purif. Technol. 2012, 84, 95–103. [Google Scholar] [CrossRef]
  136. Hathaway, J.M.; Hunt, W.F.; Graves, A.K.; Wright, J.D. Field evaluation of bioretention indicator bacteria sequestration in Wilmington, North Carolina. J. Environ. Eng. 2011, 137, 1103–1113. [Google Scholar] [CrossRef]
  137. Roseen, R.M.; Ballestero, T.P.; Houle, J.J.; Avellaneda, P.; Briggs, J.; Fowler, G.; Wildey, R. Seasonal performance variations for storm-water management systems in cold climate conditions. J. Environ. Eng. 2009, 135, 128–137. [Google Scholar] [CrossRef]
  138. Rycewicz-Borecki, M.; McLean, J.E.; Dupont, R.R. Bioaccumulation of copper, lead, and zinc in six macrophyte species grown in simulated stormwater bioretention systems. J. Environ. Manag. 2016, 166, 267–275. [Google Scholar] [CrossRef]
  139. Rycewicz-Borecki, M.; McLean, J.E.; Dupont, R.R. Nitrogen and phosphorus mass balance, retention and uptake in six plant species grown in stormwater bioretention microcosms. Ecol. Eng. 2017, 99, 409–416. [Google Scholar] [CrossRef]
  140. Smolek, A.P.; Anderson, A.R.; Hunt, W.F. Hydrologic and Water-Quality Evaluation of a Rapid-Flow Biofiltration Device. J. Environ. Eng. (United States) 2018, 144, 5017010. [Google Scholar] [CrossRef]
  141. Xiao, Q.; McPherson, E.G. Performance of engineered soil and trees in a parking lot bioswale. Urban Water J. 2011, 8, 241–253. [Google Scholar] [CrossRef]
  142. Saltelli, A.; Annoni, P. How to avoid a perfunctory sensitivity analysis. Environ. Model. Softw. 2010, 25, 1508–1517. [Google Scholar] [CrossRef]
  143. Jakeman, A.J.; Letcher, R.A.; Norton, J.P. Ten iterative steps in development and evaluation of environmental models. Environ. Model. Softw. 2006, 21, 602–614. [Google Scholar] [CrossRef] [Green Version]
  144. Woolsey, S.; Capelli, F.; Gonser, T.; Hoehn, E.; Hostmann, M.; Junker, B.; Paetzold, A.; Roulier, C.; Schweizer, S.; Tiegs, S.D.; et al. A strategy to assess river restoration success. Freshw. Biol. 2007, 52, 752–769. [Google Scholar] [CrossRef]
  145. Sutula, M.A.; Stein, E.D.; Collins, J.N.; Fetscher, A.E.; Clark, R. A practical guide for the development of a wetland assessment method: The California experience. J. Am. Water Resour. Assoc. 2006, 42, 157–175. [Google Scholar] [CrossRef]
Figure 1. PRISMA Diagram for this scoping review.
Water 12 03122 g001
Figure 2. Examples of data extracted under the study, system and model characteristics and key findings categories.
Water 12 03122 g002
Figure 3. Number of publications per year (bar) and the annual growth rate of publications (line), not shown when number of publications was less than 10 per year.
Water 12 03122 g003
Figure 4. Map showing the locations of studied bioretention cells and global Köppen–Geiger climate classification zones. The circle size represents the number of times bioretention cells were studied during each 5-year time frame within a cluster defined by a 25 km buffer around each bioretention cell. (A) Shows the results for the 2000–2005 and 2006–2010 periods, while (B) shows the results for the 2011–2015 and the 2016–2019 time periods. Labelled countries/regions are those in which at least one bioretention cell was studied during (A) 2000–2010 or (B) 2011–2019.
Water 12 03122 g004
Figure 5. Typical bioretention cell, according to average features reported in the literature. Media depth and ponding depth represent the average of reported values, and the percentage sand in the media represents the range of reported values.
Water 12 03122 g005
Figure 6. Histogram of system size (a), catchment size (b) and catchment area to system size ratio (c).
Water 12 03122 g006
Figure 7. Number of model instances per year by model name. Models that were only used a single time were grouped together in the “single use” category.
Water 12 03122 g007
Figure 8. Processes shown in Bioretention Models for Hydrology and Contaminant Transport Models.
Water 12 03122 g008
Figure 9. Number of Field Studies by Study Duration (a), Number of Events Monitored (b) and Age of Bioretention Cell (c).
Water 12 03122 g009
Figure 10. Breakdown of contaminant transport and fate studies by reduction pathway.
Water 12 03122 g010
Figure 11. Breakdown of contaminant transport and fate studies by pollutants.
Water 12 03122 g011
Figure 12. Breakdown of protocols used by year in hydrologic studies (a) and contaminant transport and fate studies (b).
Water 12 03122 g012
Figure 13. Breakdown of “other” topics covered in bioretention research, by year.
Water 12 03122 g013
Table 1. Scoping Review Inclusion and Exclusion Criteria.
CriteriaInclusionExclusion
Must meet the definition of a bioretention cell, even if it is referred to by another nameA bioretention cell was defined as a site-specific water quality and water quantity control device, containing vegetation and engineered soil media, and receiving urban stormwater runoff. Stormwater systems defined as biofiltration, bioinfiltration, bioswale, were included if the description of the system matched the definition of a bioretention cell given above. Drainage systems that were not bioretention cells. Any stormwater systems or methods that function similarly to a bioretention cell, but were not designed as such, were also not included, such as a vegetated drainage ditch in high-infiltration soils, or a clogged infiltration basin that vegetated naturally.
Bioretention cell must treat urban stormwater runoffThe bioretention cell(s) being studied must have received urban stormwater runoff, or an approximation of urban stormwater runoff (e.g., simulated runoff).Any stormwater system that treated a type of water other than urban stormwater (e.g., wastewater, agricultural runoff).
Independently assesses bioretentionOnly studies that assessed a bioretention cell independently.
Assessment primarily concerned hydrologic and/or contaminant transport and fate.
Studies that evaluated a bioretention cell in combination with other systems, and where the effect of the bioretention system on the measurements taken were not separated, e.g., studies where the data was collected at the river/stream/watershed level, and where the specific effect of the bioretention cell(s) could not be separated from other variables such as land-use practices.
Studies were also excluded if the objective was to assess where to place LID/GI measures and did not include any performance data of bioretention.
Type of studyStudies that evaluated bioretention cells in the field or through a conceptual model. A field study was defined as a study where the bioretention cell(s) being studied was (were) built into the ground in an outdoor setting. Conceptual models incorporated an element of computer simulation in the study.Studies that evaluated bioretention cells in highly controlled environments, such as a lab or a mesocosm.
“Case studies” or any type of article that did not provide metrics or criteria for evaluating bioretention cells.
Types of publicationOnly peer-reviewed journal articles that generated original research findings. Conference proceedings, theses, review articles.
LanguageOnly articles published in English. Articles written in all other languages than English.
Accessibility of full-text publicationsPublications required full text articles. Articles that could not be accessed using institutional access or direct correspondence with authors or abstracts without full-text articles.
Table 2. Bioretention cell physical characteristics reported by study authors, including description, range, average or more frequently reported, and the frequency of that characteristic being not reported out of 602 cells.
CharacteristicDescriptionRangeAverage% of Characteristic Not Reported
Media depthEngineered soil media, primary element determining hydrologic function0.14–3.2 m0.8 m 50 (292/602)
Media descriptionType and composition of engineered soil mediaSand, sandy, loam, gravel, organicSand and Sandy were most commonly usedN/A
Sand composition% of sand in engineered soil media>60%80–90%63 (361/602)
Amendments used in mediaNovel addition to media which enhances hydrologic or chemical characteristicsN/AN/A55 (330/602)
Organic matterOrganic compost or mulch added to the top of the mediaN/AN/A44 (265/602)
Ponding depthDepth available above media for temporary water storage0–0.52 m 0.15 m 67 (392/602)
Presence of underdrain A perforated pipe to convey water to an outfall when the rate of inflow exceeds the subsoil exfiltration rateN/AN/A36 (214/602)
Presence of submerged zoneHydraulic controls used within the media to create a permanently saturated zoneN/AN/A57 (341/602)
Presence of linerImpermeable liner to separate bioretention from the subsoilsN/AN/A55 (331/602)
Description of vegetationThe presence of and description of vegetation contained in the bioretention cellNot described for 44% (236/530); vague description (e.g., “native”, “shrubs”, “grasses”) for 13% (69/530); 43% (226/530) used proper taxonomic names9 (56/602)
Design manual usedWhether the author specified if the design of the bioretention cell was based on a particular manual of guidelineN/AN/A67 (383/602)
Table 4. Performance metrics used for evaluating hydrologic and contaminant transport and fate performance in bioretention cells. The percentage of total metrics gives the number of times each metric was used divided by the total number of metrics used in all hydrology studies (372).
Performance MetricDescriptionFormula/Data RequirementsLimitations% of Total Metrics
Volume Reduction (VR)Reduction in effluent volume between the inlet and the outlet, typically for the course of a storm event or 24-h period, or monthly or annually. Used as a regulatory metric in some jurisdictions. V R = V o u t V i n V R = V i n V o u t V i n Does not discriminate between removal pathways. In some cases the time period for reduction or the reduction metric is not clearly defined.35 (129/372)
Peak Flow reduction (Rp)Reduction in peak flow caused by the bioretention cell, typically over the course of a storm event. Used as a regulatory metric in some jurisdictions. R P = Q p , o u t Q p , i n R P = Q P , i n Q P , o u t Q P , i n Does not give information on total volumes. Over time it has been realized that many of the adverse outcomes from high peak flows are more associated with the total volume than the flow [123], so this metric is generally being phased-out in favour of volume-based metrics in a regulatory context [2,42,47,124].16 (60/372)
Flow Rate (Q, m³)Flow rate of the system. Often reported in comparison to a threshold flow rate determined by regulators.Requires flow rate monitoring in at least one point in bioretention cell. Non-normalized value, and therefore difficult to compare across sites.16 (58/372)
Hydraulic Conductivity (k, m s-1)Hydraulic conductivity of soil. Often given as the saturated conductivity (ksat). Design manuals will frequently have the acceptable ksat of the engineering media specified.Varies based on monitoring equipment and methodology, but generally follows Darcy’s Law K = J i Highly variable spatially and temporally, so not always comparable between cells or in different places in the same cell. Hydraulic conductivity of the native soil is important for determining overall efficacy along with the conductivity of the cell. 7 (26/372)
Lag Time (TL)Change in the time of flow caused by the bioretention cell or other LID system. T L = t q p , i n t q p , o u t   T L = t 1 , i n t 1 , o u t Inconsistent calculation or usage. The lag time may measure the delay in the timing of the peak flow between the inlet (tqp,in) and the outlet (tqp,out) or may measure the time between the start of inflow (t1,in) and the start of outflow (t1,out).6 (23/372)
Drain-down Time (TD, hr)Time it takes for the ponding zone in a bioretention cell to drain. Typically, a required maximum value is included in design manuals, to prevent leaving stagnant water.Requires water level and/or the effluent flow rate to be monitoredInconsistently utilized by researchers. Often a threshold maximum value is given in a design manual, so attention is only paid if the drain-down time exceeds that threshold. 3 (12/372)
Hydraulic Retention Time (τH)Amount of time water spends in the system. Frequently calculated at steady-state so the time period needs to be specified. τ H = V B C Q o u t The τH will change over the course of a storm event, so this metric may give erroneous results or be difficult to compare when different normalization times are used.3 (11/372)
Notes: QP = Peak flow (m³/s).
Table 5. Performance metrics used for evaluating contaminant transport and fate performance in bioretention cells. The percentage of total metrics gives the number of times each metric was used divided by the total number of metrics used in all contaminant fate and transport studies (1580).
Performance MetricDescriptionFormula/Data RequirementsLimitations% of Total Metrics
Effluent concentration
(Cout)
Concentration of the contaminant of interest in the effluent from the bioretention cell. We have also included general water quality parameters, such as temperature, in this category where they are measured at the effluent.Concentrations can also be expressed as the Event Mean Concentration (EMC), which is a flow-weighted concentration metric.Requires measurement of concentration at the effluent of the cell. Different techniques are used depending on the contaminant of interest. E M C = M T V T Not always clear whether the “effluent” is only underdrain flow, or if it includes other pathways such as infiltration or overflow. Effluent concentration is often a function of influent concentration, so it can be hard to generalize results when only this is reported.44 (701/1580)
Removal by concentration or Efficiency Ratio
(RC)
Bulk reduction in contaminant concentration between the influent and the effluent. R C = C o u t C i n R C = C o u t C i n C i n As with the effluent concentration, it is not always clear what pathways are considered in the effluent concentration (Cout). Additionally, the contaminant may be accumulated in the bioretention cell and released later or redirected towards groundwater. Concentrations also change across a hydrograph, so removal by concentration may not give a relevant result; if EMC are used this is less important.25 (393/1580)
Removal by mass or Summation of Loads(RM)Bulk reduction in contaminant concentration between the influent and the effluent. R M = M o u t M i n R C = M o u t M i n M i n It is not always clear what pathways are considered in removal, and whether this represents accumulation in the system, removal by hydraulic processes (such as infiltration), transformation or mineralization. 21 (328/1580)
Mass LoadingIntegral of the total mass entering or leaving the bioretention cell. Similar to the EMC but expressed as a mass rather than a concentration. M T = M i n d t Shows mass loadings, but not removal quantities or processes. Typically used to support mass removal calculations.6 (88/1580)
Threshold exceedanceA measure of when a metric is larger than the regulated or target value, typically on release from the system. Typically but not exclusively expressed on a concentration basis. Can also be used for hydrologic parameters. C o u t C t a r g e t   When expressed on a concentration basis, the overall mass loading from the system can still be high even if the concentration remains low. 3 (42/1580)
Soil distribution coefficient (Kd, L kg−1)Measure of equilibrium partitioning between a contaminant and soil. Used to investigate accumulation and transport through porous media. K d = C s o i l C w a t e r Can be expressed using different isotherms depending on sorption dynamics. Desorption can follow a different isotherm.1 (16/1580)
AccumulationMeasure of accumulation of a contaminant in soil, typically using soil concentrations taken in the cell. Measured using soil concentration, sometimes taken over time or after a lengthy operation of the system.Need to understand flows as well as accumulation to understand contaminant dynamics.0.4 (6/1580)
MT = total pollutant mass, VT = total runoff volume.
Publisher’s Note: MDPI stays neutral with regard to jurisdictional claims in published maps and institutional affiliations.

