Article

Variation of Melt Water and Rainfall Runoff and Their Impacts on Streamflow Changes during Recent Decades in Two Tibetan Plateau Basins

1
Department of Water Conservancy and Hydropower Engineering, Xihua University, Chengdu 610039, China
2
State Key Laboratory of Hydrology-Water Resources and Hydraulic Engineering, HoHai University, Nanjing 210098, China
3
Department of Geosciences, University of Oslo, 0316 Oslo, Norway
4
Powerchina Huadong Engineering Corporation Limited, Hangzhou 310014, China
*
Author to whom correspondence should be addressed.
Water 2020, 12(11), 3112; https://doi.org/10.3390/w12113112
Submission received: 18 September 2020 / Revised: 29 October 2020 / Accepted: 3 November 2020 / Published: 6 November 2020
(This article belongs to the Special Issue Hydrological Modeling in Water Cycle Processes)

Abstract

:
To fully understand potential changes in hydrological regime over the Lhasa River Basin (LRB) and the upstream of Niyang River Basin (UNRB) in Tibetan Plateau under global warming, the VIC-glacier model was employed to analyze the responses of rainfall runoff and melt water to recent climate change, and we also quantify their roles in controlling the trend of river streamflow during 1963–2012. The hydrological model was calibrated using the observed streamflow, glacier mass balance, and MODIS snow cover. The simulations indicate that there is a significant increasing trend in glacier runoff for both basins during 1963–2012, especially in the period of 2000s when it exhibits a large increment up to about 45% relative to baseline period. Rainfall runoff suggests a rising tendency whereas snowmelt runoff displays a general decreasing tendency. For both basins, increasing rainfall runoff was identified as the dominant driver for the upward trend in total runoff during 1963–2012. The role of glacier runoff in controlling the trend of total runoff is also obvious, especially in the more glaciated UNRB where increased glacier runoff accounts for up to 41% of the tendency in river discharge. Snowmelt runoff plays a minor role in affecting the trend of total runoff.

1. Introduction

With an area of 2.5 × 10⁶ km2 and mean elevation over 4000 m above the sea level, the Tibetan Plateau (TP) is the largest and highest plateau in the world [1]. The TP is also the source region of several important rivers in Asia such as the Yellow, the Yangtze, the Mekong, the Salween, and the Brahmaputra River, and is therefore called the ‘Water tower of Asia’ [2]. The TP provides fresh water to an area spanning about 5.6 million km2 and over 1.4 billion population [3], and discharge in this area is important for domestic, agricultural, and industrial use of downstream regions.
Due to the uniquely complex terrain and high elevation, glacier and snow cover are extensively developed on the Tibetan Plateau [4,5]. Investigations have shown that there are 36,763 glaciers with a total area of approximately 49,873 km2 on the TP [6], which is the largest outside of the Polar regions [7]. Meanwhile, snow cover is widely distributed over the TP. The snow-covered area over the TP is established in autumn and persists to the following spring, and even to summer in the western and southeastern parts at high elevation [8]. Glacier and snow are indicators of the weather and climate in and around the TP [9,10], and very sensitive to global warming. The TP has undergone significant climate warming since the mid-1950s, especially in winter [4]. Annual warming rate over the TP during 1961–2013 was measured at 0.3 °C/decade, about twice the global rate during the same period [11]. Global warming has accelerated the melting of the glacier and snow over the TP [12]. According to the First and Second Glacier Inventory Datasets of China, the glacier area on the TP has retreated by 23% over the past 50 years on the whole [13]. The Himalaya shows maximum glacial reduction in areal extent, while glaciers in the interior TP are moderately stable [1,14]. In respect of snow, its long-term variations under global warming have also been widely focused [11,15,16]. Due to the complex physical mechanisms behind snow cover and heterogeneous terrain over the TP, no consensus at present has yet been reached about the changing trend of snow cover during the past several decades in this region.
Snow and glacial melt are important hydrological processes in the TP [5,7,11,17,18], therefore, glacier recession and changes in snow cover under recent climate change are expected to affect the hydrological cycle and subsequently influence the quantity and seasonal distribution of basin runoff [10,19]. Meanwhile, rainfall is also a key factor contributing to streamflow in this region, especially in the eastern and southeastern TP. In Northwest China including TP, glacier retreat in 1990s has caused an increase of more than 5.5% in local river runoff [20]. Glacier retreat in the Himalayas has also greatly contributed to increased runoff in recent decades [21]. Based on hydrological data and Mann-Kendall analysis, the study of Chang et al. [22] indicates that glacier and snow melt runoff caused by warming climate, as well as precipitation, might be major drivers for the increasing streamflow in the source region of Yangtze River. Furthermore, in this region, Yao et al. [23] conducted a study by employing a statistical function between glacier volume and glacier area to calculate glacier runoff; the results suggest an increasing trend of 2.02 × 10⁸ m3/10a for glacier runoff during 1986–2009, which accounts for 17.5% of the total runoff changes in this period. In addition, Zhang et al. [24], by applying a modified degree-day model in the Tuotuo River basin located in the headwaters of the Yangtze River, found that in the 1990s, a two-thirds increase in river runoff was caused by the increase of glacier runoff. Meanwhile, on the basis of the statistical mechanics and maximum entropy principle model, studies on the upstream of the Shule River basin reveal that the impact of glacier runoff on river flow has increased during 1957–2010, especially after 2000 [6]. In addition, in this region, Zhang et al. [17], by adopting a macroscale hydrological model, indicated that the increase in glacier runoff accounts for approximately half of the increase in river runoff from 1971 to 2012. In the upper reach of the Heihe River basin, under precipitation rise and heavy cryosphere melting, the river runoff increases quickly after 1998 [25]. Furthermore, in the upstream of Mekong and Salween River basins, it is found that rainfall runoff has the largest impact on changes in river runoff, while there is moderate influence from ice melt runoff [26]. However, most of the above studies are based on statistical analysis of the measured data, to evaluate the influence of melt water on river runoff change in recent decades. There are still relatively few researches employing hydrological processes simulation-based method to comprehensively and systematically quantify the respective role of glacier runoff, snowmelt runoff, and rainfall runoff in affecting streamflow trend over the TP river basins.
The Lhasa and Niyang River Basins are the two large tributaries of the upper Brahmaputra River basin. Changes in water resources in the two basins have an impact on not only local social and economic development, but also affect water supply for agricultural and industry activities in downstream areas such as navigation or operation of hydropower plants. There are some researches analyzing the connections between streamflow, melt runoff, and climate [12,27,28,29]. However, to what extent the melt and rainfall runoff control the change trend of river streamflow still remains unclear in the two regions, especially in the relatively more glaciated Niyang River Basin.
In this study, the degree-day model is coupled with the Variable Infiltration Capacity (VIC) model, i.e., the VIC-glacier model [30] is employed in the Lhasa River Basin (LRB) and upstream of the Niyang River Basin (UNRB) (Figure 1). An advantage of the hydrological modeling approach is the possibility of deriving certain components, such as soil moisture or snow runoff, which are not actually observed with long time-series in large scale basins. There are three main objectives in this study: (1) to quantify the contributions of rainfall, snowmelt, and glacier melt runoff to the total runoff of the two basins; (2) to study the response of the three runoff components to recent climate change during years 1963–2012; (3) to investigate the hydrological role of each runoff component in controlling the streamflow trend over the two focus basins.

2. Materials and Methods
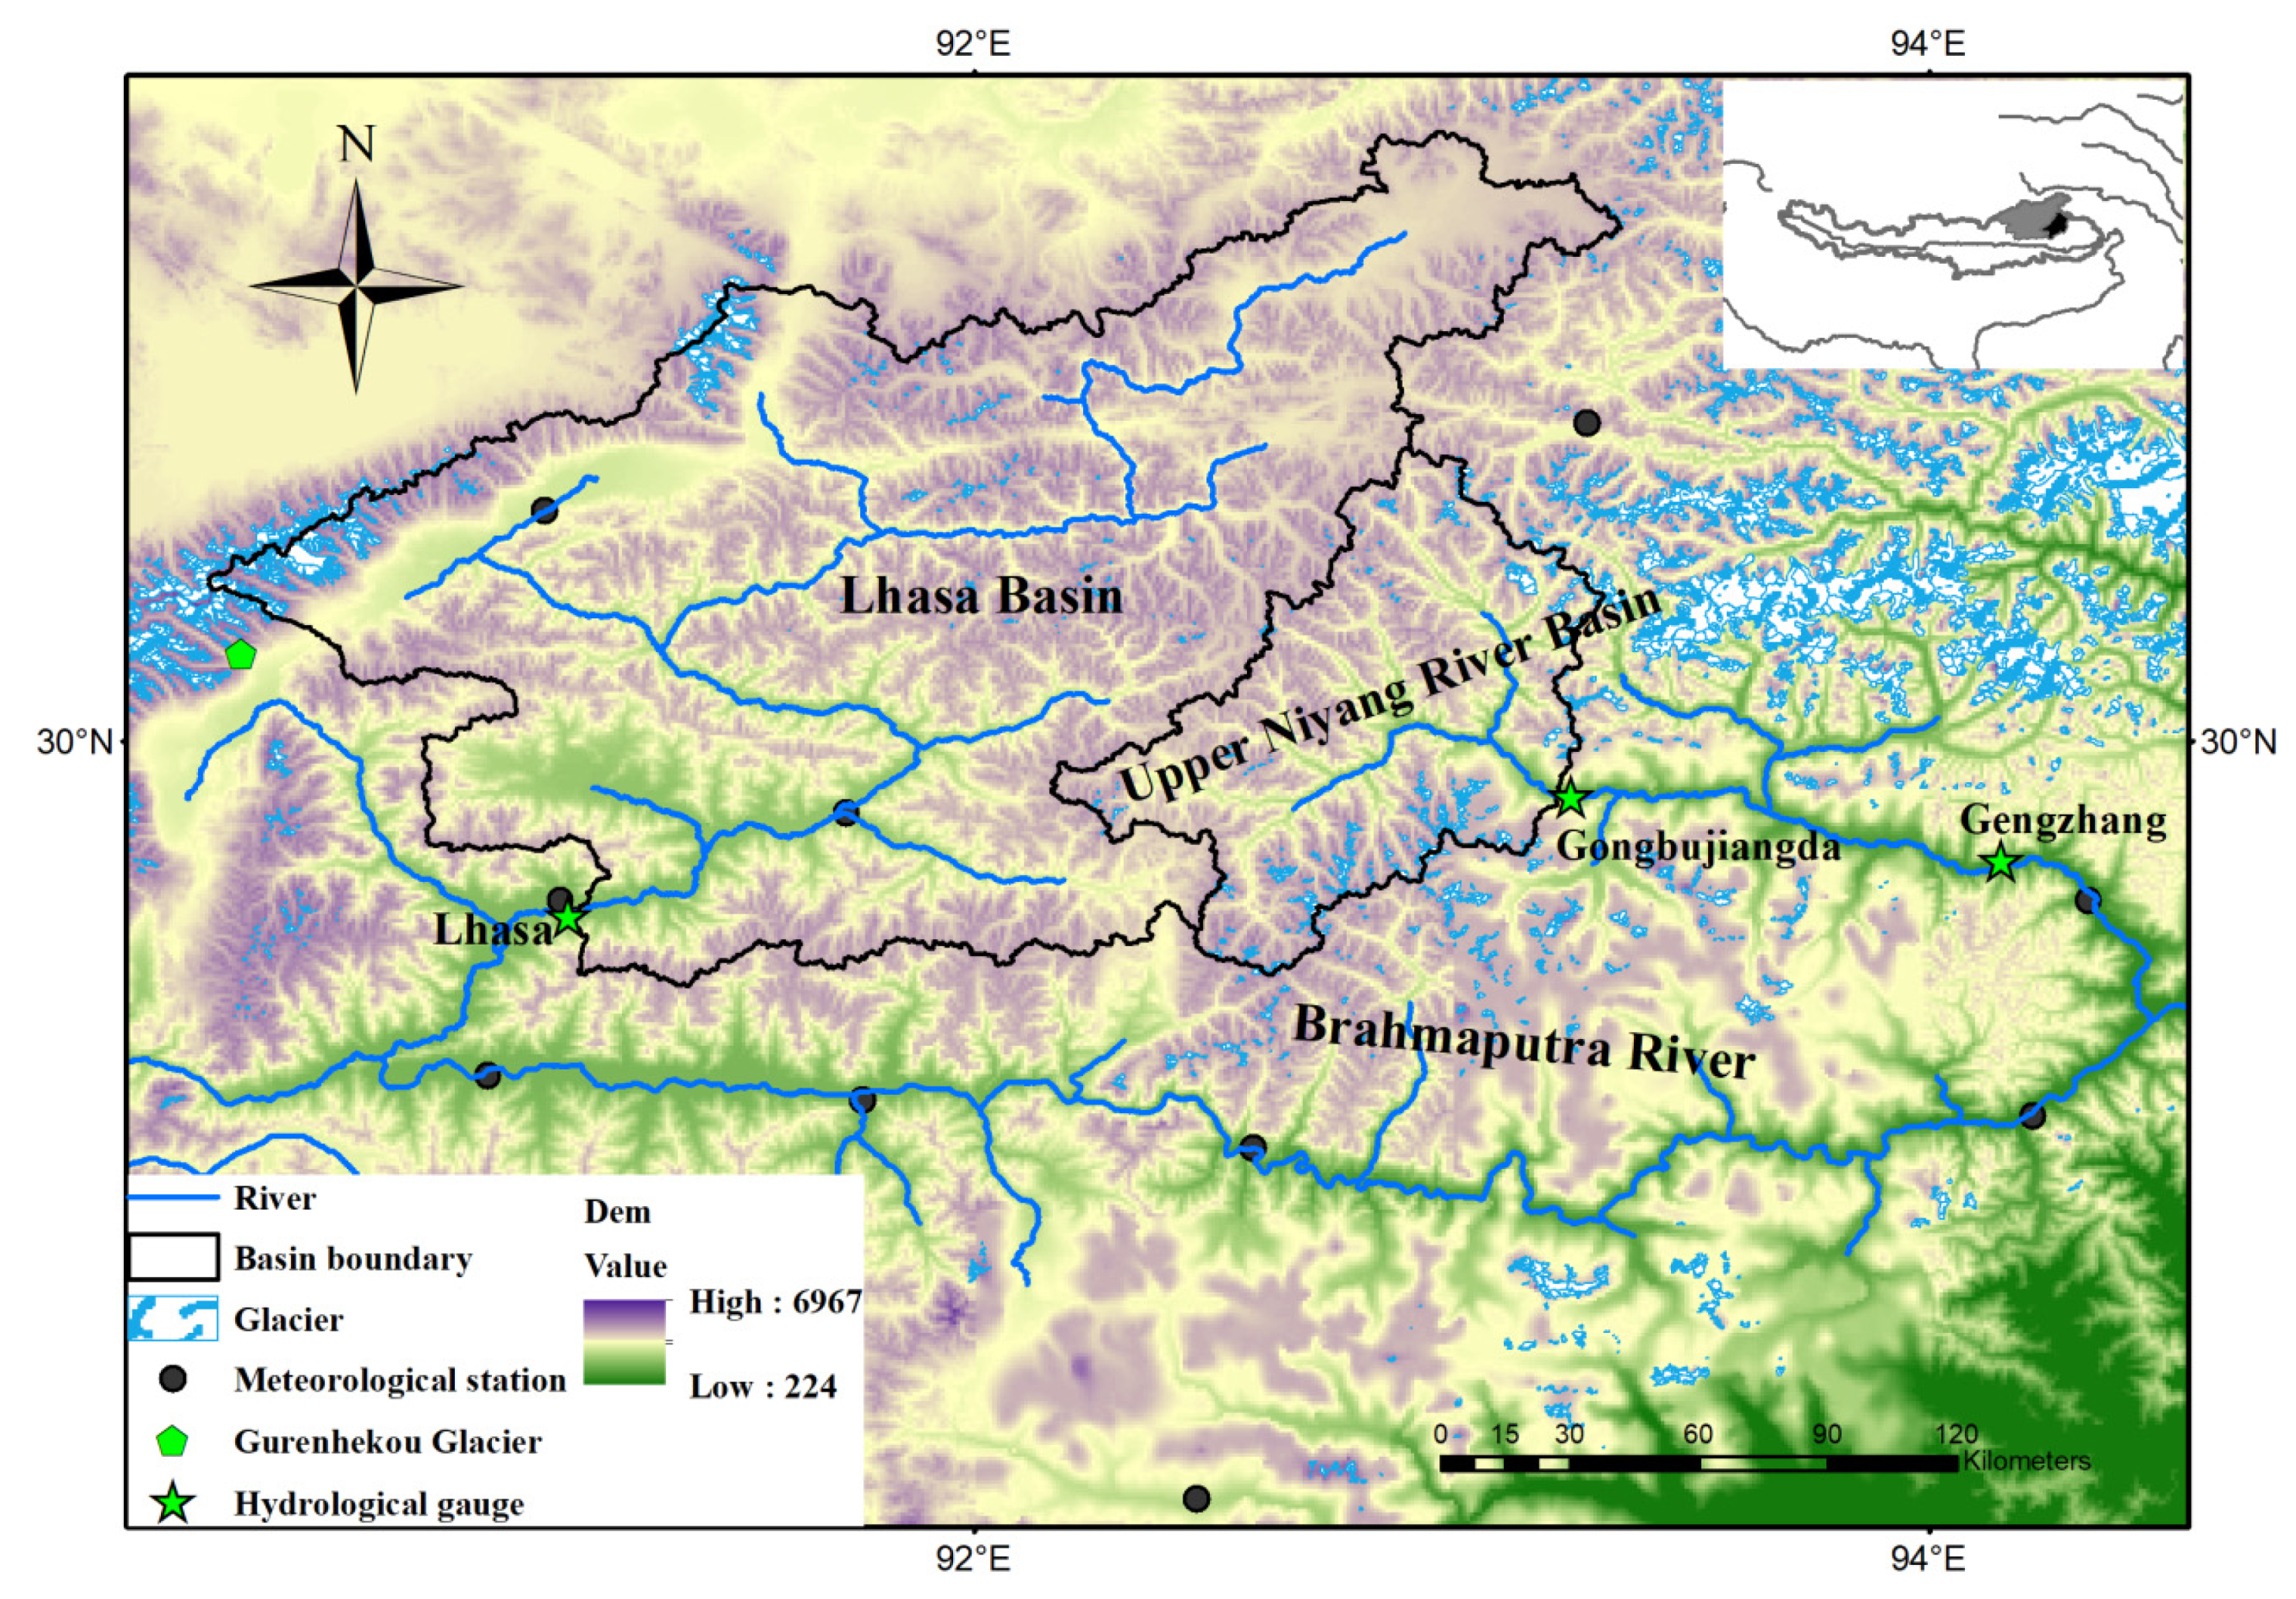
2.1. Study Areas

In this study, the Lhasa River Basin (LRB) above the Lhasa hydrological gauge (26,235 km2) and the upper reach of the Niyang River Basin (UNRB) above the Gongbujiangda hydrological gauge (6417 km2) (Table 1), are taken as the study objectives, respectively. The two basins are located within 90–94° E and 28–32° N (Figure 1). The Lhasa and Niyang Rivers are the two large tributaries of the upper Brahmaputra River over the Tibetan Plateau. These regions has an elevation range from 3000 to 6967 m a.s.l. The two basins belong to the Tibetan Plateau climate system. Due to the influence of the southwest monsoon, the wet season lasts from May to September, while the dry season spans from October to next April as the result of westerlies prevailing. Annual precipitation is about 650 mm for LRB and 790 mm for UNRB. Precipitation in wet season accounts for over 85% of the total annual precipitation in the two basins. Rainfall events are characterized by low intensity, long duration, and most of them occur in night. Meanwhile, the study regions exhibit an overall intense solar radiation all the year around, and a high daytime air temperature range but low annual air temperature fluctuations. Moreover, the UNRB is covered by a 231-km2 glacier, which is 3.6% of the basin area, while the ratio of the glacier is 1.36% in the LRB (from the First Chinese Glacier Inventory: http://www.ncdc.ac.cn/portal/metadata/bec2973b-e989-4058-b768-5e7d2bed14a).

2.2. Data

To run the VIC model, some input data are needed to prepare, including meteorological forcing data (precipitation, maximum, minimum air temperature and wind speed), and soil and vegetation data. Other meteorological variables, such as vapour pressure, short wave radiation, and long wave radiation, which are hard to measure on a large scale basin, are usually calculated by daily precipitation and temperature [31].
The ground observations of meteorological variables for 1963–2012 were collected from 11 meteorological stations of Chinese Meteorological Administration (CMA) in and around the study regions. The data of meteorological stations have been fully quality controlled by CMA before releasing them [32]. The CMA stations’ data include daily precipitation, maximum, minimum air temperature, and wind speed. Compared to temperature, precipitation is more heterogeneous and uneven, and is affected by many factors such as local topography and atmospheric circulation, especially on the Tibetan Plateau with high elevation and complex terrain. Therefore, to reduce uncertainty, a gridded precipitation dataset with a complex interpolation algorithm was utilized in this hydrological simulation, instead of directly interpolating the precipitation data of 11 CMA stations into grid data as input to VIC model. This gridded precipitation dataset was developed by the Institute of Geographic Science and Natural Resources Research (hereafter called IGSNRR), Chinese Academy of Sciences [33], which was generated into 0.25° grid resolution data based on daily precipitation from 756 CMA stations by using the synergraphic mapping system (SYMAP) algorithm. The spatial and temporal resolution of IGSNRR precipitation data is 0.25° and three hours, respectively. For detailed information on IGSNRR precipitation, refer to Zhang et al. [33]. More importantly, the performance of IGSNRR precipitation has been evaluated against the independently observed station precipitation in the Lhasa River Basin and Niyang River Basin, and the results suggest that the IGSNRR dataset is a good precipitation product in this region [34]. Therefore, in this study, we employed the IGSNRR precipitation data in hydrological modelling for 1963–2012. All the CMA station data and the IGSNRR precipitation were interpolated to 1/12° × 1/12° grids by using the inverse distance weighting (IDW) interpolation method. To consider the topographical role in temperature, the monthly vertical temperature lapse rates (Tlaps) were derived by fitting a linear function between temperature and CMA station elevation. Pearson correlation coefficient R (Table 2) for all months is larger than 0.7, which implies a good relationship between the two factors, and so the monthly Tlaps can be employed in the IDW to obtain more precise grid temperature data over the focus regions.
With regard to glacier data, the first and second Chinese Glacier Inventory (FCGI and SCGI) were used to extract the glacier distribution over the two basins. The FCGI and SCGI were released by the Cold and Arid Region Environmental and Engineering Research, Institute of the Chinese Academy of Sciences [35,36]. The extracted glacier data from the FCGI were utilized to initialize the glacier percentage in the 1/12° × 1/12° grid. Then, the changes in glacier area between the FCGI and SCGI are used to calibrate and validate the glacier model parameters, i.e., degree-day factors (DDFsnow/ice). In addition, field glacier mass balance observations during 2006–2010 at the Gurenhekou glacier (Figure 1) were collected [14]. The Gurenhekou glacier is located on the southern slope of Nyainqentanglha Mountain, and it ranges from 5525 to 6040 m a.s.l.
Meanwhile, the Moderate Resolution Imaging Spectroradiometer (MODIS) snow cover data (MODIS10C2) with a resolution of 8 days and 0.05° for 2001–2012 were employed to analyze the VIC performance in snow simulation. This MODIS data were downloaded from the National Snow and Ice Data Center of the NASA (http://nsidc.org/data/MOD10C2/versions/6). The eight-day MODIS snow cover data were averaged to a monthly scale, which can be used to evaluate the VIC performance in snow simulation.
The land surface data and parameters are also required for running the VIC model, including soil parameters, land use data, and topography data. Soil parameters (e.g., soil filed capacity and saturated hydrologic conductivity) were obtained from the Harmonized World Soil Database (HWSD)(http://www.fao.org/soils-portal/soil-survey/soil-maps-and-databases/harmonized-world-soil-database-v12/en/), which is constructed by FAO and IIASA and contains more than 16,000 different soil mapping units. The vegetation types and parameters were derived from a 1 km global land cover map supplied by the University of Maryland (http://www.glass.umd.edu/Download.html). Meanwhile, the topography data for the study region were obtained from GTOPO30 with a resolution of 1 km × 1 km (http://eros.usgs.gov/#/Find_Data/Products_and_Data_Available/gtopo30_info). The elevation data were used to delineate basin boundaries and create digital river networks.
In addition, monthly observed streamflow data at Lhasa (1963–2010) and Gongbujiangda (1979–2010) (Figure 1) gauges were collected from the Tibetan Hydrological Bureau. These discharge data were utilized to assess the VIC-glacier model simulations in the two basins.

2.3. Methods

2.3.1. Model Description and Parameters

As some glaciers are distributed over the study regions, a hydrological model with a glacier module should be considered for better simulation of the melt water released from the iceberg. A few hydrological models contain the glacier melt module, such as the Glacio-hydrological Degree-day Model (GDM) [37], Hydrologiska Byrans Vattenbalansavdelning-D (HBV-D) [38], Model of Water Availability in Semi-Arid Environments (WASA) [39], and Spatial Processes in Hydrology (SPHY) model [40]. Meanwhile, the glacier simulation component was recently integrated into some commonly applied hydrological models, such as the Soil Water Assessment Tool (SWAT) model [41], the Coupled Routing and Excess Storage (CREST) model [42], and the J2000 model [43], to enhance their simulation accuracy in high-mountain areas. In this study, the Variable Infiltration Capacity (VIC) model-glacier (‘VIC-glacier’) model was employed in the two basins, which links a degree-day model with the VIC model [30]. The VIC model is a physically based, semi-distributed hydrologic model, which can simulate the physical exchange of water and energy among soil, vegetation, and atmosphere in a grid cell [44,45]. It also balances both the water and surface energy budgets within the grid cell. Meanwhile, the VIC model includes a two-layer energy balance snow model, frozen soil and permafrost algorithm to represent the cold land processes [44,45,46]. Recently, the VIC-glacier model was employed to simulate runoff in upstream regions of several TP rivers and some TP lakes basins [47,48]; it performed well in these basins. Therefore, the VIC-glacier model was selected to simulate the hydrological processes in the LRB and UNRB. In the VIC model, snowfall and rainfall was differentiated by using a temperature threshold (critical temperature). If air temperature is higher than a rainfall temperature threshold, the precipitation is rainfall. If the air temperature is lower than a snowfall temperature threshold, the precipitation is snowfall. In this study, we set 0 °C as both the rainfall and snowfall temperature threshold.
The total runoff including the glacier meltwater from each grid is calculated as:
R i = f × M i + ( 1 f ) × R v i c
where R i is the total runoff in grid i, f is the percentage of the glacier area, M i is the glacier melt runoff calculated by using the degree-day model, R v i c is the runoff from nonglacierized area. The variable f can be derived by dividing the grid area by glacier area (s) on the grid cell. Glacier area in the VIC-glacier model is updated annually based on glacier volume-area scaling function as follows:
V = 0.04 × S 1.43
where V is the ice volume and S is the glacier area [30]. The initial glacier area can be derived from the First Chinese Glacier Inventory. In this study, a modeling framework was set up at a spatial resolution of the 1/12° × 1/12° over the two basins.
In this study, a modeling framework was set up at a spatial resolution of the 1/12° × 1/12° and temporal resolution is at a three-hourly time step over the two basins. The CMA station daily data and IGSNRR precipitation data (three hours step) were firstly interpolated to the 1/12° × 1/12° grids by using the inverse distance weighting (IDW) interpolation method. Secondly, daily temperature was interpolated to a three-hour step by using an asymmetric spline function. The three hourly wind speeds were kept the same as the daily mean wind speed. The vegetation data, HWSD soil data, and DEM were resampled to 1/12° × 1/12°grids.
In the modeling work, two categories of model parameters need to be determined, including (1) the degree-day factors of ice and snow (DDFsnow/ice) and (2) parameters in the VIC model. The initial values of DDFsnow/ice in the LRB and UNRB were obtained from a previous study on western China [49]. The observed glacier area then changes between the First and the Second Glacier Inventory, and the observed streamflow were further used to calibrate them. With respect to the VIC model parameters, some sensitive soil parameters most often need to be calibrated, including the infiltration parameter(binfilt), the thickness of the second soil layers (d2), and the base flow parameters (Ws, Ds, Dsmax) (Table 3). The range of the above parameters refers to some previous studies [30,50]. The observed monthly streamflow data at the Lhasa and Gongbujiangda hydrological gauges were used to calibrate the above VIC model parameters. For the LRB, the observed monthly streamflow data in 1963–1990 were used to calibrate the VIC-glacier model, and the validation of the model was carried out for the period of 1991–2010. In the UNRB, 1979–1995 was selected as the calibration period and 1996–2010 as the validation period. In this study, manual calibration was employed to calibrate the VIC-glacier model to improve the agreement between the simulated and observed hydrography. The percent bias (PBIAS) and Nash-Sutcliffe efficiency coefficient (NSE) were used to check the performance of this model in flow simulation. In addition, the coefficient of determination (R2) and Root Mean Square Errors (RMSE) were employed to assess the performance of the VIC-glacier model in other aspects, such as simulating glacier melt.
P B I A S = i = 1 n ( Y i s i m Y i o b s ) × 100 i = 1 n Y i o b s
N S E = 1 i = 1 n ( Y i s i m Y i o b s ) 2 i = 1 n ( Y i s i m Y o b s , m e a n ) 2
R 2 = { i = 1 n [ ( Y i o b s Y o b s , m e a n ) ( Y i s i m Y s i m , m e a n ) ] [ i = 1 n ( Y i o b s Y o b s , m e a n ) 2 ] [ ( Y i s i m Y s i m , m e a n ) 2 ] } 2
R M S E = 1 n i = 1 n ( Y i s i m Y i o b s ) 2
where n denotes the number of samples, Y i o b s and Y i s i m are the observed and simulated value, Y o b s , m e a n and Y s i m , m e a n denotes the mean observed and simulated value over the focus period, respectively. The final determined parameters for the two basins are listed in Table 3.

2.3.2. Trend and Controlling Role Analyses

The Mann-Kendall method [51,52] was used to determine the evolution trend of hydrological or meteorological variables during 1963–2012. In this method, the standard normal statistic Z is calculated as the following:
Z = { ( S 1 ) / V a r ( S )             i f   S > 0   0                                                                       i f   S = 0 ( S 1 ) / V a r ( S )           i f   S < 0
S = i = 1 n 1 j = i + 1 n s g n ( x j x i )
s g n ( θ ) = { 1             i f     θ > 0   1             i f     θ = 0   1             i f     θ < 0  
V a r ( S ) = [ n ( n 1 ) ( 2 n + 5 ) t t ( t 1 ) ( 2 t + 5 ) ] / 18
where t is the extent of any given tie. A positive value of Z denotes an upward trend and vice versa.
Meanwhile, the Theil-Sen approach (TSA) [53] was utilized to quantify a variable’s trend. The TSA slope β is defined as the following:
β = M e d i a n ( x j x i j i )                         w h e r e                 n > j > j > 1
Moreover, as the river total runoff comprises of rainfall runoff, glacier runoff, and snowmelt runoff; therefore, the trend in total runoff ( T t o t a l ) equals the sum of the three runoff components’ individual tendency, i.e.,
T t o t a l = T R + T G + T S
where, T R , T G and T S are the trend of rainfall runoff, glacier runoff, and snowmelt runoff, respectively, and can be estimated by Equation (11).
Meanwhile, to further quantify the individual role of the three runoff components in affecting the streamflow trend, the percent contribution (%) can be obtained by dividing the trend in total runoff ( T t o t a l ) by the trend of runoff component. In other words, the controlling roles in total runoff’s trend from the three runoff components can be quantitatively represented by their ratio contributions. Recently, percent contribution was widely used to examine the roles of hydrological components in environmental factor trends over the TP basins or lakes [23,47,54].

3. Results

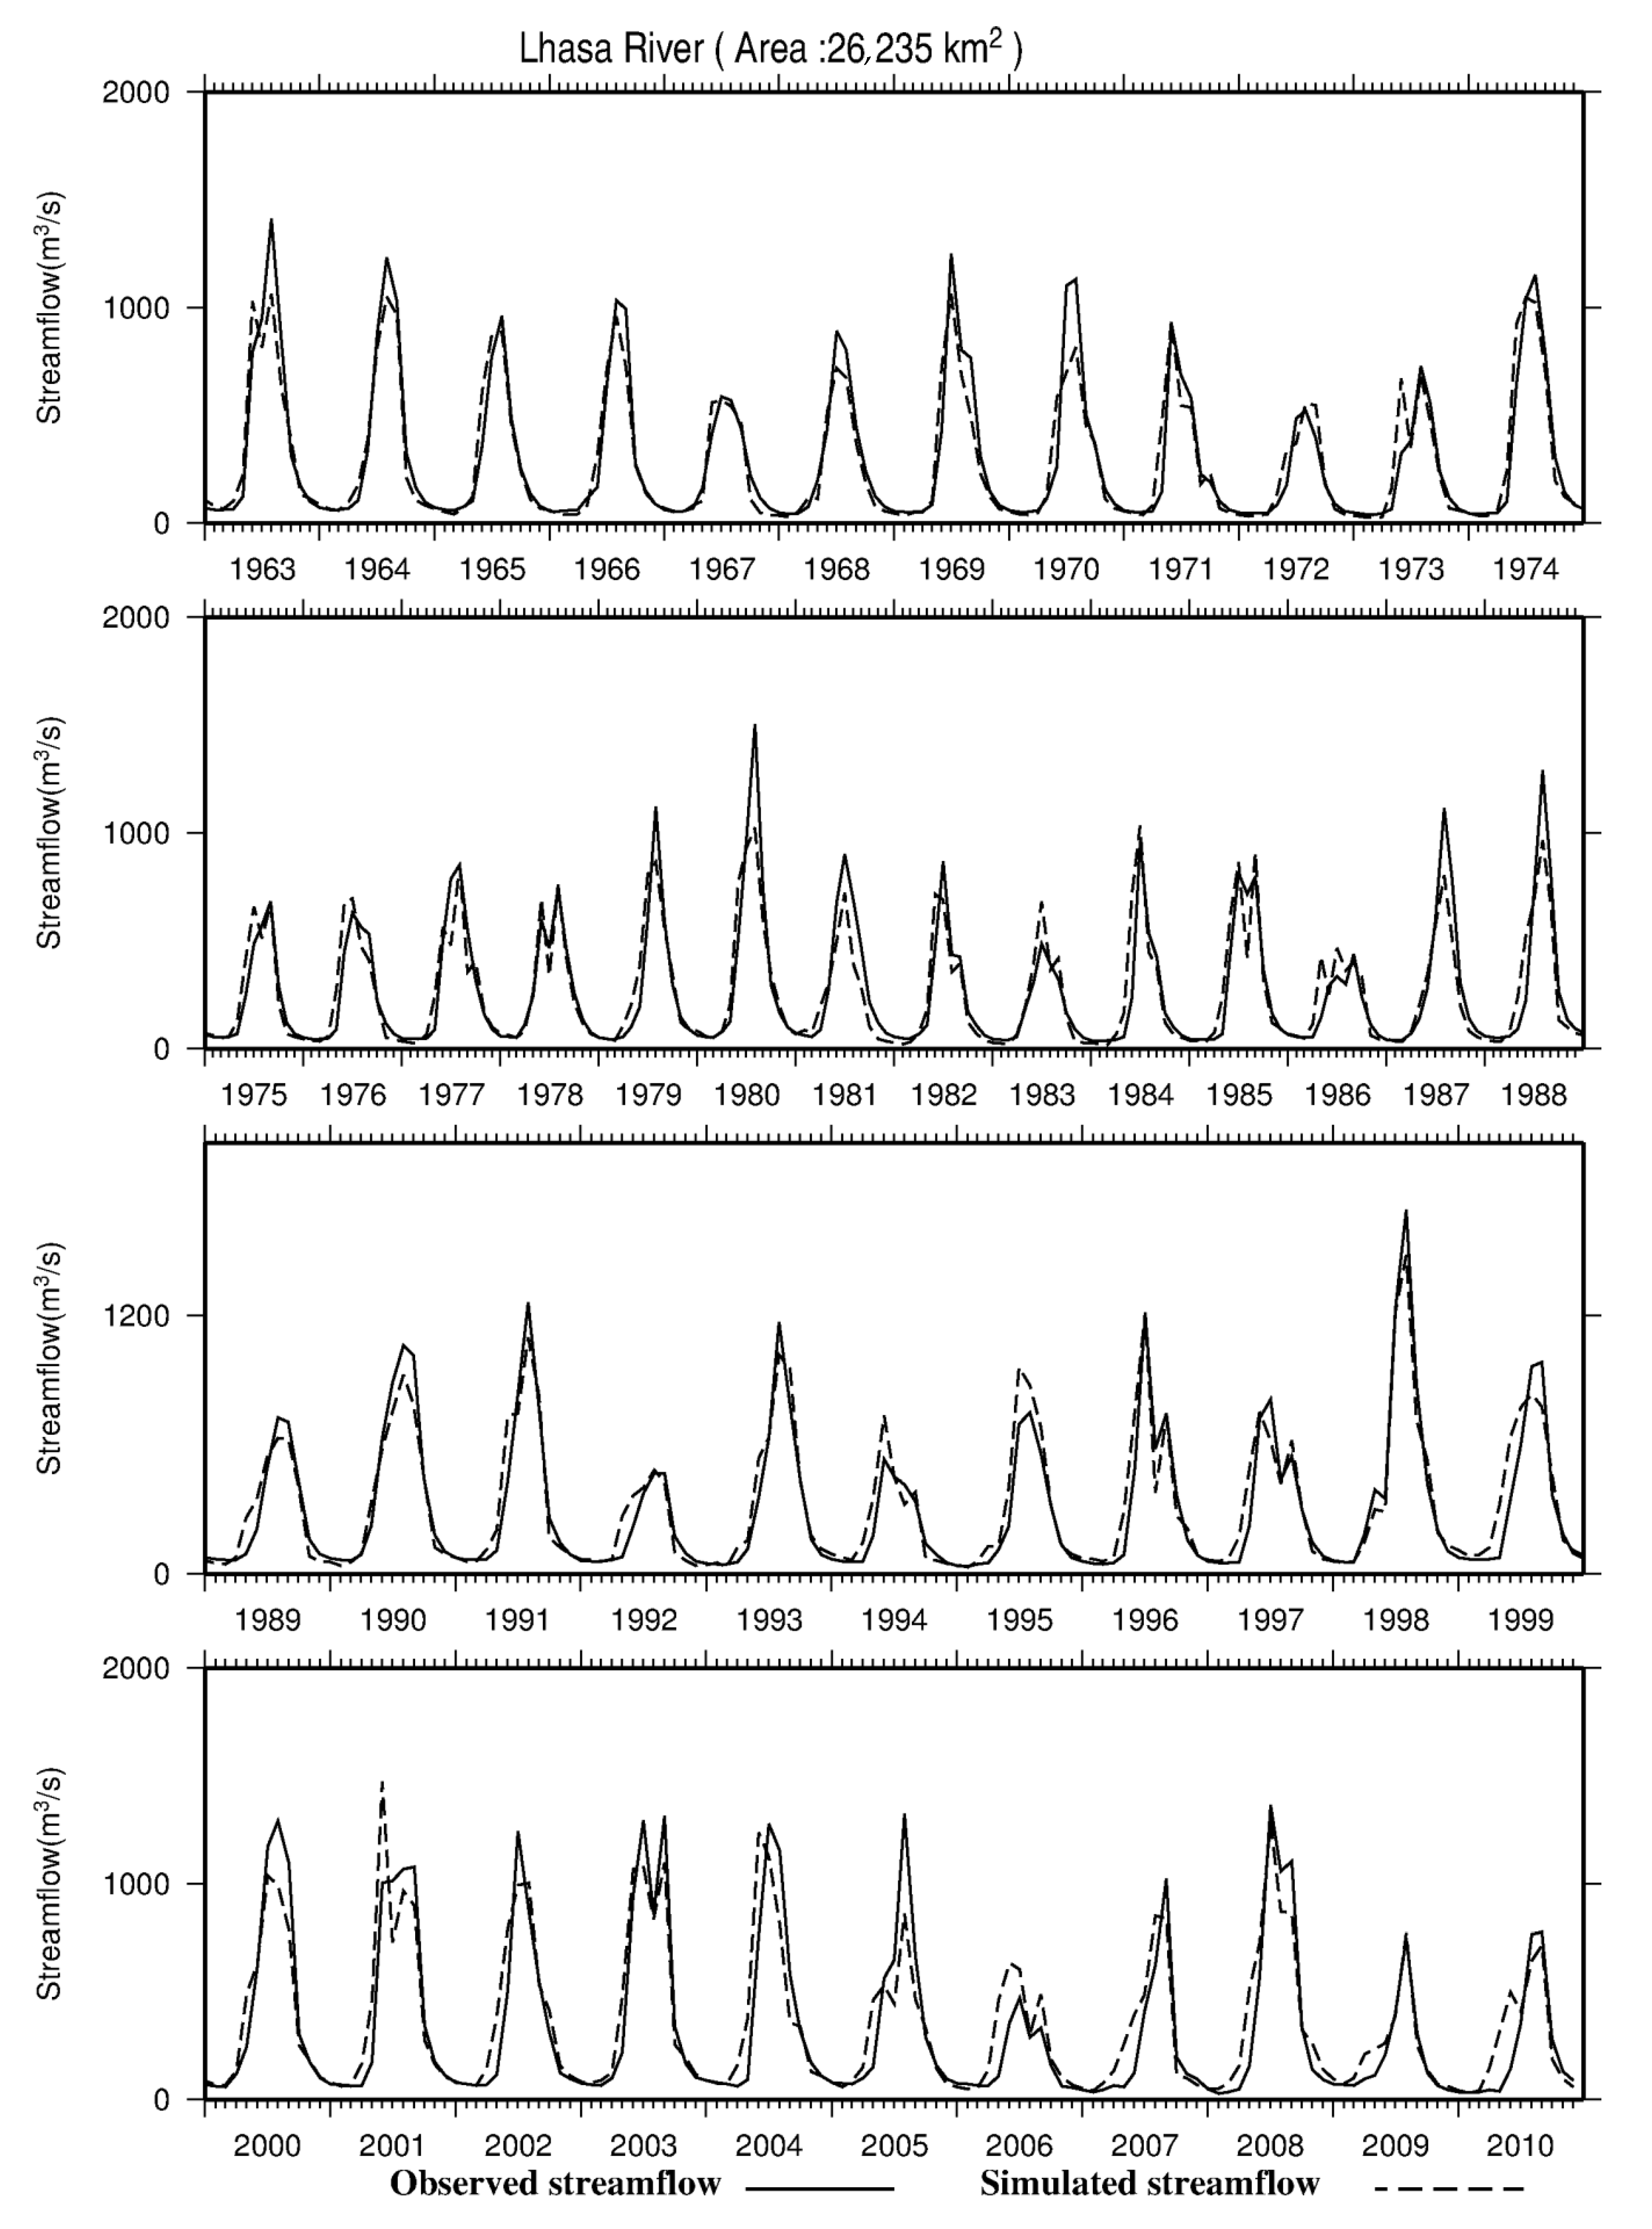
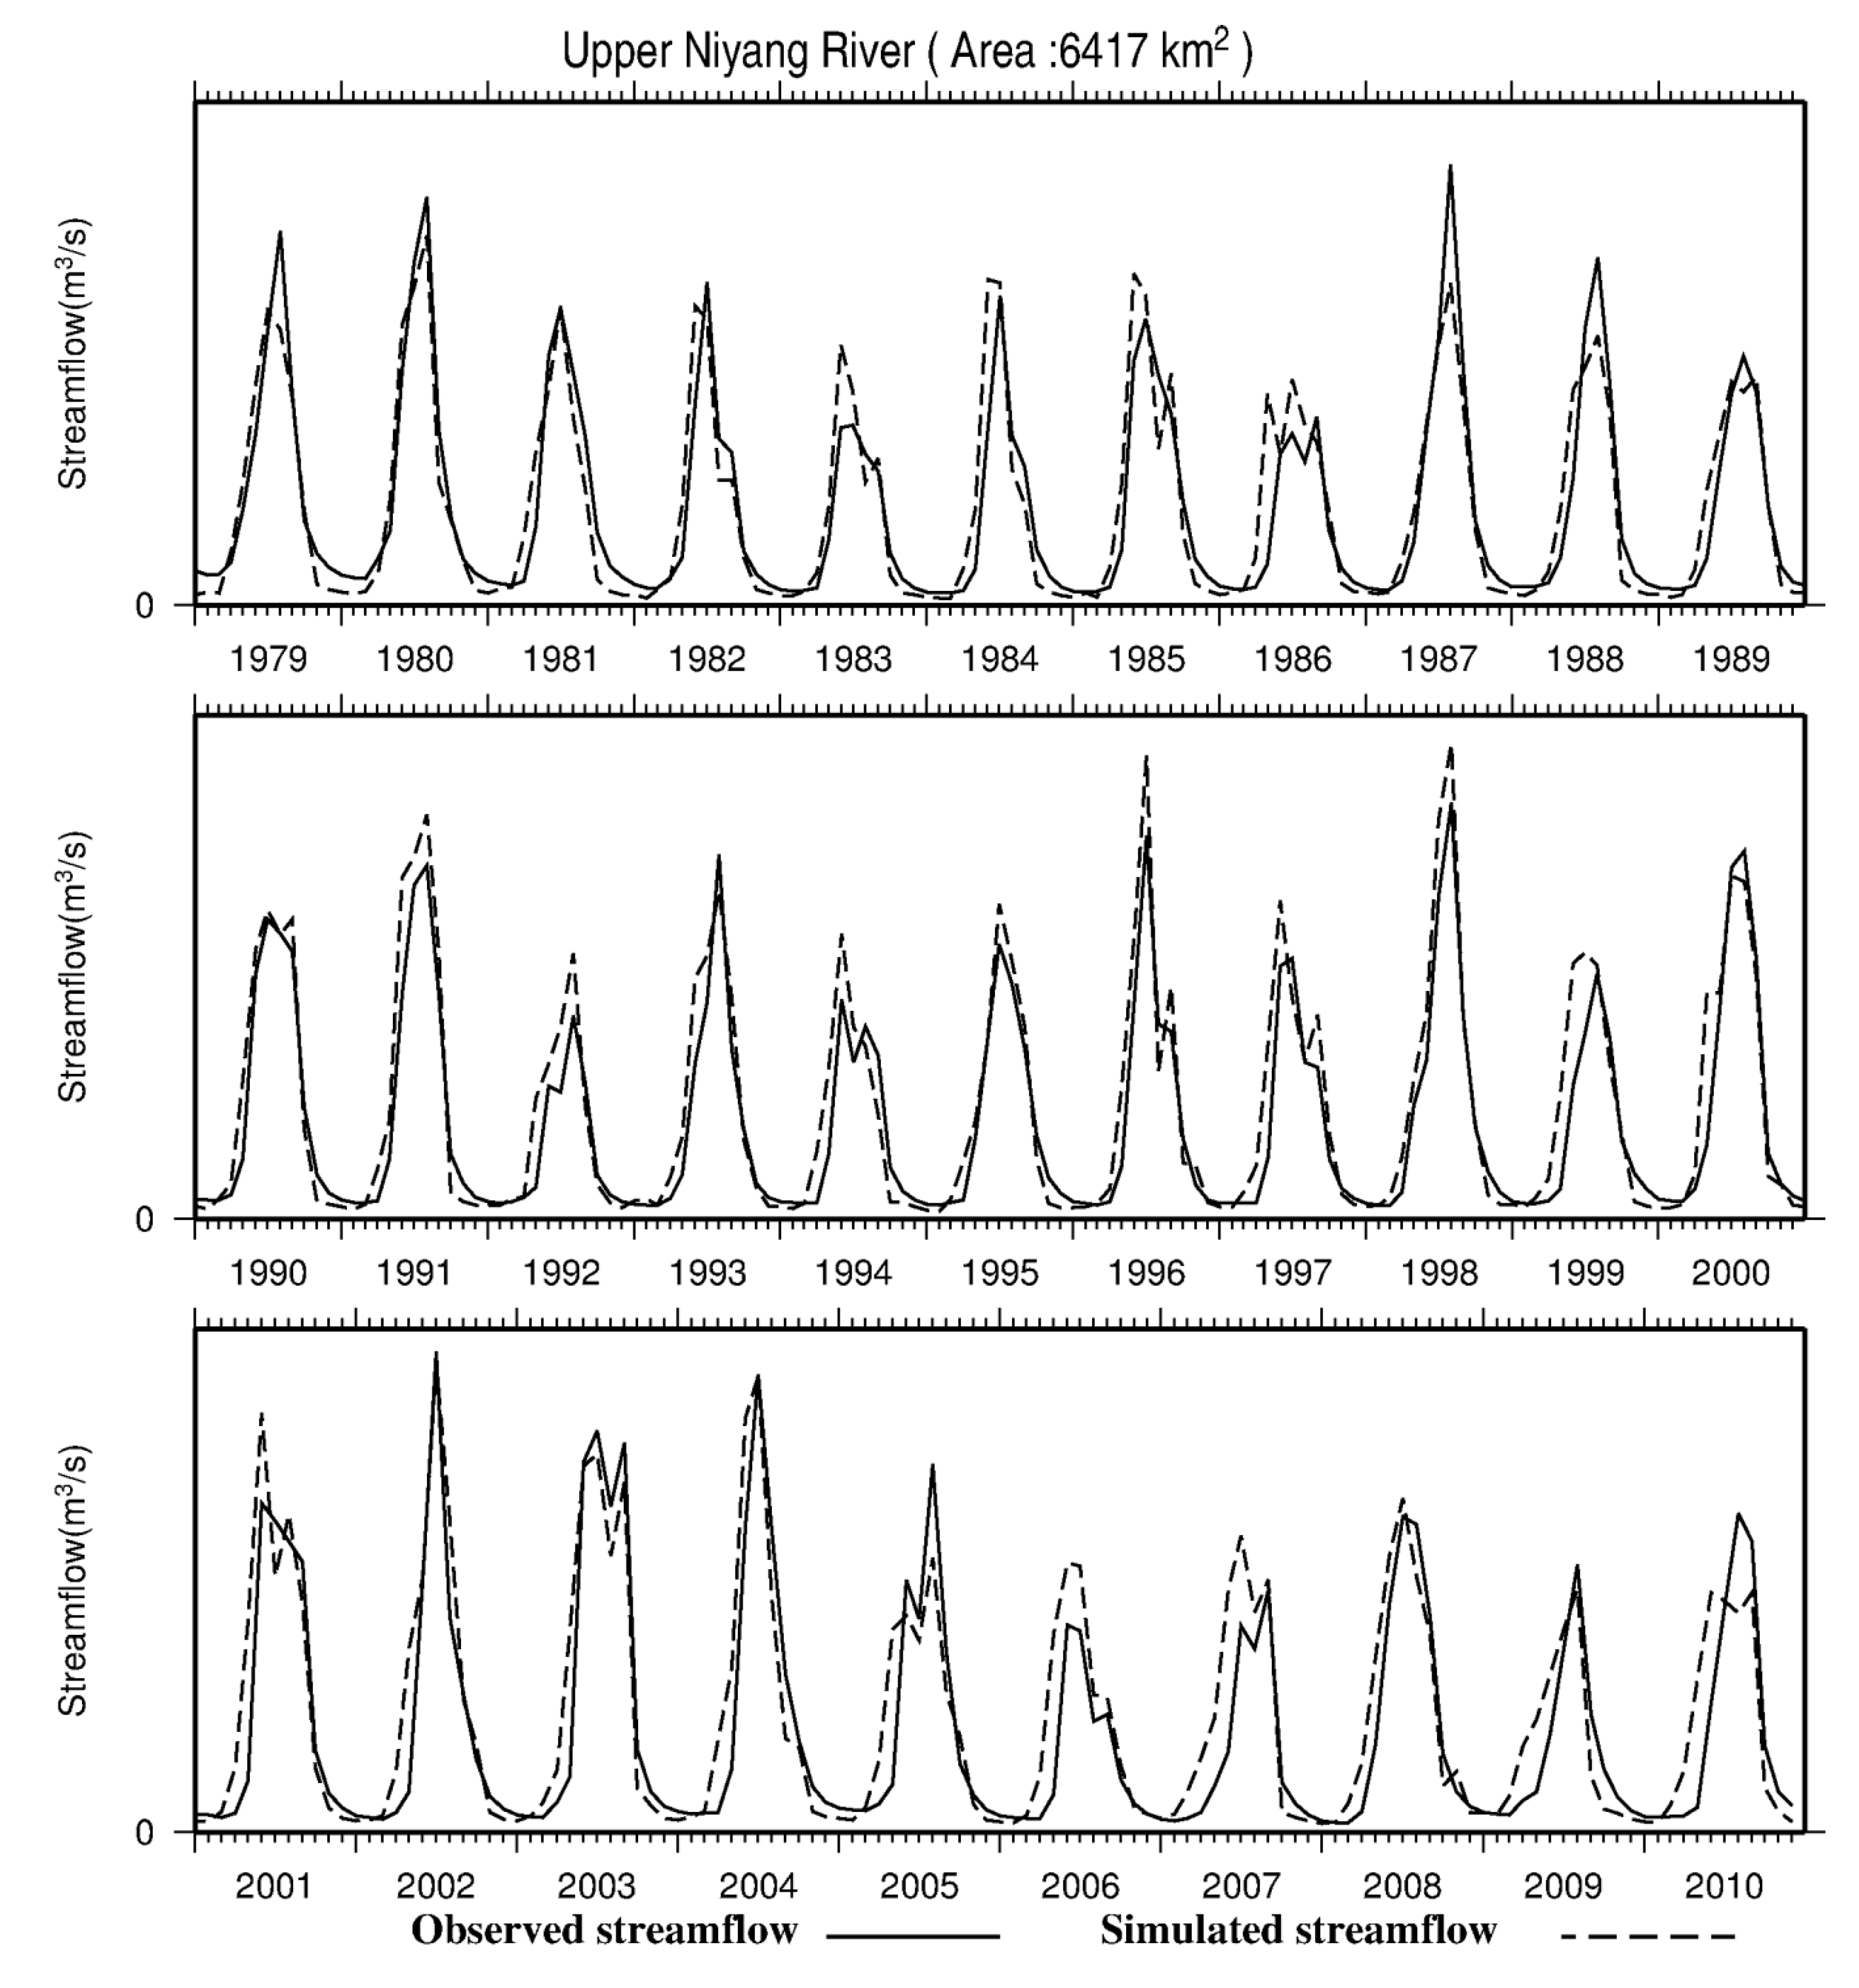
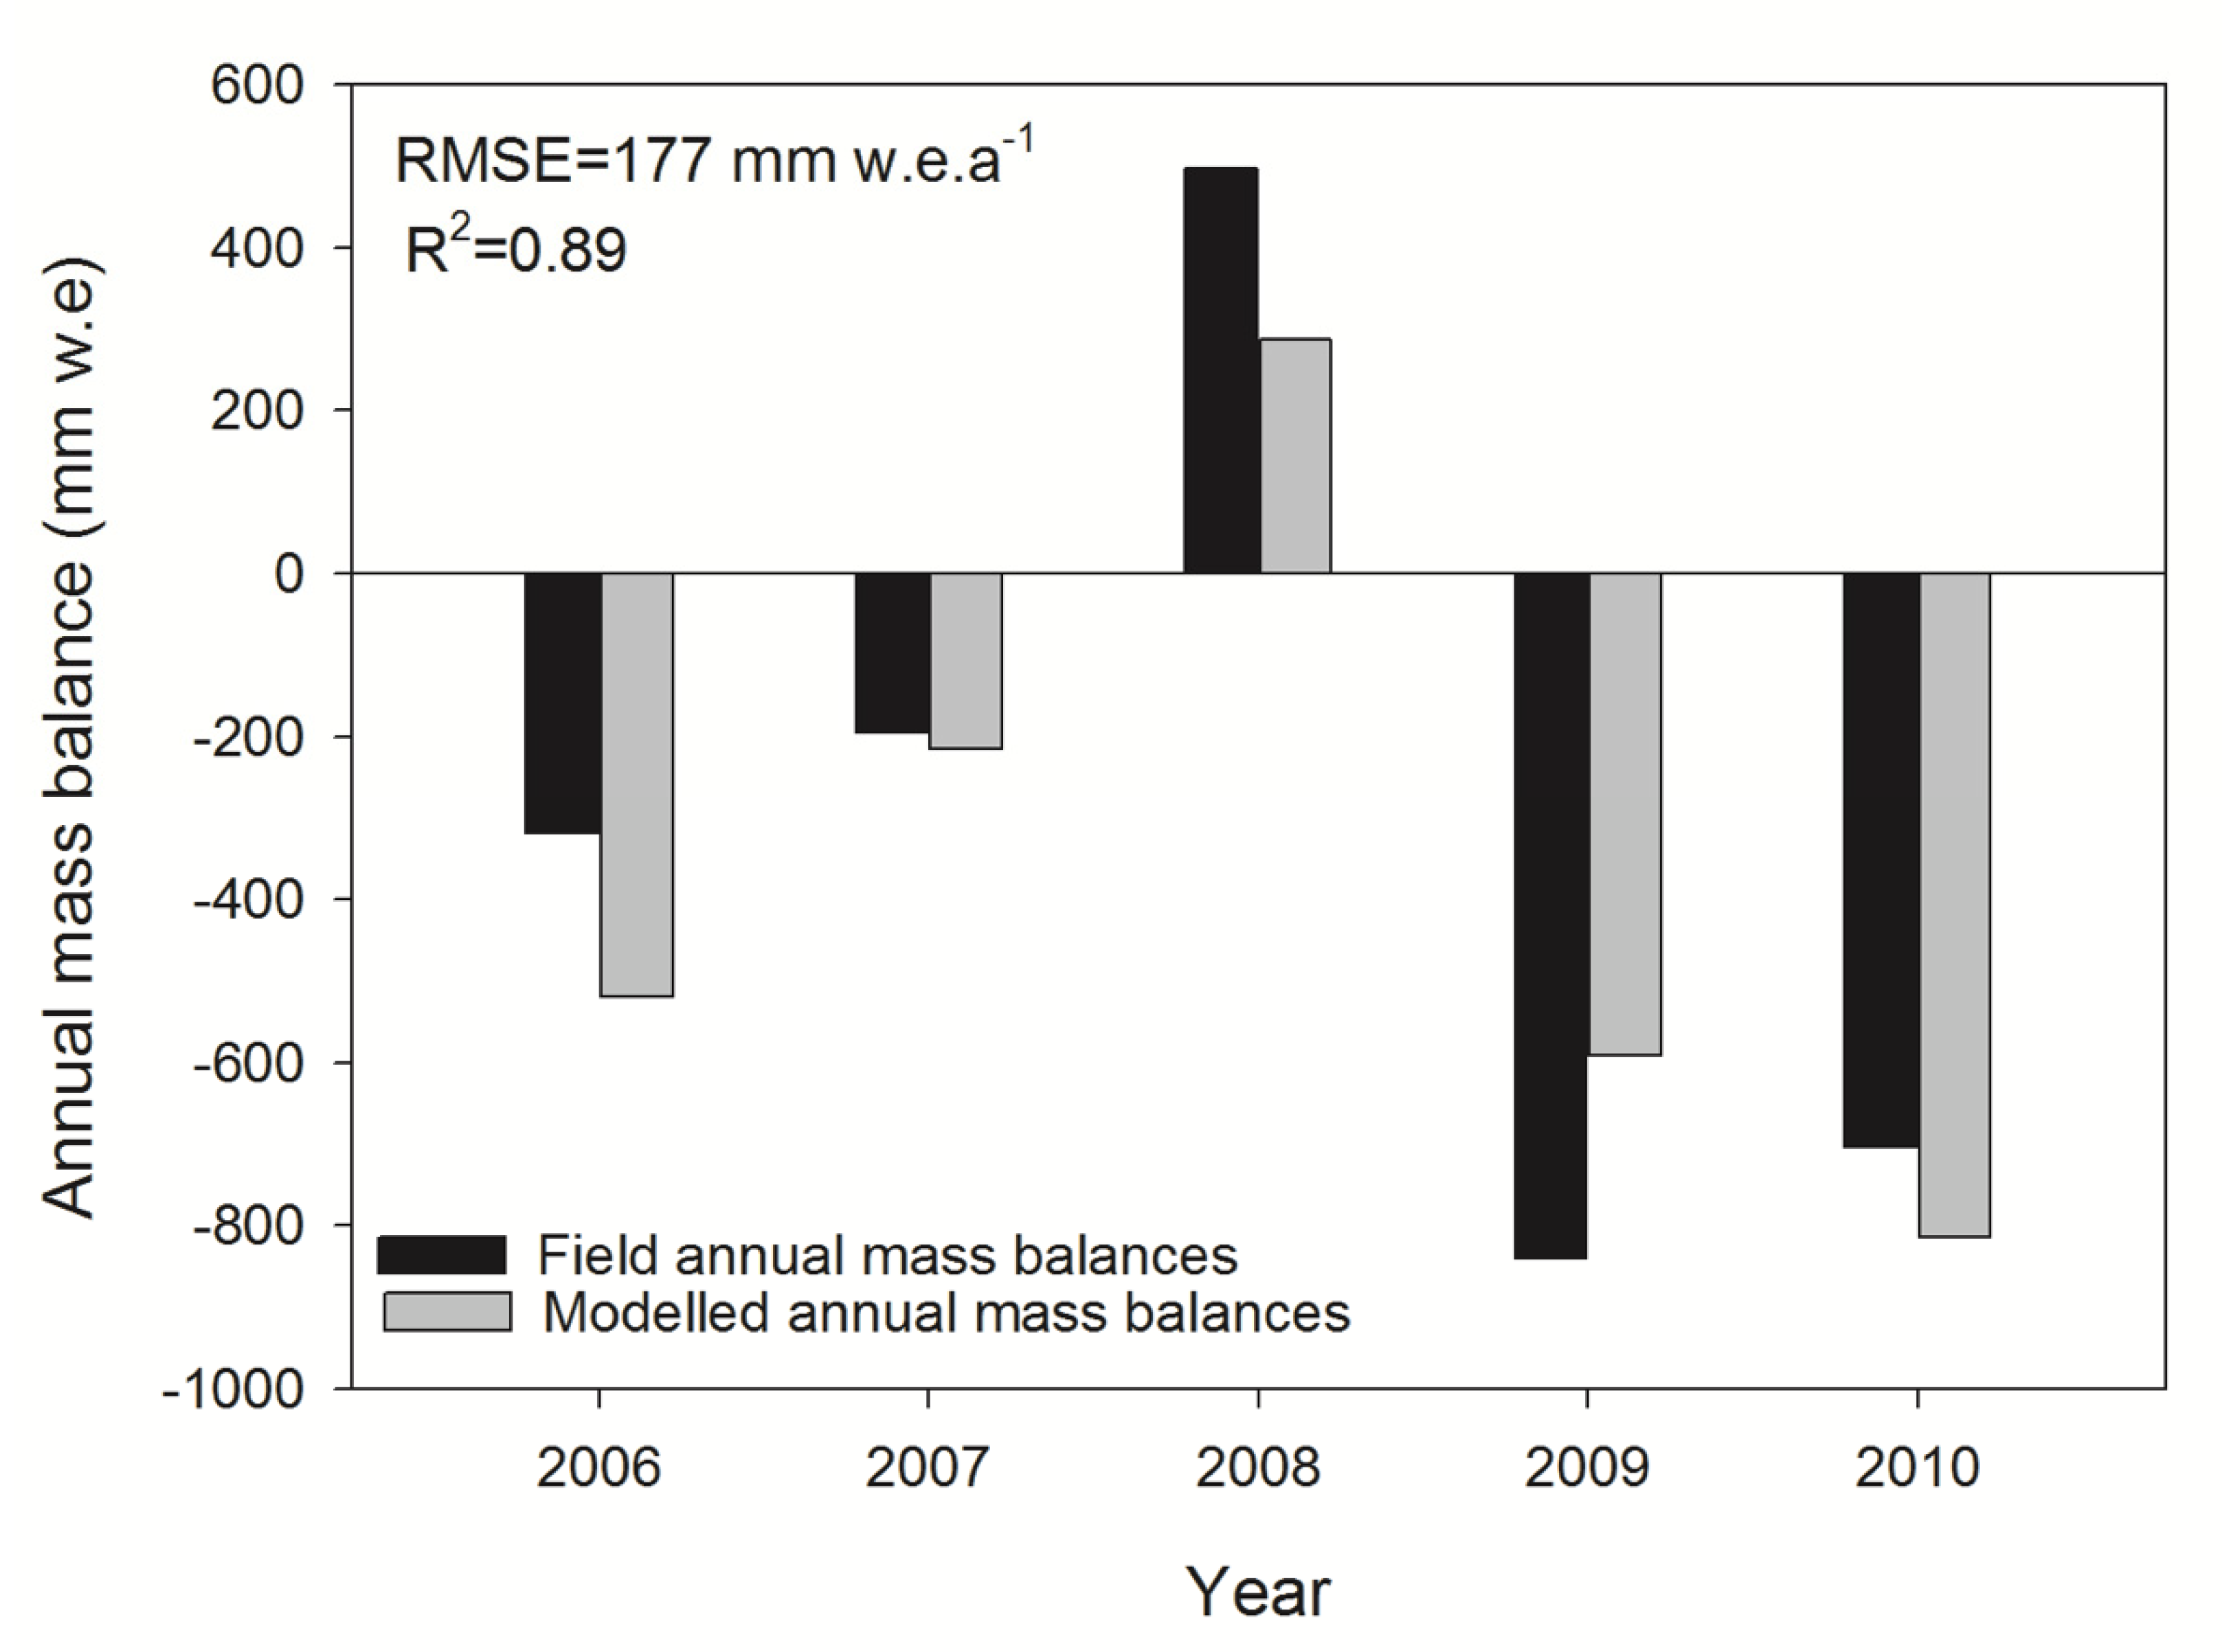
3.1. Model Evaluations

The performance of the VIC glacier model is first evaluated with the observed streamflow. The results of the calibration and validation of the model for the two basins are listed in Table 4. For the two regions, the NSE is more than 0.8 and the absolute PBIAS is less than 7% in both calibration and validation periods, which indicates a high efficiency of this model. Meanwhile, Figure 2 and Figure 3 display the comparisons between the monthly observed and simulated streamflow at the Lhasa (1963–2010) and Gongbujiangda gauges (1979–2010). Generally, this model can satisfactorily reproduce the observed hydrograph in both basins. Furthermore, the simulation can reproduce the observed peak flow, and the base flow in winter is also basically consistent with the observed values, too. In addition, Figure 4 compares the annual model-generated runoff with observed discharge at the two gauges. The inter-annual variability of the runoff is well simulated, and the Pearson correlation coefficient (R) between the simulated and observed annual runoff are above 0.8 for both gauges. Furthermore, the simulated annual series exhibit a similar increasing trend to that of observation at both gauges, indicating the reasonable performance of the VIC glacier model in simulating annual runoff variations in the two basins.
To evaluate the performance of the degree-day model in simulating glacier melt, the calculated variations in annual glacier mass balance are compared with the observations on the Gurenhekou Glacier near the Lhasa River Basin during 2006–2010 (Figure 5). The simulation basically follows the annual variations of the observation, with R2 of 0.89 between the modelled and observed annual mass balances and a calculated RMSE of 177 mm w.e.a−1 for the 5 years. Meanwhile, glacier area changes are also used to assess the performance of this model. The VIC-glacier model simulated glacier area was reduced by 21.6% and 15.3% in LRB and UNRB during 1968–2010, which are generally comparable to the observed declines of 18.5% and 13.1% in the two basins between the First and Second Glacier Inventory. Therefore, the general consistency between the simulated and field observed annual glacier mass balance in the Gurenhekou glacier, together with the comparable glacier area variation between the model’s outcome and observed results, suggests the reasonability of modelling glacier runoff in these regions.
In addition, the simulated mean monthly snow cover extent was compared with the estimates from MODIS in the two focus basins (Figure 6). Although on the whole, the VIC simulated snow cover shows an underestimation compared to the MODIS estimation in all months, from Figure 6, it can be seen that VIC simulation basically captures the seasonal cycles as estimated by satellite remotely sensed data. For instance, both the VIC modelling results and MODIS estimations demonstrate that snow begins to accumulate in late September and lasts until February, and then starts to ablate in late March. In addition, it can be noticed that the difference between the VIC simulated and MODIS estimated monthly snow cover is less than 15% for any month in the two basins. Furthermore, because of complex terrain and sparse meteorological stations in the TP, both MODIS estimation and VIC simulation could include large errors involving snow cover [3,55], which might also affect the evaluation results shown in this study. In general, the snow cover simulation outcomes from the VIC model can basically track the seasonal characters of satellite estimations.
Generally, it can be indicated that the VIC-glacier model is feasible to reproduce the main land surface processes of the focus basins, based on the above evaluations of river flow simulation, the changes in glacier area and mass balance, and seasonal snow cover.

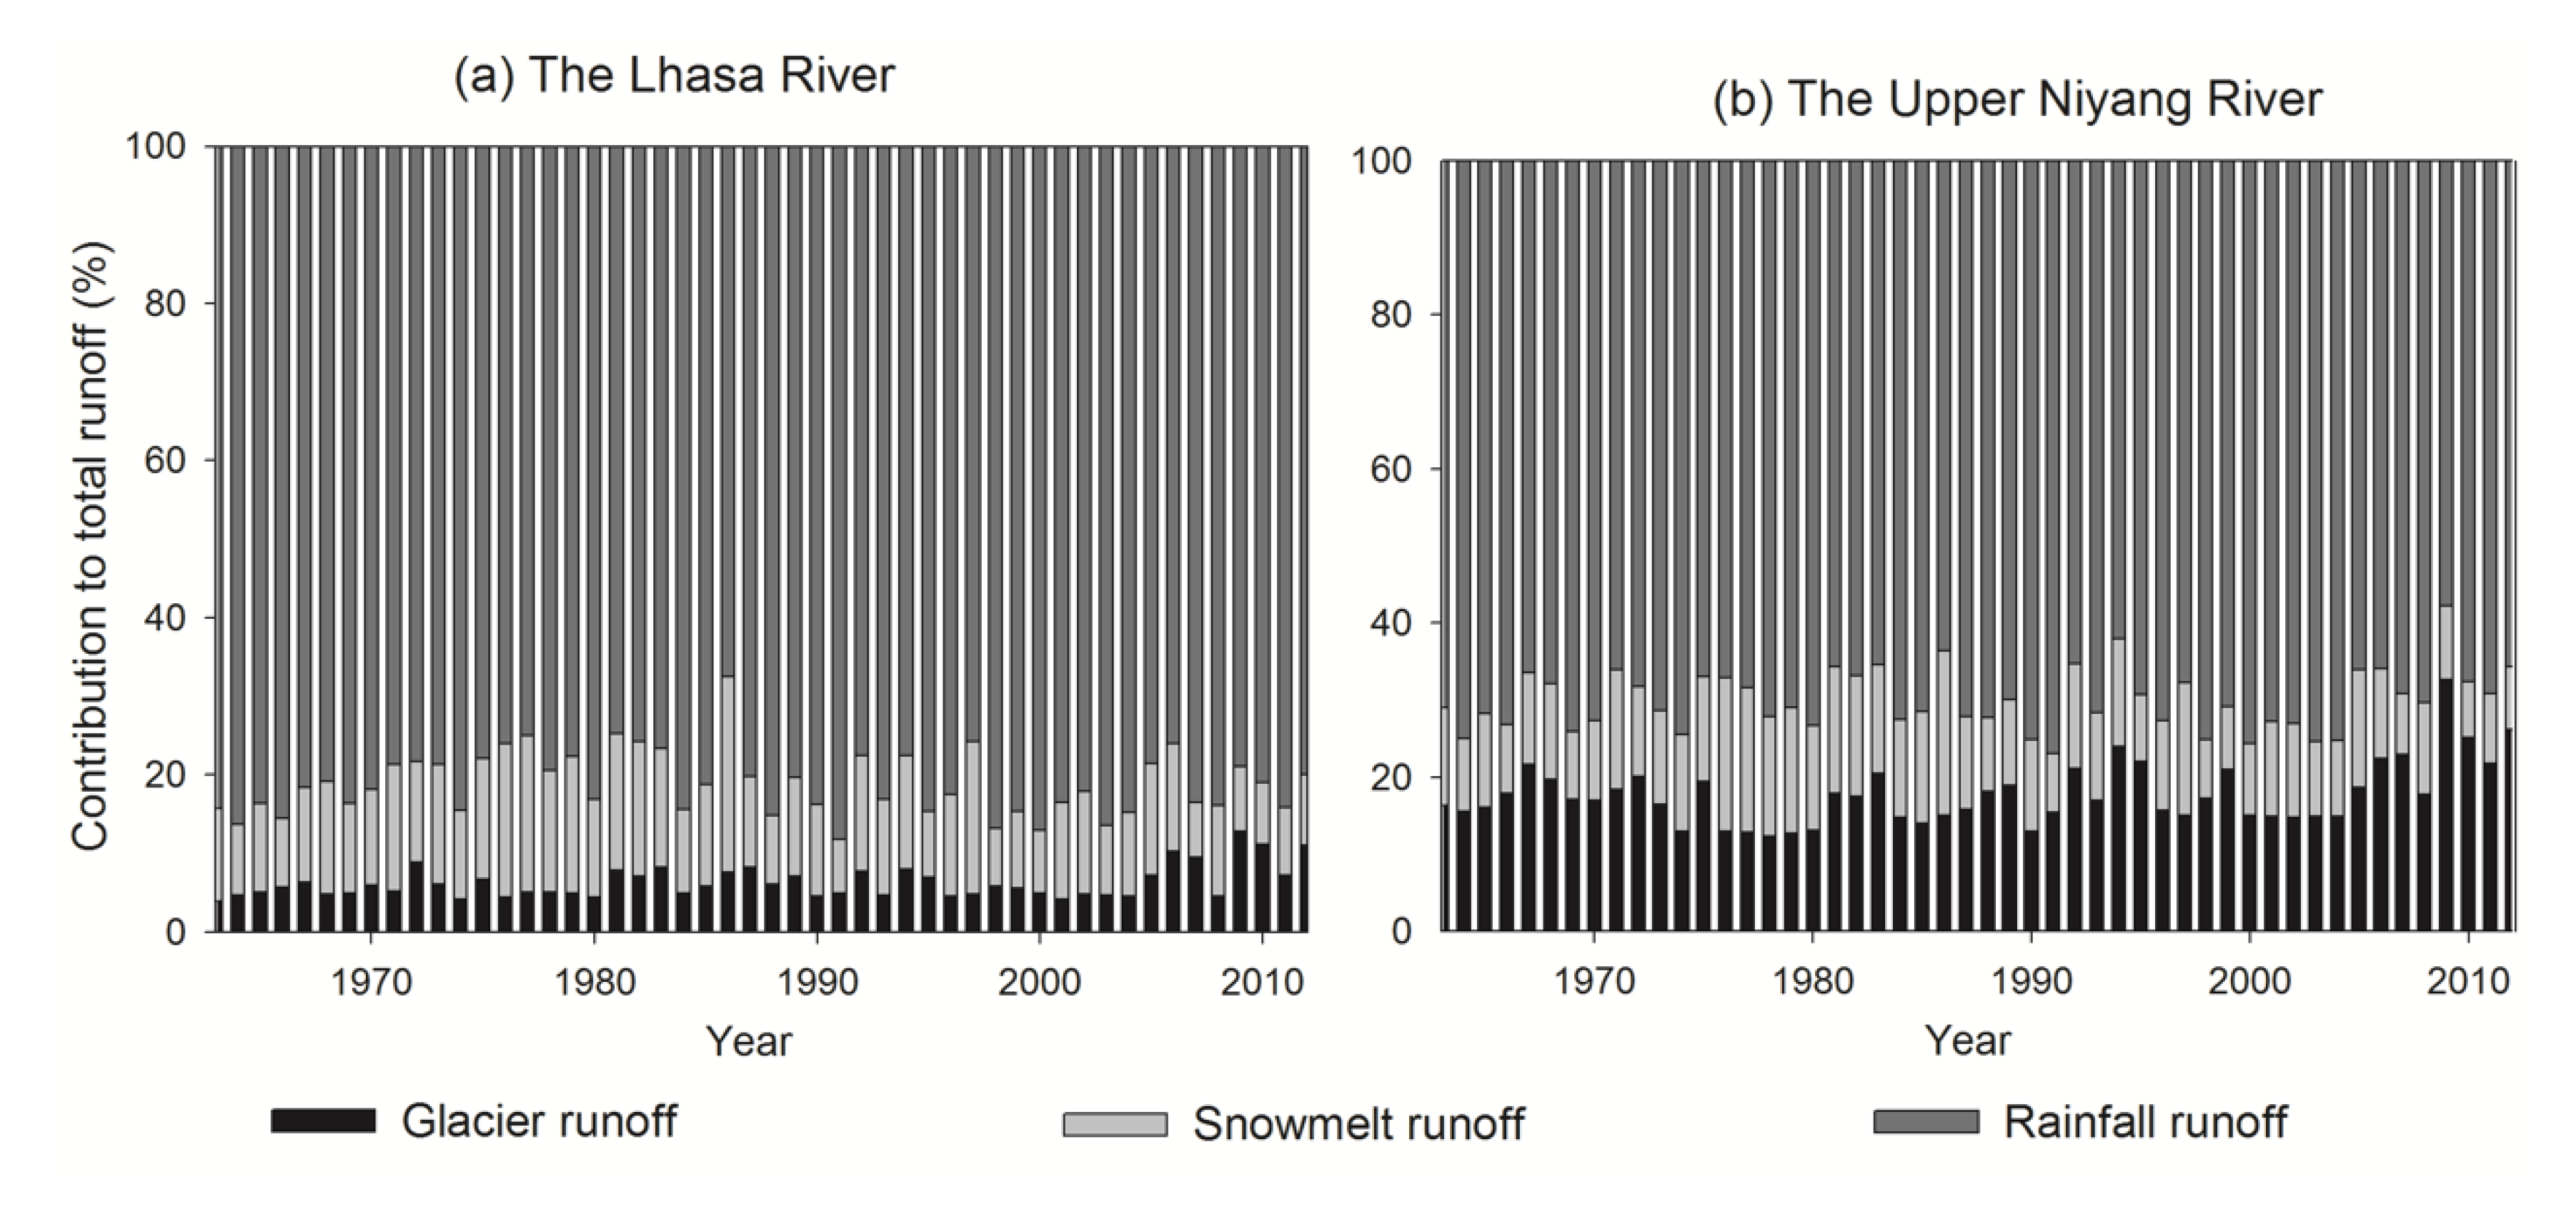
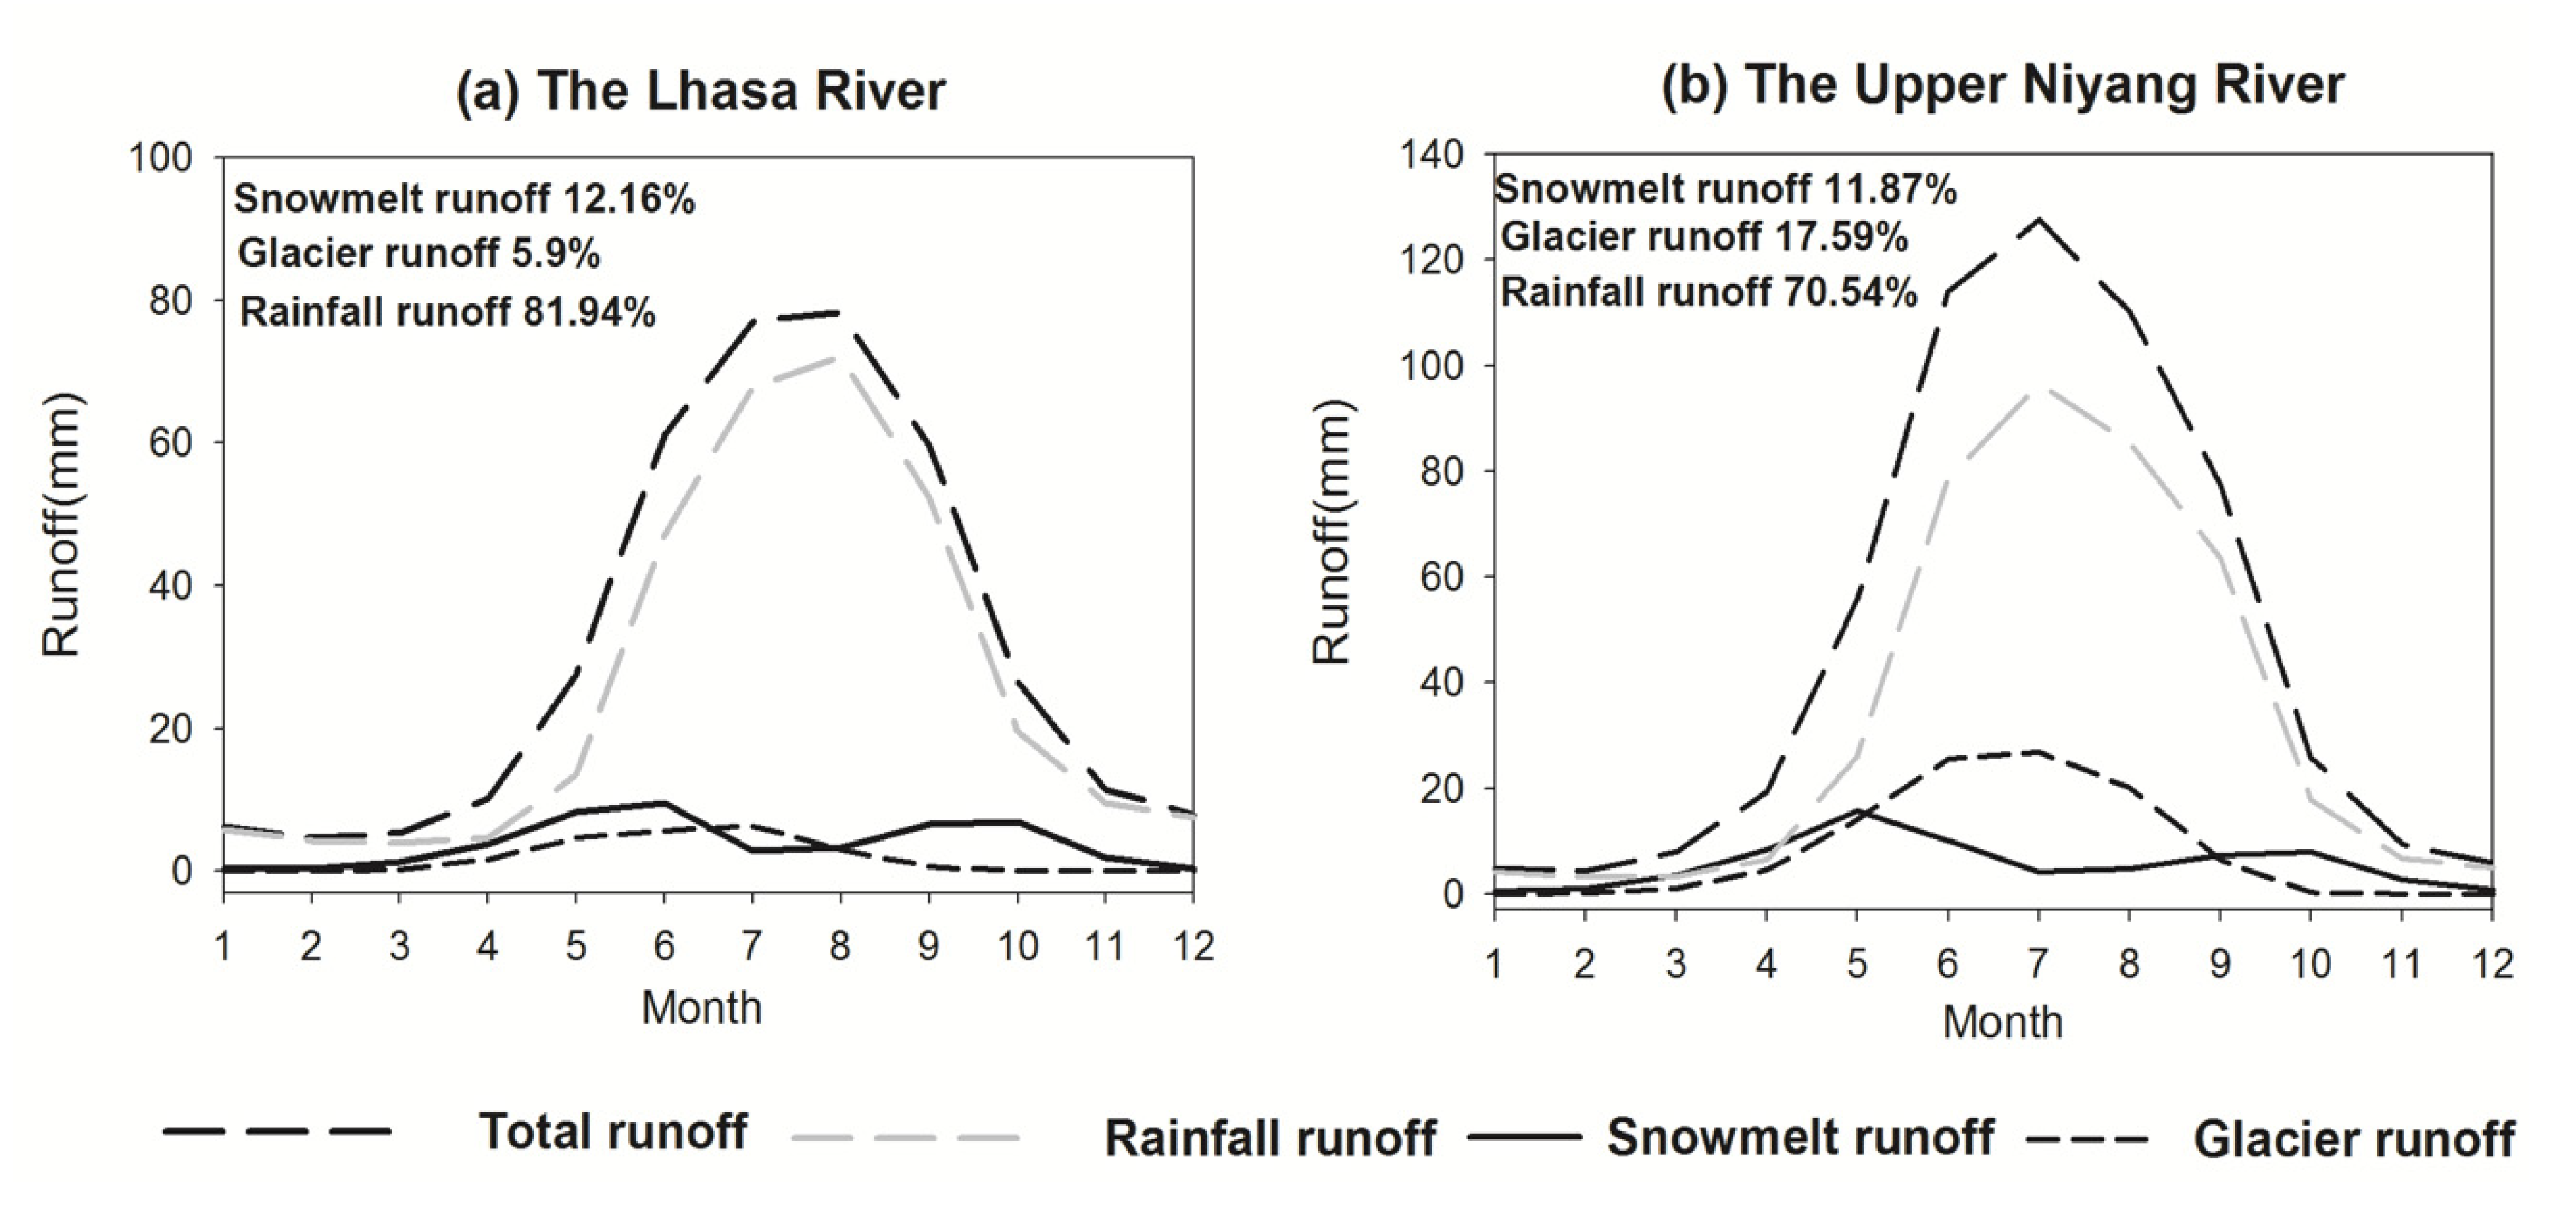
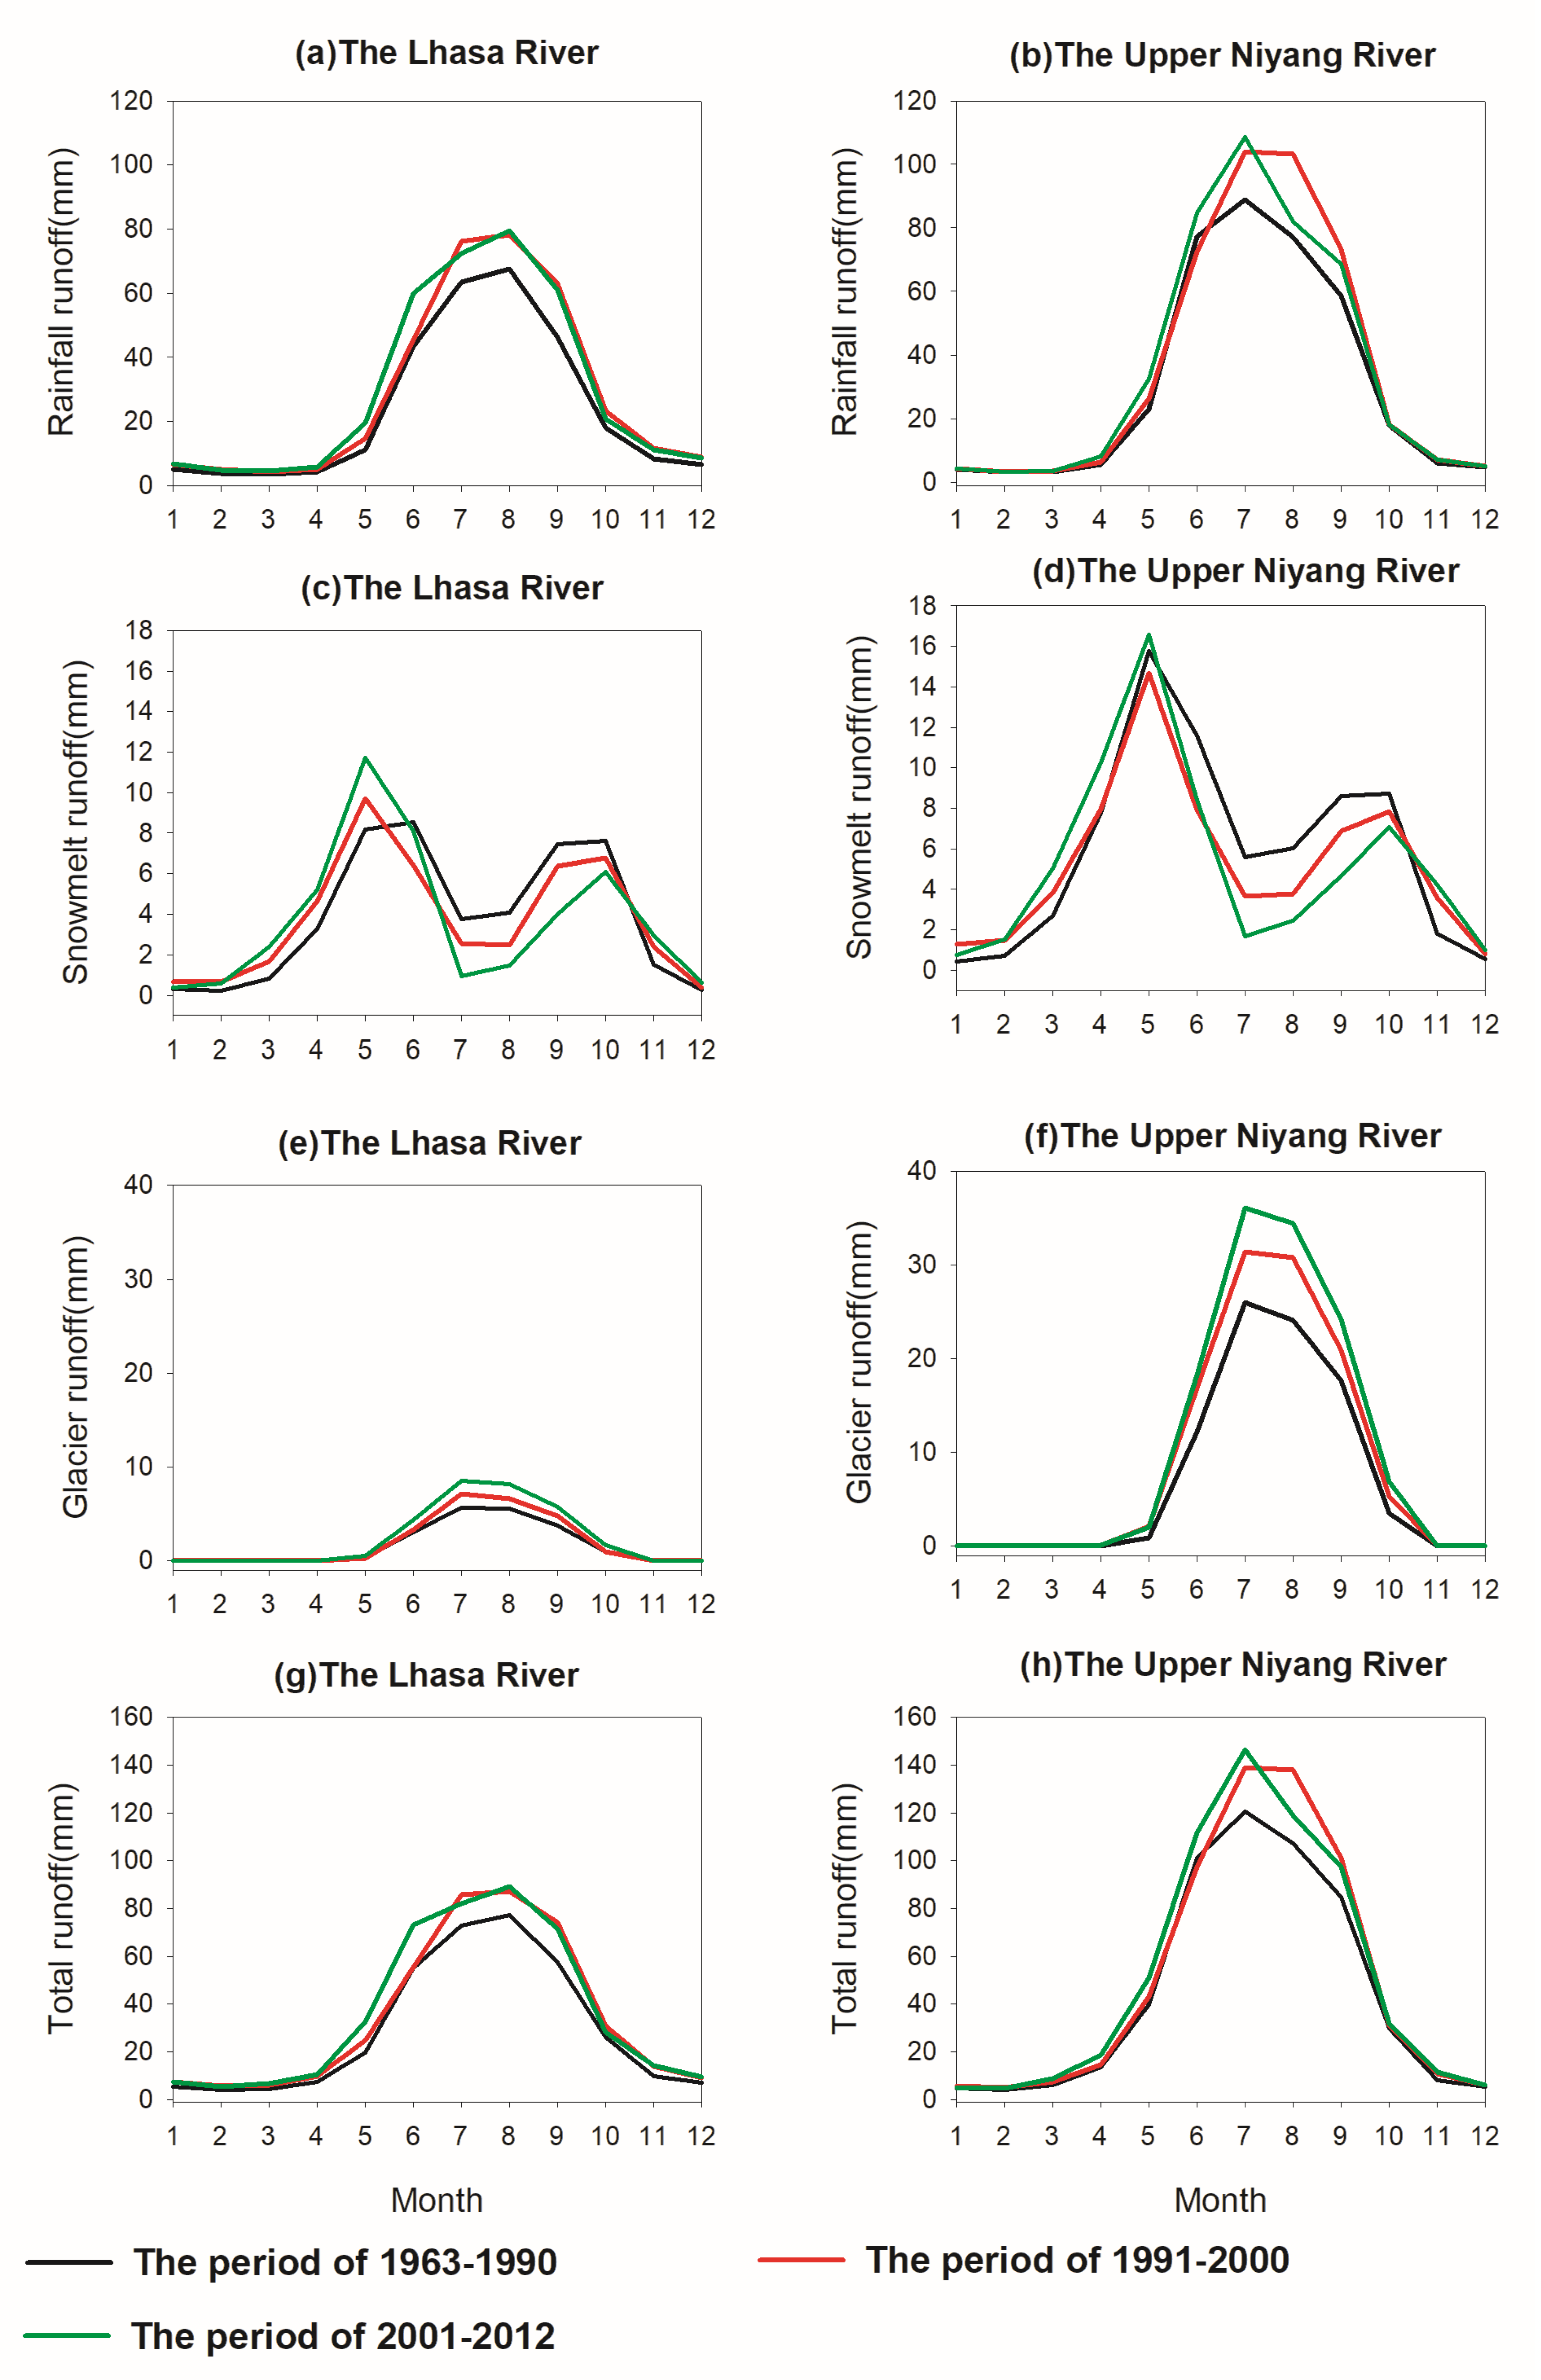
3.2. Components and Characteristics of Streamflow

Based on the VIC-glacier model simulations in the LRB and UNRB, we quantified the contribution of three runoff components (rainfall runoff, snowmelt runoff, and glacier runoff) to total runoff and simultaneously analyzed their seasonal characteristics (Figure 7 and Figure 8). It is worth noting that the glacier runoff includes both the runoff from melting ice and snowmelt water from ablating snowpack in the glacier.
Figure 7a,b display the simulated annual percent contributions of three runoff components to total runoff in the two basins during 1963–2012. The contribution of glacier runoff in the LRB ranges from 3.9% to 12.8% with an average of 5.9% to the total runoff while it varies between 12.2% and 32.7% and has a mean value of 17.59% in the UNRB in the past fifty years. This also suggests that the contribution of glacier runoff to total runoff in UNRB is larger than that in LRB. Meanwhile, for both basins, the glacier runoff mostly occurs in June to September with peak in July, consistent with the high temperature months (Figure 8a,b).
The snowmelt runoff contributes about 7–18% to the total runoff with mean of 12.16% in the LRB, and in the UNYB, its average contribution is 11.87% and also fluctuates among 7.2% to 21.3% for 1963–2012. Snowmelt runoff during March to June is from ablating the accumulated snowpack in the last winter and the snowfall in spring and early summer. Snowmelt runoff in spring is very important to local agriculture irrigation during this period and could also efficiently ease the water shortage in drought years. Meanwhile, it can be noticed that there is some snowmelt runoff in September and October. This snowmelt runoff in autumn is likely due to fresh snowfall during this period, which just covers the ground for a few days and then melts quickly. This phenomenon can also be found in other basins located in the Tibetan Plateau [30].
With regard to rainfall runoff, its contribution to the total runoff also exhibits quite a big fluctuation in both basins, ranging from 67% to 88% in LRB and varying among 57% to 77% in the UNRB, respectively. Simultaneously, the mean contribution from rainfall runoff to total runoff is 81.94% and 70.54% for the LRB and UNRB, which suggests that rainfall runoff is the dominant water resource in these basins. In addition, the seasonal pattern of rainfall runoff is similar to that of total runoff (Figure 8a,b), mostly occurring in June to September, which hints that monsoon precipitation plays a substantial role in runoff generation in the two areas.

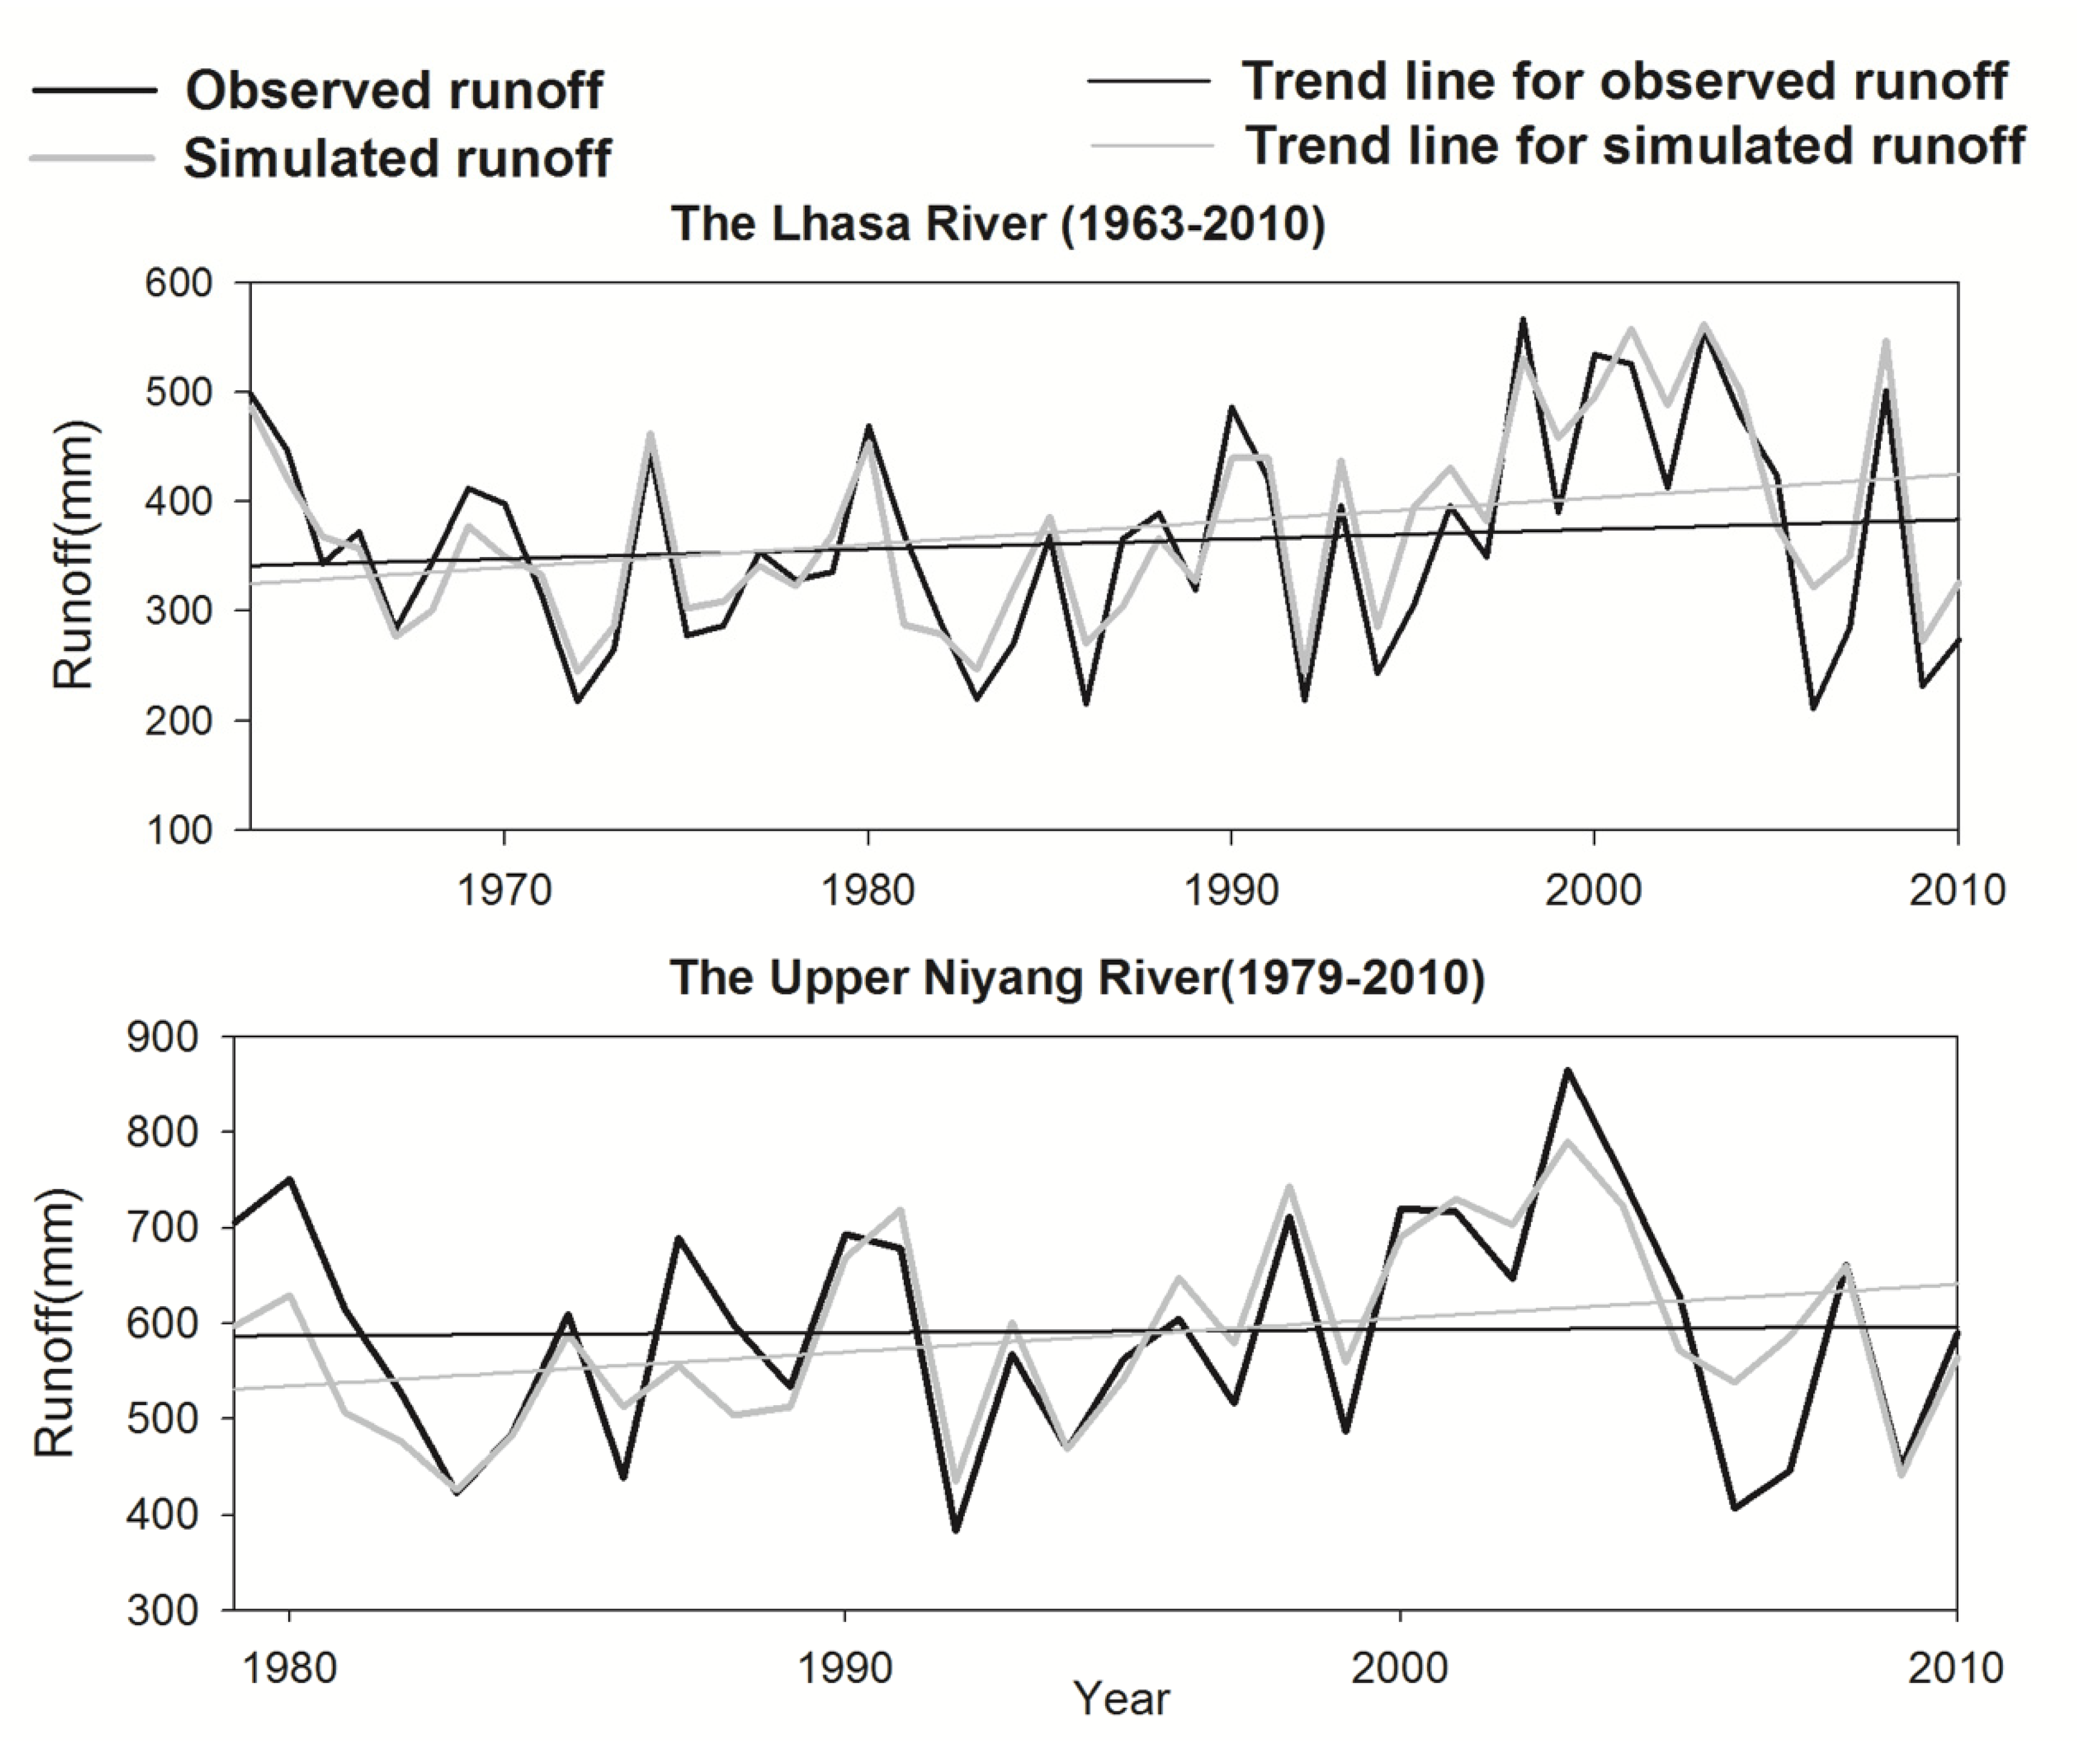
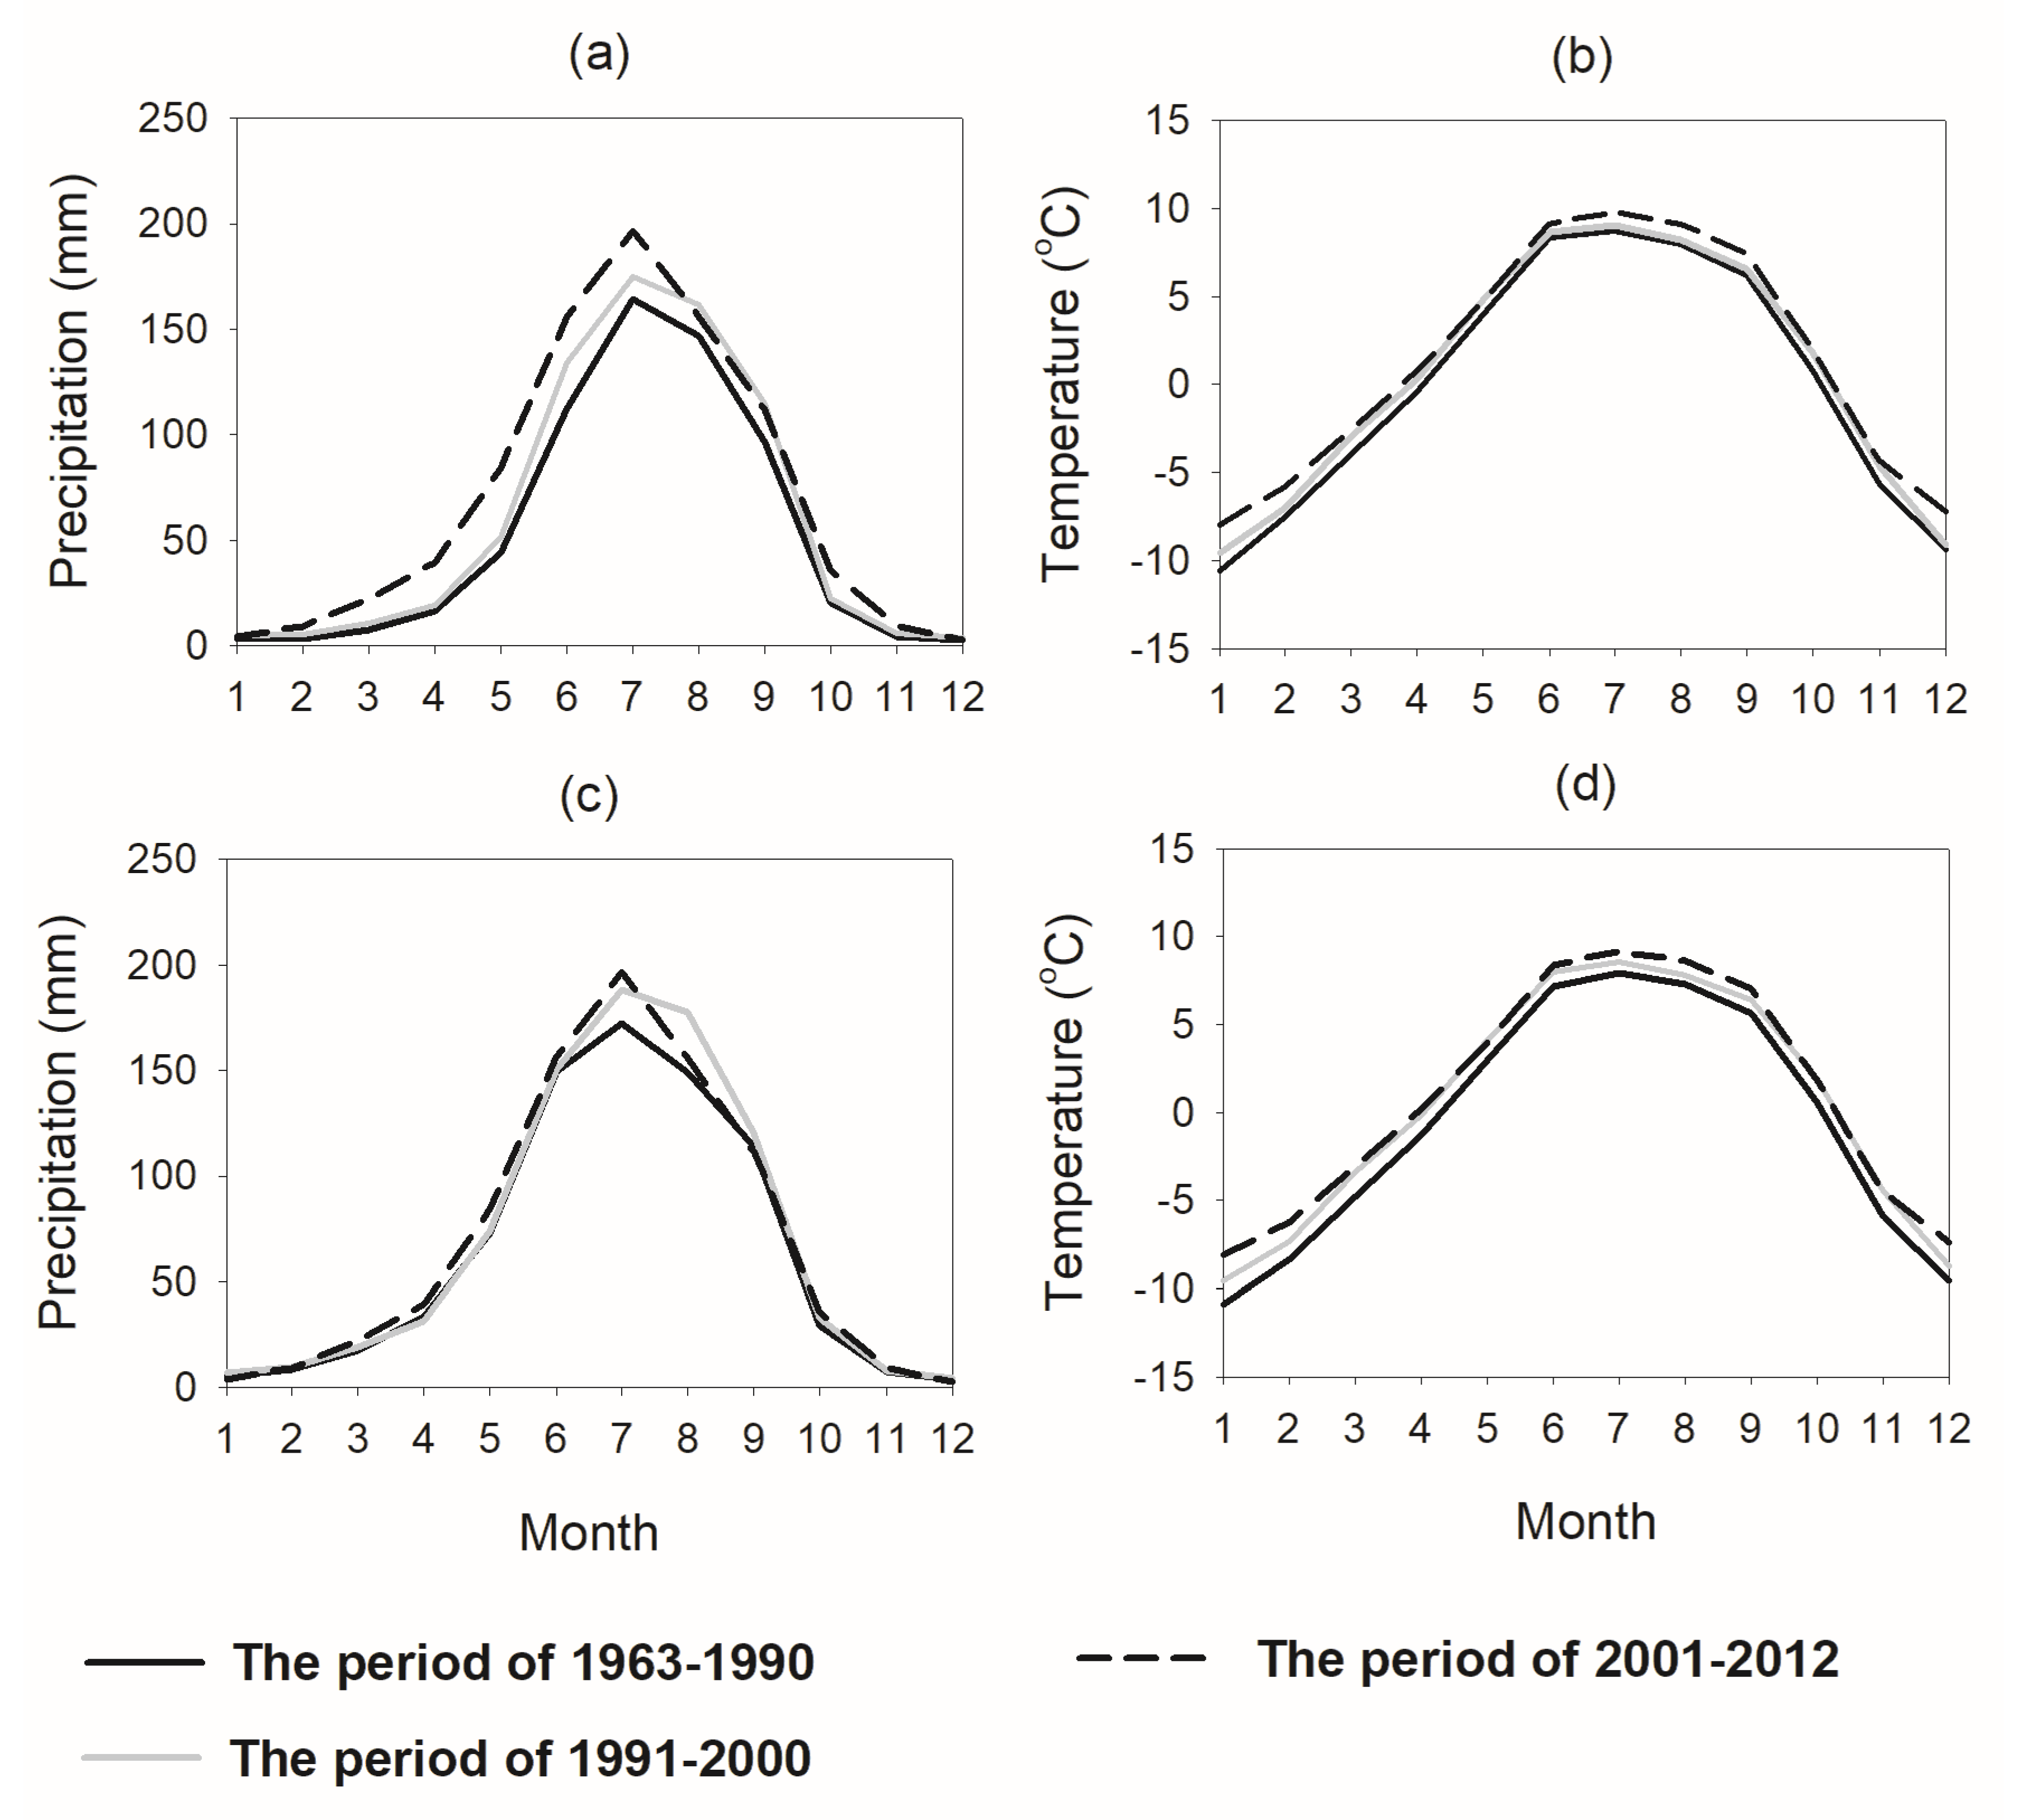
3.3. Variation of Runoff Components under Current Climate Change

During 1963–2012, annual mean temperature exhibits a significant upward trend for both basins (α > 0.05). Meanwhile, there is also an overall increasing trend in yearly precipitation over the two areas, though not significant. To further evaluate the changes in meteorological variables during different decades, we separated the past 50 years into three periods, i.e., the baseline period (1963–1990), the 1990s (1991–2000), and the 2000s (2001–2012). Figure 9 displays mean monthly temperature and precipitation for the three periods. Under this warming climate, the basin hydrological regime could experience some changes, and may result in variation of runoff components.
The linear trends for yearly simulated rainfall runoff, snowmelt, glacier runoff, and total runoff for 1963–2012 are presented in Table 5. Generally in both basins, the rainfall runoff, glacier runoff, and total runoff show increasing trends, while there is a decreasing tendency in snowmelt runoff. The simulated snowmelt runoff exhibits a generally decreasing trend over the past 50 years. This may be caused by the decrease of snow cover owing to a warm climate. With the temperature rise, the snowfall gradually decreases, making the snowmelt runoff show a downward trend. In addition, the MK method was employed to test the significance of variation in runoff at a confidence level of 0.05. The results suggest that for both regions, the increasing trend in glacier runoff is significant under a warming climate. Meanwhile, total runoff in the upper Niyang River Basin also shows a significant increase during 1963–2012. The following parts describe in detail variations of three runoff components during the 1990s and 2000s, relative to that of the baseline period (also named the reference period).
The mean monthly simulated rainfall runoff in the three periods are presented in Figure 10a,b. In the LRB, compared to the baseline period, there are large increments among July to September in the 1990s, while in the 2000s, the months from May to September witness a moderate increase. The statistical results also show that the average annual rainfall runoff in the two decades exhibits a growth of 21.6% and 25.9% relative to the baseline period, respectively. In the upper Niyang River Basin, a significant increase during July to September can be noticed in both the 1990s and the 2000s relative to the baseline period; meanwhile, the annual mean runoff in the two terms experienced an increment of 15.5% and 15.1%, respectively, in comparison to that of the baseline period.
Figure 10c,d show mean monthly snowmelt runoff for three periods over two regions. Generally, spring snow was seen to have melted earlier in the 1990s and 2000s than that in the baseline period for both LRB and UNRB. In the LRB, there is more snowmelt runoff during March to May, especially in the 2000s, compared to the baseline period. One plausible explanation for this phenomenon is that spring precipitation exhibits a rise in the two periods, particularly a large increase in the 2000s relative to the baseline period (Figure 9a). Some of the precipitation falls as snow during the warm spring season and this snow is then melted almost immediately to contribute to more snowmelt runoff. In other regions, such as the source region of the Ganges River, the Yarkant River, and the Yellow River, there is snow fall even in spring and early summer [55,56,57]. Although some increases can be observed in spring months, however, almost all of the other months witnessed a decrease in the 1990s and the 2000s. Therefore, the average annual snowmelt runoff decreases under the current climate change with reduction of about 2.8% and 3.7% in the 1990s and 2000s relative to the baseline period, respectively. In addition, the timing of peak runoff changes from June in the baseline period to May in the 1990s and 2000s over the LRB, due to large changes in snowmelt during spring months in the LRB (Figure 10c). In the UNRB, snowmelt runoff in February to April indicates a slight increase, while decrease can be noted in other remaining months during 1990s in comparison to the reference period. For the 2000s, small increases can be detected during March to May while other months show a decline. Generally, a reduction in annual mean snowmelt runoff by about 9.4% is observed during both periods relative to the baseline period. Figure 10c,d shows a little snowmelt runoff during winter in both regions. The TP has experienced surface air warming since the beginning of the 1980s [58] and the warming rate increased from 3000 to 4800 m a.s.l [59]. Meanwhile, as can be noticed from Figure 9b,d, the warming magnitude in winter is the largest in comparison with other seasons. Therefore, this snowmelt water may come from areas with lower elevations (around 3000 m a.s.l) in the basin, where the temperature on certain days in winter may be around zero degree Celsius. When the daily temperature during certain days exceeds zero degree Celsius, the snow melts and generates snowmelt runoff. There is also snowmelt runoff during winter in other TP basins, such as the upper Brahmaputra River Basin [42] and the upper Yarkant River [56]. There is little change for snow melt runoff during the 1990s and the 2000s in comparison to the baseline period over both basins.
With respect to glacier runoff, a significant increase can be observed among July to August during 1990s and 2000s relative to the baseline period in both two basins (Figure 10e,f). Along with the continuous warming climate, more and more melt water from the iceberg has been released to river runoff. Therefore, the magnitude of increase in glacier runoff has also been gradually ascending over the years. In comparison to the baseline period, glacier runoff in LRB increases by 17% in 1990s followed by a rapid large increment of 45% during the 2000s. Similarly, an increase in UNRB by 27% is observed from the baseline period to the 1990s, followed by the 2000s with an increasing magnitude up to 44.7%. The massive increments in 2000s for both basins may be due to the rapid warming temperature during this period (Figure 9b,d). Compared to the baseline period, the average yearly temperature in the 2000s increased by about one degree Celsius over the two basins, which can significantly accelerate melting ice in these areas.
Under the combined effects of three runoff components, the total runoff displays a general increasing trend among the periods of 1990s and 2000s relative to baseline period over the two basins (Figure 10g,h). In the LRB, months from July to September in 1990s witness large increments while during 2000s there are also considerable increases among May to September, and as a result the annual average value demonstrates an increase by 18% and 24% in the two periods, compared to the baseline period. In the UNRB, the increasing total runoff mainly occurred in July to September during the 1990s, while in the 2000s, this upward comes about a little earlier, starting in April and lasting until September. The yearly average total runoff exhibits a respective increment of 14% in the 1990s, and 16% in the 2000s from that in 1963–1990.

3.4. Influence of the Runoff Component’s Change on River Streamflow Trend

In this section, we investigate the influence of changes in melt water and rainfall runoff on the trends of basin runoff, i.e., the hydrological roles of three runoff elements in controlling the total runoff trend over the two regions during 1963–2012. The individual role of three runoff components on the streamflow trend can be calculated using Equation (12) and the percent contribution of the runoff component’s to the total runoff. In the Lhasa River Basin, the increasing discharge trend (4.62 × 10⁷ m3/year) for the years 1963–2012 is the combined influences of three runoff components (Table 6). There is an increasing trend for both rainfall runoff (4.08 × 10⁷ m3/year) and glacier runoff (0.73 × 10⁷ m3/year), while snowmelt runoff shows a decreasing tendency with a rate of −0.19 × 10⁷ m3/year. By dividing the trend of total runoff by the trend in single component, the estimated contribution ratio from the changing rainfall runoff, glacier runoff, and snowmelt runoff is 88.31%, 15.50%, and −4.11% to the total runoff’s trend during 1963–2012, respectively. Meanwhile, for the upper Niyang River Basin, the annual total runoff also demonstrates an increasing trend of 1.53 × 10⁷ m3 per year for the past 50 years. The rainfall runoff and glacier runoff exhibit a rising tendency, while a descending trend can be found in snowmelt runoff, and their controlling roles in the total runoff’s trend are 63.66%, 40.92%, and −4.58%, respectively.
In the two basins, both increasing rainfall and glacier runoff have a positive influence on the upward trend of total runoff, whereas a negative impact on total runoff can be observed from snowmelt runoff during 1963–2012. For both basins, the ratio contribution from rainfall runoff to the rising trend in total runoff is over 60%, which suggests that rainfall runoff plays a dominant controlling role in the variation of basin runoff during the past 50 years. However, the role of glacier runoff in controlling the trend of total runoff is also obvious. For instance, although glacier runoff accounts for only 5.9% of total runoff in the LRB, its controlling role in trend of basin runoff can be 15.8%. Furthermore, in the UNRB, although just less than 18% of river discharge is from the glacier runoff, increased glacier runoff accounts for up to 40% of the tendency in river discharge, implying an important influence on basin runoff’s trend during the past 50 years. With the global warming climate, glacier runoff may play an increasingly important role in total runoff change over the UNRB, as more and more melt water is released from the iceberg with temperature increase. With regard to snowmelt runoff, it plays a minor role in the trend of total runoff over the two basins. Generally, changing rainfall and glacier runoff play major roles in controlling the trends of basin runoff in the two regions.

4. Discussion

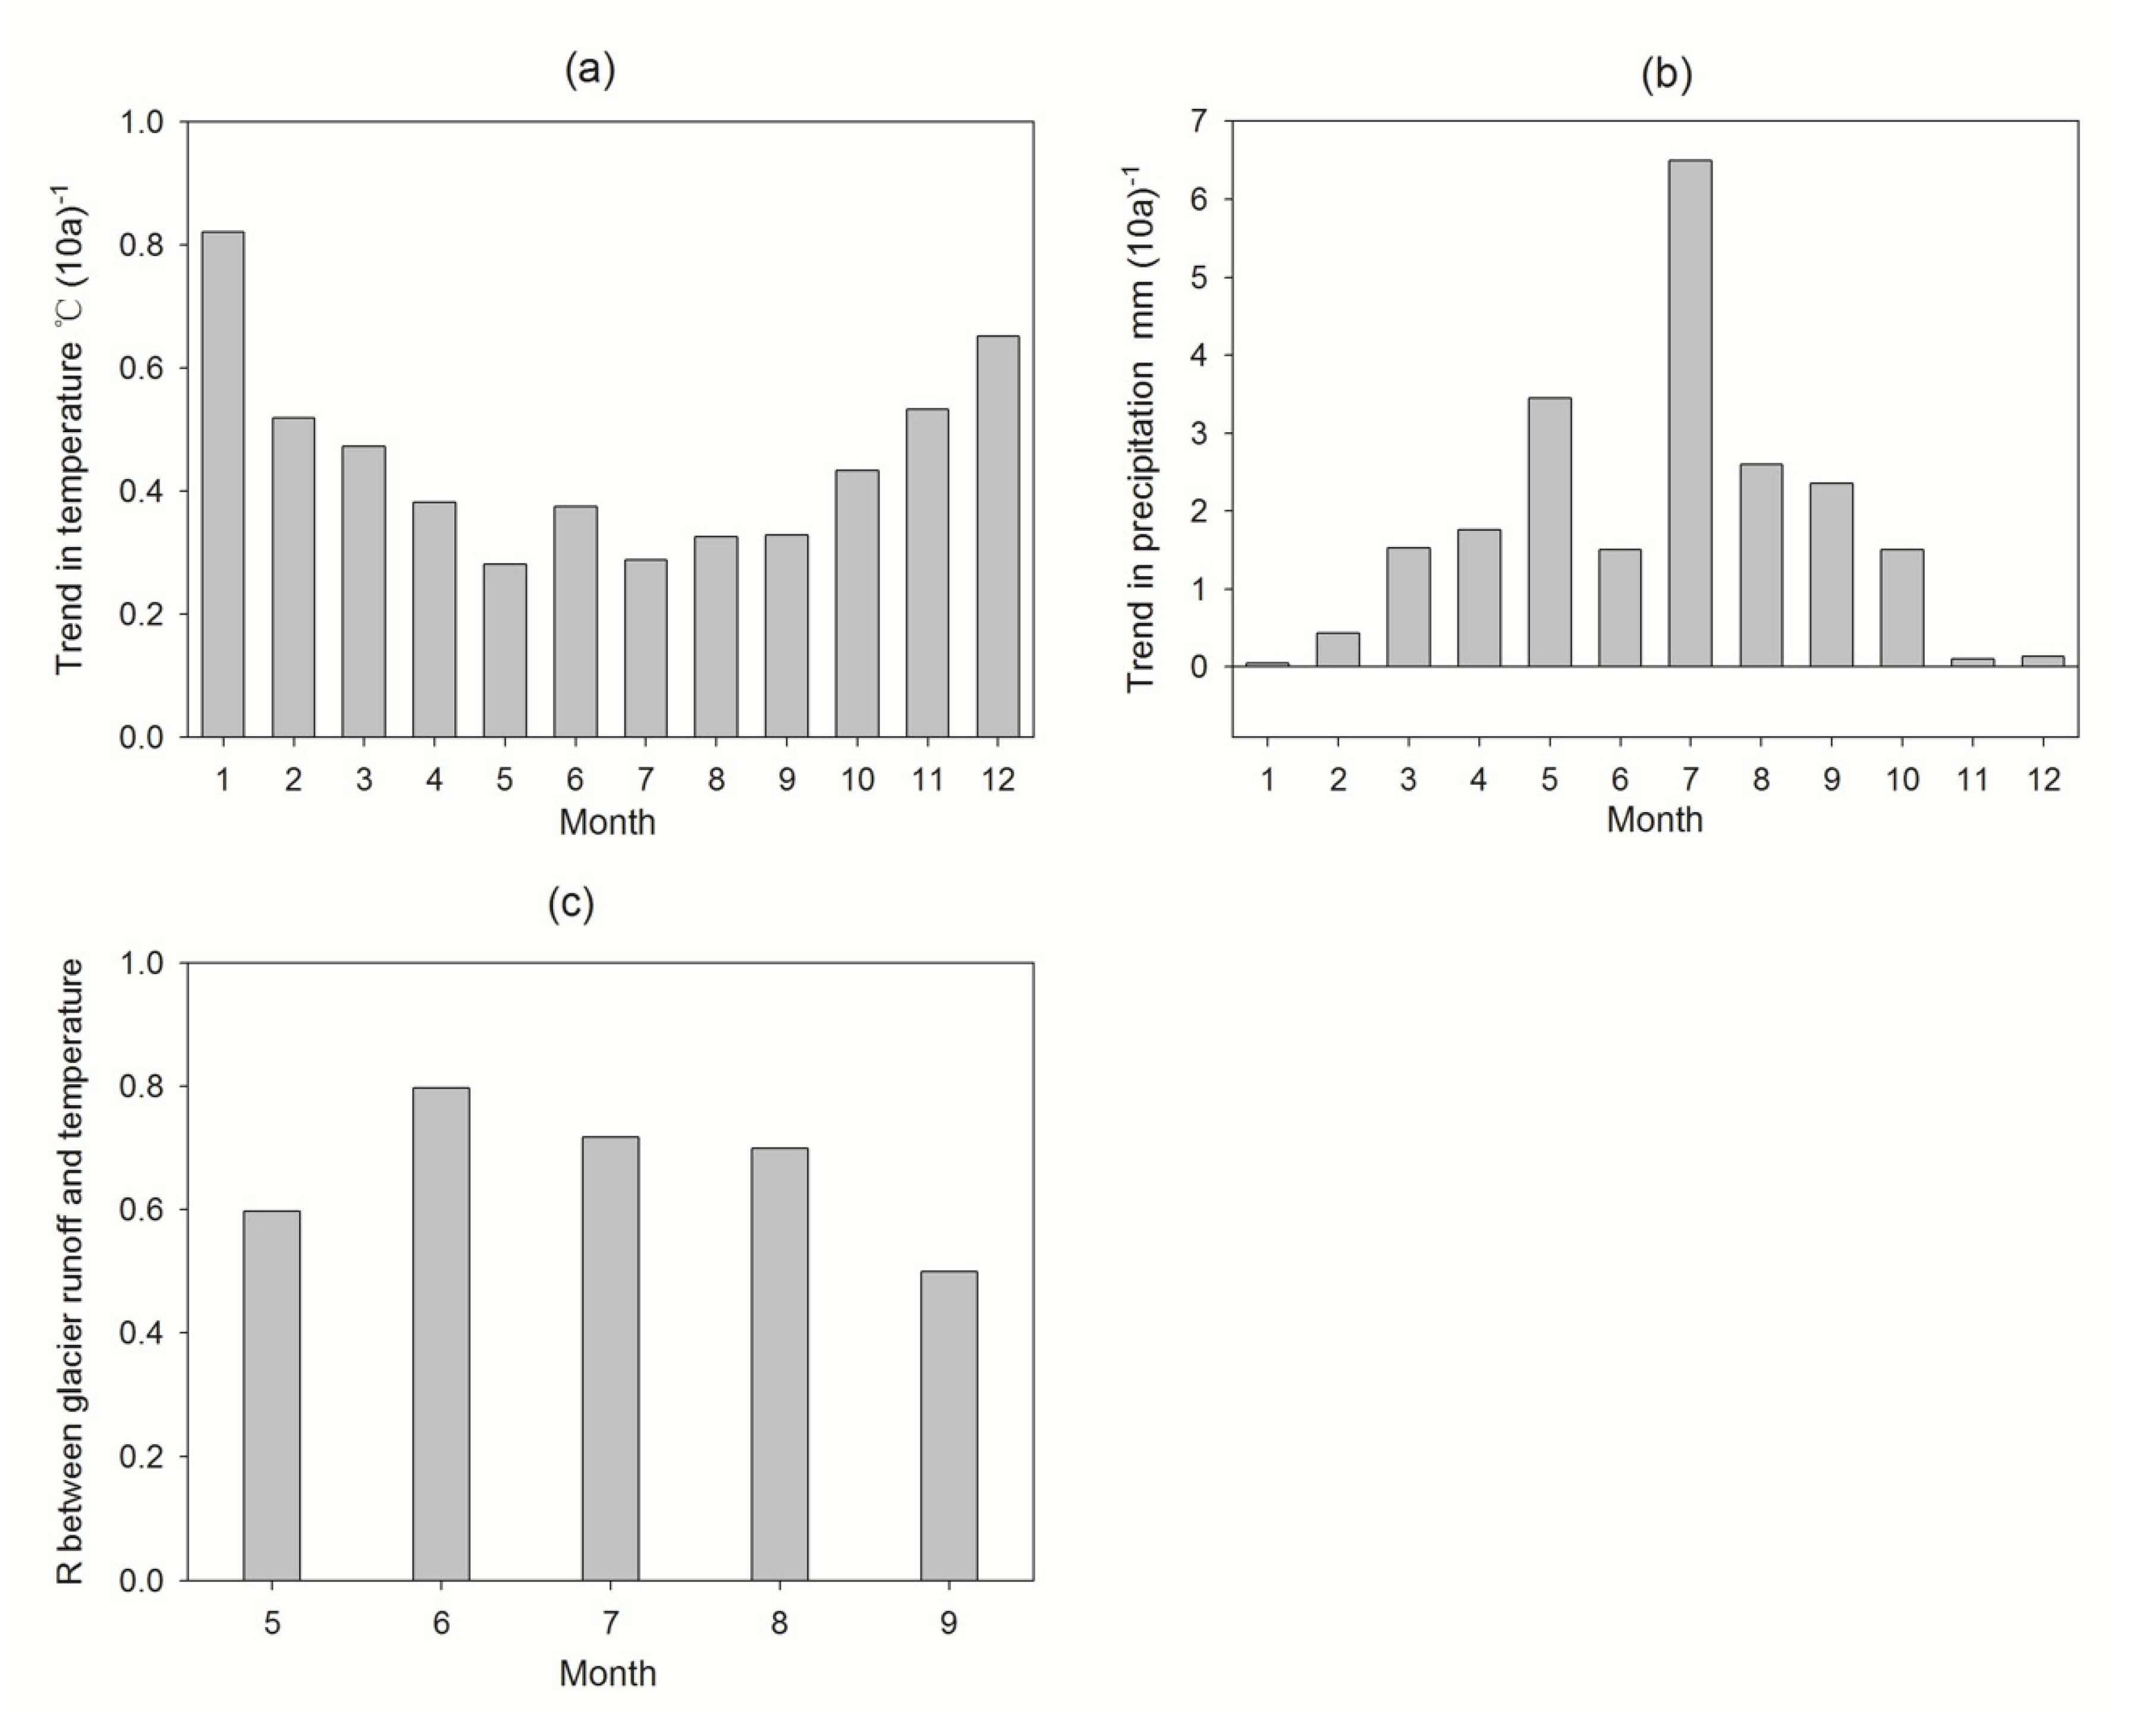
4.1. Linkage between Glacier Runoff and Climate Change

In both Lhasa and upper Niyang River Basins, a significantly increased glacier runoff, simultaneously accompanied by a decline in glacier area, can be detected for 1963–2012 under recent climate change. Our studies are consistent with the findings of Yao et al. [14], who suggest that the glacier recession is very pronounced in the LRB and UNRB during 1970s–2000s. In this part, we take the more glaciated upper Niyang River Basin (UNRB) as a representative case to discuss the linkage between glacier runoff and climate change.
According to the statistical analysis, annual mean air temperature exhibits a significant increase of about 0.45 °C per decade over the past 50 years at a significance level of 0.05 in the UNRB. Meanwhile, trends of air temperature on a monthly scale were derived from January to December and their significance during 1963–2012 was also checked by employing the MK test. It can be seen that all months witness an increasing tendency, and the upward magnitude is over 0.28 °C/10a in the melting season (May–September) (Figure 11a). Moreover, it is statistically significant for all months (α > 0.05), implying that each month the temperature rises very quickly over the period of 1963–2012. With respect to precipitation, there is a slight increasing trend from 1963 to 2012, and all months have also seen an increase during the past decades (Figure 11b).
Furthermore, a correlation analysis has been made between glacier runoff and meteorological factors during the melting period (from May to September). The results imply that a strong and positive correlation between glacier runoff and temperature exists in this period, especially in June to August with Pearson correlation coefficient (R) more than 0.7, when most melt water is released from icebergs (Figure 11c). However, there is a weak correlation between glacier runoff and precipitation (not shown in the figure). Therefore, it can be speculated that the rapidly rising temperature during the past decades is the major driver for the large increase in glacier runoff. Some studies also indicate that temperature rise contributes to glacial shrinkage over the TP [59]. In the Himalayas, ice melting was found to be accelerated and more glacier runoff released into rivers in recent decades with warming climate [60].

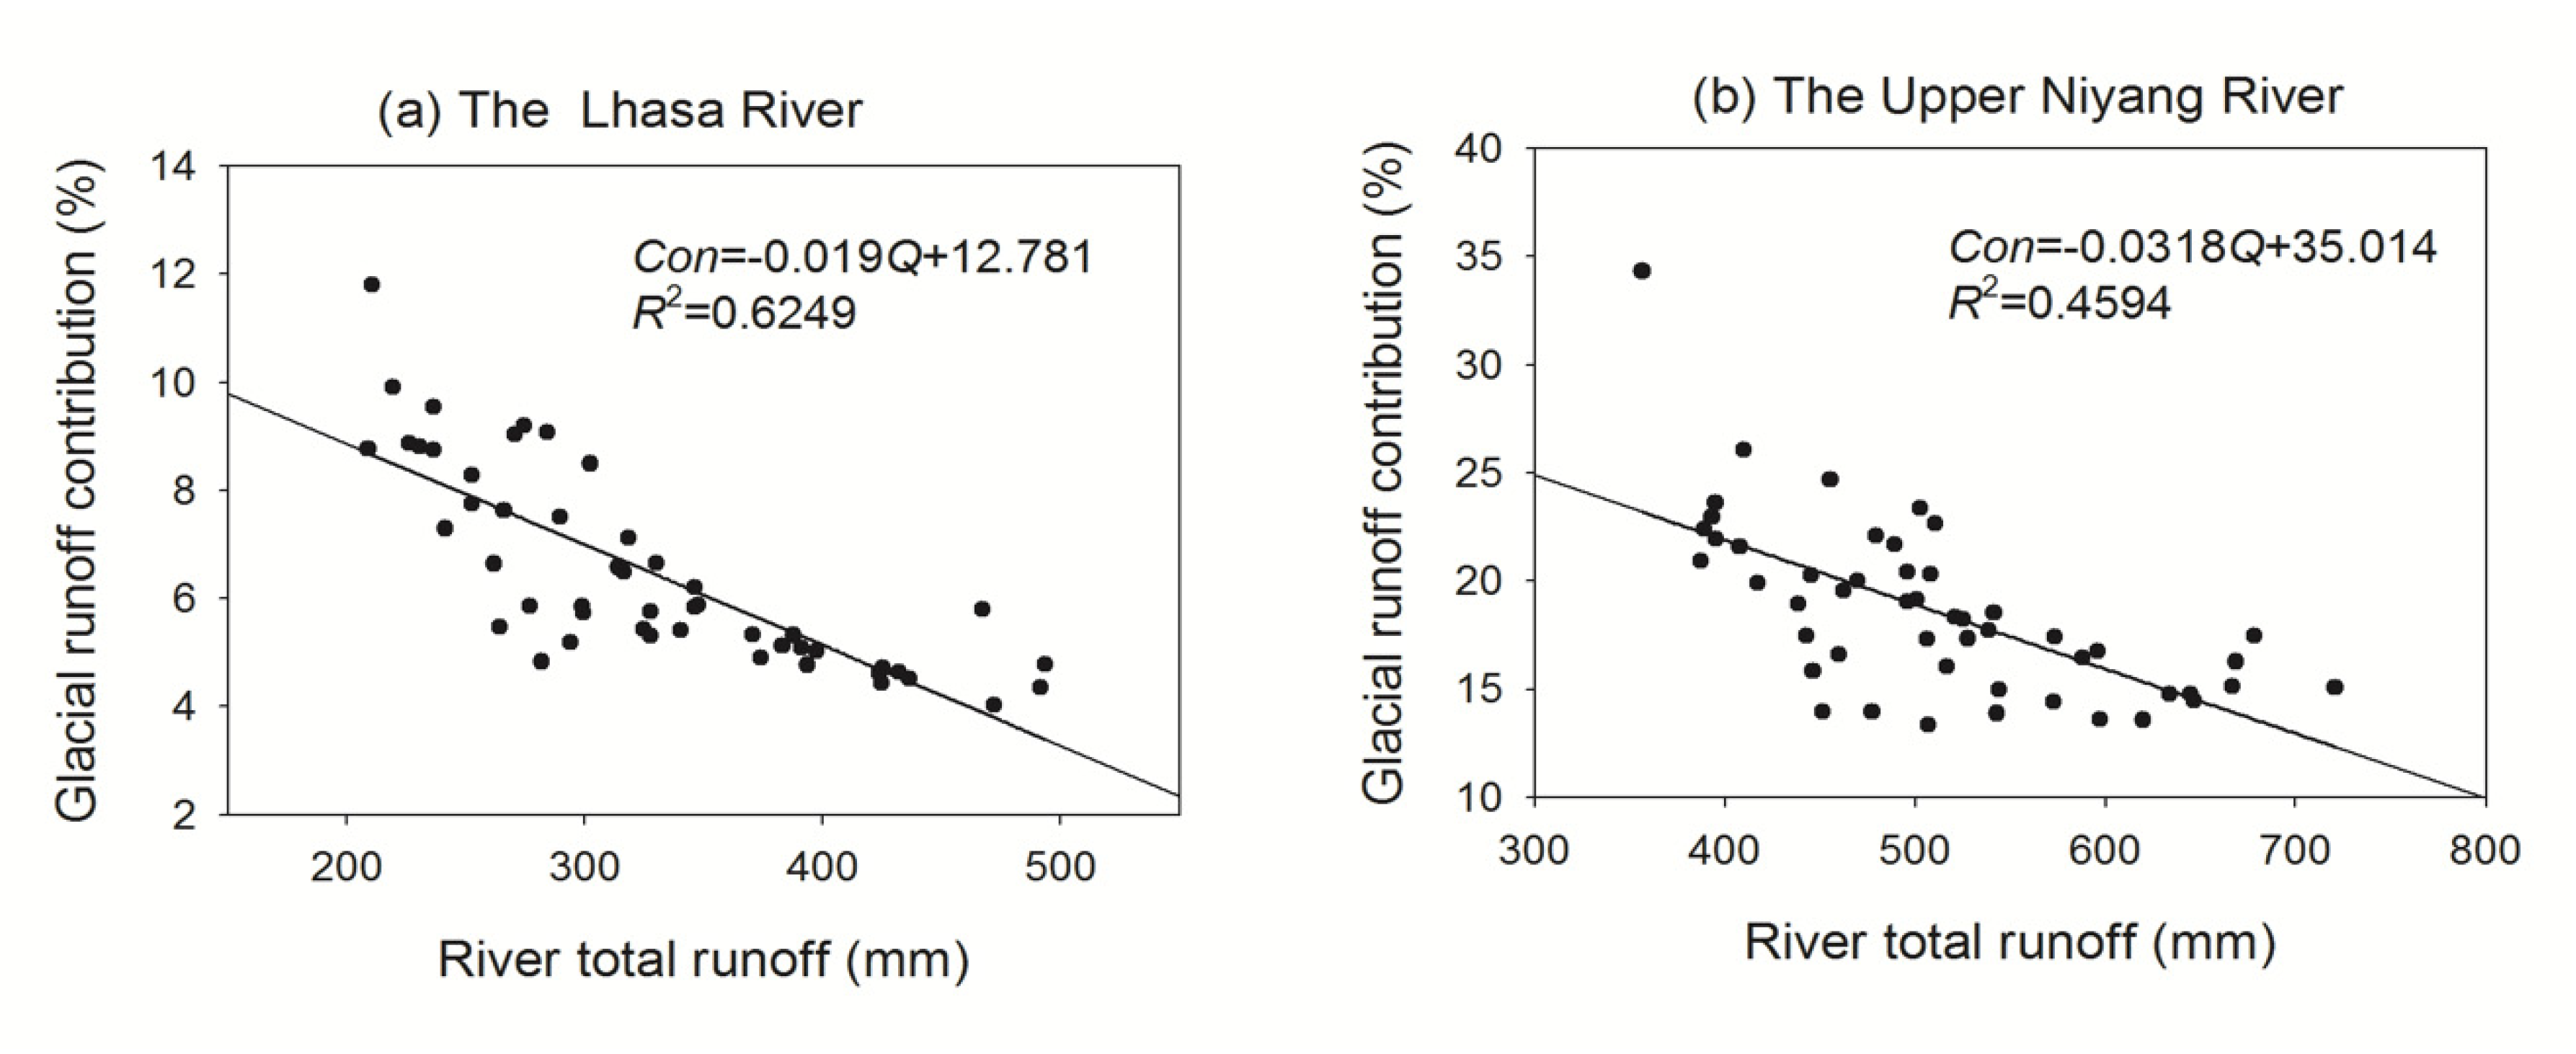
4.2. Roles of Melt Water

In respect to melt water, the snowmelt runoff accounts for about 12% of the total runoff in two basins, while the ratio contribution of glacier runoff to river flow is about 5.9 and 17.6% over the LRB and UNRB, respectively. The Lhasa River Basin and the upper Niyang River Basin are located in the upper Brahmaputra and also in the Himalayan region. Except for the far western and far eastern Himalayan basins, the snowmelt runoff constitutes less than 20% of the total annual runoff in other Himalayan regions [61]. Meanwhile, in the upper Brahmaputra River Basin, a study by Chen et al. [42], who used the CREST model, indicates that snowmelt runoff contribute 10.6% to the total runoff; in results by Lutz et al. [40], based on the SPYM model, it was found to be 9%. Our estimated percentage of snowmelt runoff in total runoff is about 12%, which is basically consistent with the above researches. With regard to glacier runoff in the upper Brahmaputra River Basin, it contributes to about 10% of total runoff in Chen et al. [42], while Lutz et al. [40] demonstrate that the glacial melt fraction is 15.9% of basin runoff. In this study, we show that glacier melting contributes to about 5.9 and 17.6% of total runoff in LRB and UNRB, respectively, which shows a difference from that of Chen et al. [42] and Lutz et al. [40]. The reasons for this discrepancy may be due to different glacier area ratios in these regions. The glacier area accounts for 2.1% of the upper Brahmaputra River Basin, while the percentage of glacier is 1.36% and 3.6% in LRB and UNRB, respectively. Therefore, the glacier runoff ratio in the LRB is less than that of the upper Brahmaputra River Basin, and vice versa in the UNRB. The findings from Zhang et al. [30] also suggest that the contribution of glacier runoff to streamflow is consistent with ice area percentage in the upstream of major rivers. Hence, we believe that the simulated glacier runoff from the VIC-glacier model in the LRB and UNRB can be trusted.
In this study, the contribution of rainfall runoff is over 70% to total runoff for both basins, which suggests that rainfall runoff is the dominant component in these areas. Our result is consistent with other studies [2,30,40]. For example, outcomes from Lutz et al. [40] also indicate that runoff regime is rain dominated in the upstream of the Brahmaputra River Basin. As located in the southeastern TP and affected by monsoon, rainfall plays a major role in sustaining river streamflow in the two basins.
However, melt runoffs from snow cover and ice are still important water resources in the two basins. Although snow melt runoff only accounts for less than 13% of the total annual streamflow, it is about 35% of spring total runoff (March to May) in both basins, which is important for local crop irrigation during this period. In respect to glacier runoff, its contribution to total runoff is also moderate in comparison with rainfall runoff; however, the role of glacier runoff in regulating basin runoff could not be ignored. On the one hand, annual total runoff contributions from glaciers have a smaller inter-annual variability than annual runoff produced by rainfall runoff, and thus could partly mediate the inter-annual variation of basin annual total runoff. In addition, as can be seen in Section 3.4, the glacier runoff also has a large impact on the trend of river flow. Take the UNRB as an example—the controlling role of glacier runoff in streamflow trend can be up to about 41%, suggesting that the variation in glacier runoff is crucial to basin runoff tendency. On the other hand, during years of weak monsoon (i.e., low monsoon precipitation), the generated runoff from glaciers can be used to compensate for potential water deficiency. This phenomenon is commonly referred to as a glacier buffer characteristic [57]. We used Statistical Product and Service Solutions (SPSS) software to fit the linear regression equation for glacier runoff contribution and river total runoff. Figure 12 displays the scatterplots of glacier runoff contribution versus river total runoff in the LRB and UNRB with R2 more than 0.45 for both basins, indicating a significantly negative correlation between the two variables. As we can see, the contribution from glacier runoff to streamflow is greater in the dry years than the wet years. For instance, the proportion of glacier runoff can reach up to 9% and 25% of the total runoff in LRB and UNRB during some very dry years, which is far more than the mean contribution of about 5.9% and 17.6% in the respective basins for the years 1963–2012. Therefore, the contribution from melt water is considerably important during drought years. The research from Bolch et al. [5] also showed that glaciers can be a crucial source of water in Himalayas basins when moon precipitation is low. In addition, Pritchard [62] found that the melt fraction increases in the Brahmaputra River Basin during drought years.
Furthermore, melt water is favorable to environmental and ecological protection for both local and downstream basins. In summer, the temperature of runoff from glacier melting is very low compared to that of rainfall runoff, and thus the melt water may cool the river streamflow to some extent. Rivers with relatively low temperature are very beneficial to local ecological balance, as some aquatic organisms, such as plateau carp, can only survive in cool water. In addition, as located on high altitudes, as well as in low population density in these areas, there is almost no pollution on glacier and snow cover. Thus, melt water from ice or snow is very pure and the water quality is good, which can provide high-quality water resources to the local and downstream areas. Meanwhile, global warming accelerates glacier melting and cleaner glacier runoff routes downstream, which also could partly alleviate water pollution in lower river reaches.

4.3. Ground Water and Implication of this Study

In this study, the total runoff consists of rainfall runoff, snowmelt, and glacier runoff. In an alternative way, the VIC-glacier model partitions the total runoff into surface runoff (water from the upper two soil layers) and subsurface runoff (water from the lower soil layer) [44,45]. In this model, the subsurface runoff is also called base flow (ground water), which can originate from rainfall, glacier, and snow melt. The long-term contribution of base flow to total runoff was estimated as 20.2% in LRB and 10.5% in UNRB, while 79.8% and 89.5% of total runoff is from surface runoff in the two regions, based on VIC-glacier model simulation. In the upper Brahmaputra (containing the LRB and UNRB), results from Lutz et al. [40] show that base flow contributed 16.2% of total runoff by using a distributed hydrological model (SPHY). Our estimated base flow ratio in these two basins are basically in agreement with that of Lutz et al. [40]. Compared to the LRB, the proportion of base flow in UNRB is relatively small, which may be closely related to the steeper topography in this area. According to elevation statistics, areas with an altitude higher than 5000 m account for 54% of the UNRB, while it is 45% in the LRB. More steep slopes make surface runoff easier, whereas it could reduce water infiltration into the ground and thus result in less base flow in the UNRB. In addition, the monthly ratio of base flow in total runoff is shown in Table 7. The large proportion during November to February suggests that groundwater plays an important role in providing water during winter in the two basins.
In this study, the simulated snowmelt runoff was found to exhibit a generally decreasing trend in the past 50 years. This may be caused by the decrease in snow cover under warming climates. The decline in snowmelt runoff may have a negative impact on local agriculture, especially in the spring or summer when crops need a large amount of water for growth. Meanwhile, the snowmelt runoff in the LRB was found to peak up to one month earlier in the 1990s and the 2000s, compared to the baseline period, i.e., shifting from June to May, which may reduce the amount of water in summer when irrigation water demand is at its peak. In contrast to the snowmelt runoff, our results indicate that there is an increasing trend in both glacier runoff and rainfall runoff, which may partly neutralize the negative effects on agriculture caused by the reduction in snowmelt water. The more available water from the combined increases in glacier and rainfall runoff will benefit the local agriculture, industry, and ecosystem protection.

5. Conclusions

To fully understand potential changes in the hydrological regime in the Tibetan Plateau basins under global continuous warming, the VIC-glacier model was employed in the LRB and UNRB, to analyze the responses of rainfall runoff and melt water to recent climate change, and also quantify their controlling roles in the trends of river streamflow during 1963–2012. The hydrological model was calibrated using observed streamflow and remotely sensed data to reduce simulation uncertainties in the focus basins.
The rainfall runoff is the dominant water resource, which accounts for over 70% of the total runoff in the two basins. Glacier runoff contributes 5.9% and 17.9% to the overall runoff in LRB and UNRB, respectively. In respect of snow melt runoff, its contribution to total runoff is about 12% in the two basins.
The simulations indicate that there is a significant increasing trend in glacier runoff for the two basins during 1963–2012, especially in the period of the 2000s, when the ice melt water exhibited a large increment, up to about 45% relative to the baseline period. Snowmelt runoff displays a general decreasing tendency in these regions. In respect of rainfall runoff, both basins suggest a rising tendency in the study period.
In the LRB, increasing river flow during the past decades is attributed predominantly to rainfall runoff rise, which contributes over 88% to the overall increases in basin runoff. For the more glaciated UNRB, the influence from melt water on streamflow is growing, and the rise in glacier runoff accounts for up to 41% in controlling total runoff trend during 1963–2012. With regard to snowmelt runoff, its role is relatively small in affecting total runoff tendency.
The runoff components in the glacierized LRB and UNRB have been quantified in this study, which will help improve our understanding of the variations in hydrological regime under change in climate warming. This study may shed light on hydrological modeling in cryospheric regions like the TP basins and other similar regions. The findings from our results may provide beneficial reference for local governmental decision-making in water resources management.

Author Contributions

All authors contributed significantly to this work. Y.Z. designed the study; Z.H. and X.L. prepared the driven data; Q.J. and L.Z. set up the model and calibrated the model. The manuscript was prepared by Y.Z. and revised by C.-Y.X. All authors have read and agreed to the published version of the manuscript.

Funding

This work was supported by the National Natural Foundation of China (No.51379179) and the National Key Research Projects of China (No. 2018YFC1508001).

Acknowledgments

Cordial thanks are extended to Fengge Su and Kai Tong from the Institute of Tibetan Plateau Research, Chinese Academy of Sciences, Beijing, China, for their help with the VIC model data preparation for the focus basins. We also appreciate two anonymous reviewers for their valuable comments and suggestions.

Conflicts of Interest

The authors declare no conflict of interest.

References

  1. Bibi, S.; Wang, L.; Li, X.P.; Zhou, J.; Chen, D.L.; Yao, T.D. Climatic and associated cryospheric, biospheric, and hydrological changes on the Tibetan Plateau: A review. Int. J. Climatol. 2018, 38, E1–E17. [Google Scholar] [CrossRef] [Green Version]
  2. Immerzeel, W.W.; Van Beek, L.P.; Bierkens, M.F. Climate change will affect the Asian water towers. Science 2010, 328, 1382–1385. [Google Scholar] [CrossRef] [PubMed]
  3. Zhong, R.D.; He, Y.H.; Chen, X.H. Responses of the hydrological regime to variations in meteorological factors under climate change of the Tibetan plateau. Atmos. Res. 2018, 214, 296–310. [Google Scholar] [CrossRef]
  4. Wang, X.J.; Pang, G.J.; Yang, M.X. Precipitation over the Tibetan Plateau during recent decades: A review based on observations and simulations. Int. J. Climatol. 2018, 38, 1116–1131. [Google Scholar] [CrossRef]
  5. Bolch, T. HYDROLOGY Asian glaciers are a reliable water source. Nature 2017, 545, 161–162. [Google Scholar] [CrossRef] [Green Version]
  6. Xu, M.; Kang, S.C.; Wang, X.M.; Pepin, N.; Wu, H. Understanding changes in the water budget driven by climate change in cryospheric-dominated watershed of the northeast Tibetan Plateau, China. Hydrol. Process. 2019, 33, 1040–1058. [Google Scholar] [CrossRef] [Green Version]
  7. Zhao, Q.D.; Ding, Y.J.; Wang, J.; Gao, H.K.; Zhang, S.Q.; Zhao, C.C.; Xu, J.L.; Han, H.D.; Shangguan, D.H. Projecting climate change impacts on hydrological processes on the Tibetan Plateau with model calibration against the glacier inventory data and observed streamflow. J. Hydrol. 2019, 573, 60–81. [Google Scholar] [CrossRef]
  8. Li, W.K.; Qiu, B.; Guo, W.D.; Zhu, Z.W.; Hsu, P.C. Intraseasonal variability of Tibetan Plateau snow cover. Int. J. Climatol. 2020, 40, 3451–3466. [Google Scholar] [CrossRef] [Green Version]
  9. Qin, D.H.; Zhou, B.T.; Xiao, C.D. Progress in studies of cryospheric changes and their impacts on climate of china. J. Meteorol. Res. 2014, 28, 732–746. [Google Scholar] [CrossRef]
  10. Chen, R.; Wang, G.; Yang, Y.; Liu, J.; Han, C.; Song, Y.; Liu, Z.; Kang, E. Effects of Cryospheric Change on Alpine Hydrology: Combining a Model With Observations in the Upper Reaches of the Hei River, China. J. Geophys. Res. Atmos. 2018, 123, 3414–3442. [Google Scholar] [CrossRef]
  11. You, Q.L.; Wu, T.; Shen, L.C.; Pepin, N.; Zhang, L.; Jiang, Z.H.; Wu, Z.W.; Kang, S.C.; AghaKouchak, A. Review of snow cover variation over the Tibetan Plateau and its influence on the broad climate system. Earth Sci. Rev. 2020, 201, 1–13. [Google Scholar] [CrossRef]
  12. Jin, H.Y.; Ju, Q.; Yu, Z.B.; Hao, J.; Gu, H.H.; Gu, H.N.; Li, W. Simulation of snowmelt runoff and sensitivity analysis in the Nyang River Basin, southeastern Qinghai-Tibetan Plateau, China. Nat. Hazards 2019, 99, 931–950. [Google Scholar] [CrossRef]
  13. Wang, Y.H.; Yang, H.B.; Gao, B.; Wang, T.H.; Qin, Y.; Yang, D.W. Frozen ground degradation may reduce future runoff in the headwaters of an inland river on the northeastern Tibetan Plateau. J. Hydrol. 2018, 564, 1153–1164. [Google Scholar] [CrossRef]
  14. Yao, T.; Thompson, L.; Yang, W.; Yu, W.; Gao, Y.; Guo, X.; Yang, X.; Duan, K.; Zhao, H.; Xu, B. Different glacier status with atmospheric circulations in Tibetan Plateau and surroundings. Nat. Clim. Chang. 2012, 2, 663–667. [Google Scholar] [CrossRef]
  15. Li, C.; Su, F.; Yang, D.; Tong, K.; Meng, F.; Kan, B. Spatiotemporal variation of snow cover over the Tibetan Plateau based on MODIS snow product, 2001–2014. Int. J. Climatol. 2018, 38, 708–728. [Google Scholar] [CrossRef]
  16. Jiang, Y.S.; Chen, F.; Gao, Y.H.; Barlage, M.; Li, J.D. Using Multisource Satellite Data to Assess Recent Snow-Cover Variability and Uncertainty in the Qinghai-Tibet Plateau. J. Hydrometeorol. 2019, 20, 1293–1306. [Google Scholar] [CrossRef]
  17. Zhang, Z.H.; Deng, S.F.; Zhao, Q.D.; Zhang, S.Q.; Zhang, X.W. Projected glacier meltwater and river run-off changes in the Upper Reach of the Shule River Basin, north-eastern edge of the Tibetan Plateau. Hydrol. Process. 2019, 33, 1059–1074. [Google Scholar] [CrossRef]
  18. Barnett, T.P.; Adam, J.C.; Lettenmaier, D.P. Potential impacts of a warming climate on water availability in snow-dominated regions. Nature 2005, 438, 303–309. [Google Scholar] [CrossRef]
  19. Bolch, T.; Kulkarni, A.; Kaab, A.; Huggel, C.; Paul, F.; Cogley, J.G.; Frey, H.; Kargel, J.S.; Fujita, K.; Scheel, M.; et al. The State and Fate of Himalayan Glaciers. Science 2012, 336, 310–314. [Google Scholar] [CrossRef] [Green Version]
  20. Yao, T.; Wang, Y.; Liu, S.; Pu, J.; Shen, Y.; Lu, A. Recent glacial retreat in High Asia in China and its impact on water resource in Northwest China. Sci. China Ser. D Earth Sci. 2004, 47, 1065–1075. [Google Scholar] [CrossRef]
  21. Li, Z.X.; Feng, Q.; Li, Z.J.; Yuan, R.F.; Gui, J.; Lv, Y.M. Climate background, fact and hydrological effect of multiphase water transformation in cold regions of the Western China: A review. Earth Sci. Rev. 2019, 190, 33–57. [Google Scholar]
  22. Chang, B.; He, K.N.; Li, R.J.; Wang, H.; Wen, J. Trends, Abrupt Changes, and Periodicity of Streamflow in Qinghai Province, the Northeastern Tibetan Plateau, China. Pol. J. Environ. Stud. 2018, 27, 545–555. [Google Scholar] [CrossRef]
  23. Yao, Z.; Liu, Z.; Huang, H.; Liu, G.; Wu, S. Statistical estimation of the impacts of glaciers and climate change on river runoff in the headwaters of the Yangtze River. Quat. Int. 2014, 336, 89–97. [Google Scholar] [CrossRef]
  24. Zhang, Y.; Liu, S.; Xu, J.; Shangguan, D. Glacier change and glacier runoff variation in the Tuotuo River basin, the source region of Yangtze River in western China. Environ. Geol. 2008, 56, 59–68. [Google Scholar] [CrossRef]
  25. Li, Z.X.; Qi, F.; Wang, Q.J.; Song, Y.; Li, H.Y.; Li, Y.G. The influence from the shrinking cryosphere and strengthening evopotranspiration on hydrologic process in a cold basin, Qilian Mountains. Glob. Planet. Chang. 2016, 144, 119–128. [Google Scholar]
  26. Zhang, Y.G.; Hao, Z.C.; Xu, C.Y.; Lai, X.D. Response of melt water and rainfall runoff to climate change and their roles in controlling streamflow changes of the two upstream basins over the Tibetan Plateau. Hydrol. Res. 2020, 51, 272–289. [Google Scholar] [CrossRef] [Green Version]
  27. Zhang, M.F.; Ren, Q.S.; Wei, X.H.; Wang, J.S.; Yang, X.L.; Jiang, Z.S. Climate change, glacier melting and streamflow in the Niyang River Basin, Southeast Tibet, China. Ecohydrology 2011, 4, 288–298. [Google Scholar] [CrossRef]
  28. Wu, Z.H.; Mei, Y.D.; Chen, J.H.; Hu, T.S.; Xiao, W.H. Attribution Analysis of Dry Season Runoff in the Lhasa River Using an Extended Hydrological Sensitivity Method and a Hydrological Model. Water 2019, 11, 1187. [Google Scholar] [CrossRef] [Green Version]
  29. Prasch, M.; Mauser, W.; Weber, M. Quantifying present and future glacier melt-water contribution to runoff in a central Himalayan river basin. Cryosphere 2013, 7, 889–904. [Google Scholar] [CrossRef] [Green Version]
  30. Zhang, L.; Su, F.; Yang, D.; Hao, Z.; Tong, K. Discharge regime and simulation for the upstream of major rivers over Tibetan Plateau. J. Geophys. Res. Atmos. 2013, 118, 8500–8518. [Google Scholar] [CrossRef]
  31. Kimball, J.; Running, S.; Nemani, R. An improved method for estimating surface humidity from daily minimum temperature. Agric. For. Meteorol. 1997, 85, 87–98. [Google Scholar] [CrossRef]
  32. Shen, Y.; Xiong, A.Y. Validation and comparison of a new gauge-based precipitation analysis over mainland China. Int. J. Climatol. 2016, 36, 252–265. [Google Scholar] [CrossRef]
  33. Zhang, X.J.; Tang, Q.H.; Pan, M.; Tang, Y. A Long-Term Land Surface Hydrologic Fluxes and States Dataset for China. J. Hydrometeorol. 2014, 15, 2067–2084. [Google Scholar] [CrossRef]
  34. Wang, S.; Liu, S.X.; Mo, X.G.; Peng, B.; Qiu, J.X.; Li, M.X.; Liu, C.M.; Wang, Z.G.; Bauer-Gottwein, P. Evaluation of Remotely Sensed Precipitation and Its Performance for Streamflow Simulations in Basins of the Southeast Tibetan Plateau. J. Hydrometeorol. 2015, 16, 2577–2594. [Google Scholar] [CrossRef]
  35. Shi, Y.F.; Liu, C.H.; Kang, E. The Glacier Inventory of China. Ann. Glaciol. 2009, 50, 1–4. [Google Scholar] [CrossRef] [Green Version]
  36. Guo, W.Q.; Liu, S.Y.; Xu, L.; Wu, L.Z.; Shangguan, D.H.; Yao, X.J.; Wei, J.F.; Bao, W.J.; Yu, P.C.; Liu, Q.; et al. The second Chinese glacier inventory: Data, methods and results. J. Glaciol. 2015, 61, 357–372. [Google Scholar] [CrossRef] [Green Version]
  37. Gupta, A.; Kayastha, R.B.; Ramanathan, A.L.; Dimri, A.P. Comparison of hydrological regime of glacierized Marshyangdi and Tamor river basins of Nepal. Environ. Earth Sci. 2019, 78, 427. [Google Scholar] [CrossRef]
  38. Wang, X.Y.; Yang, T.; Xu, C.Y.; Yong, B.; Shi, P.F. Understanding the discharge regime of a glacierized alpine catchment in the Tianshan Mountains using an improved HBV-D hydrological model. Glob. Planet. Chang. 2019, 172, 211–222. [Google Scholar] [CrossRef]
  39. Duethmann, D.; Bolch, T.; Farinotti, D.; Kriegel, D.; Vorogushyn, S.; Merz, B.; Pieczonka, T.; Jiang, T.; Su, B.D.; Guntner, A. Attribution of streamflow trends in snow and glacier melt-dominated catchments of the Tarim River, Central Asia. Water Resour. Res. 2015, 51, 4727–4750. [Google Scholar] [CrossRef] [Green Version]
  40. Lutz, A.; Immerzeel, W.; Shrestha, A.; Bierkens, M. Consistent increase in High Asia’s runoff due to increasing glacier melt and precipitation. Nat. Clim. Chang. 2014, 4, 587–592. [Google Scholar] [CrossRef] [Green Version]
  41. Luo, Y.; Arnold, J.; Liu, S.Y.; Wang, X.Y.; Chen, X. Inclusion of glacier processes for distributed hydrological modeling at basin scale with application to a watershed in Tianshan Mountains, northwest China. J. Hydrol. 2013, 477, 72–85. [Google Scholar] [CrossRef]
  42. Chen, X.; Long, D.; Hong, Y.; Zeng, C.; Yan, D.H. Improved modeling of snow and glacier melting by a progressive two-stage calibration strategy with GRACE and multisource data: How snow and glacier meltwater contributes to the runoff of the Upper Brahmaputra River basin? Water Resour. Res. 2017, 53, 2431–2466. [Google Scholar] [CrossRef]
  43. Shen, Y.J.; Shen, Y.; Fink, M.; Kralisch, S.; Brenning, A. Unraveling the Hydrology of the Glacierized Kaidu Basin by Integrating Multisource Data in the Tianshan Mountains, Northwestern China. Water Resour. Res. 2018, 54, 557–580. [Google Scholar] [CrossRef]
  44. Liang, X.; Lettenmaier, D.P.; Wood, E.F.; Burges, S.J. A simple hydrologically based model of land surface water and energy fluxes for general circulation models. J. Geophys. Res. 1994, 99, 14415–14428. [Google Scholar] [CrossRef]
  45. Liang, X.; Wood, E.F.; Lettenmaier, D.P. Surface soil moisture parameterization of the VIC-2L model: Evaluation and modification. Glob. Planet. Chang. 1996, 13, 195–206. [Google Scholar] [CrossRef]
  46. Cherkauer, K.A.; Lettenmaier, D.P. Simulation of spatial variability in snow and frozen soil. J. Geophys. Res. Atmos. 2003, 108, 1–14. [Google Scholar] [CrossRef]
  47. Meng, F.C.; Su, F.G.; Li, Y.; Tong, K. Changes in Terrestrial Water Storage during 2003–2014 and Possible Causes in Tibetan Plateau. J. Geophys. Res. Atmos. 2019, 124, 2909–2931. [Google Scholar] [CrossRef]
  48. Tong, K.; Su, F.G.; Xu, B.Q. Quantifying the contribution of glacier meltwater in the expansion of the largest lake in Tibet. J. Geophys. Res. Atmos. 2016, 121, 11158–11173. [Google Scholar] [CrossRef]
  49. Zhang, Y.; Liu, S.; Ding, Y. Observed degree-day factors and their spatial variation on glaciers in western China. Ann. Glaciol. 2006, 43, 301–306. [Google Scholar] [CrossRef] [Green Version]
  50. Su, F.; Adam, J.C.; Bowling, L.C.; Lettenmaier, D.P. Streamflow simulations of the terrestrial Arctic domain. J. Geophys. Res. Atmos. 2005, 110, D08112. [Google Scholar] [CrossRef]
  51. Mann, H.B. Nonparametric tests against trend. Econometrica 1945, 13, 245–259. [Google Scholar] [CrossRef]
  52. Kendall, M. Rank Correlation Methods, 4th ed.; Griffin: London, UK, 1975; p. 202. [Google Scholar]
  53. Kumar, S.; Merwade, V.; Kam, J.; Thurner, K. Streamflow trends in Indiana: Effects of long term persistence, precipitation and subsurface drains. J. Hydrol. 2009, 374, 171–183. [Google Scholar] [CrossRef]
  54. Wu, Y.H.; Zheng, H.X.; Zhang, B.; Chen, D.M.; Lei, L.P. Long-Term Changes of Lake Level and Water Budget in the Nam Co Lake Basin, Central Tibetan Plateau. J. Hydrometeorol. 2014, 15, 1312–1322. [Google Scholar] [CrossRef]
  55. Cuo, L.; Zhang, Y.; Gao, Y.; Hao, Z.; Cairang, L. The impacts of climate change and land cover/use transition on the hydrology in the upper Yellow River Basin, China. J. Hydrol. 2013, 502, 37–52. [Google Scholar] [CrossRef]
  56. Kan, B.; Su, F.; Xu, B.; Xie, Y.; Li, J.; Zhang, H. Generation of High Mountain Precipitation and Temperature Data for a Quantitative Assessment of Flow Regime in the Upper Yarkant Basin in the Karakoram. J. Geophys. Res. Atmos. 2018, 123, 8462–8486. [Google Scholar] [CrossRef]
  57. Sharma, B.R.; de Condappa, D. Opportunities for harnessing the increased contribution of glacier and snowmelt flows in the Ganges basin. Water Policy 2013, 15, 9–25. [Google Scholar] [CrossRef]
  58. Yang, K.; Wu, H.; Qin, J.; Lin, C.G.; Tang, W.J.; Chen, Y.Y. Recent climate changes over the Tibetan Plateau and their impacts on energy and water cycle: A review. Glob. Planet. Chang. 2014, 112, 79–91. [Google Scholar] [CrossRef]
  59. Qin, J.; Yang, K.; Liang, S.L.; Guo, X.F. The altitudinal dependence of recent rapid warming over the Tibetan Plateau. Clim. Chang. 2009, 97, 321–327. [Google Scholar] [CrossRef]
  60. Li, Z.X.; He, Y.Q.; An, W.L.; Song, L.L.; Zhang, W.; Catto, N.; Wang, Y.; Wang, S.J.; Liu, H.C.; Cao, W.H.; et al. Climate and glacier change in southwestern China during the past several decades. Environ. Res. Lett. 2011, 6, 1–24. [Google Scholar] [CrossRef]
  61. Bookhagen, B.; Burbank, D.W. Toward a complete Himalayan hydrological budget: Spatiotemporal distribution of snowmelt and rainfall and their impact on river discharge. J. Geophys. Res. Earth Surf. 2010, 115, 1–25. [Google Scholar] [CrossRef] [Green Version]
  62. Pritchard, H.D. Asia’s shrinking glaciers protect large populations from drought stress. Nature 2019, 569, 649–654. [Google Scholar] [CrossRef]
Figure 1. Location of the study basins, streamflow gauging stations, meteorological stations, elevations, and glaciers.
Water 12 03112 g001
Figure 2. Simulated and observed monthly runoff for the period 1963–2010 in the Lhasa River Basin. 1963–1990 and 1991–2010 are the calibration and validation periods, respectively.
Water 12 03112 g002
Figure 3. Simulated and observed monthly runoff for the period 1979–2010 in the upper Niyang River Basin. 1979–1995 and 1996–2010 are the calibration and validation periods, respectively.
Water 12 03112 g003
Figure 4. Variations of the annual observed and VIC simulated runoff, and their linear trends during the historical period.
Water 12 03112 g004
Figure 5. Comparison of modelled mass balances with observed mass balances for 2006–2010 in the Gurenhekou glacier.
Water 12 03112 g005
Figure 6. Comparison between MODIS and VIC estimated mean monthly snow cover in the (a) LRB and (b) UNRB.
Water 12 03112 g006
Figure 7. Annual contribution of glacier, snowmelt, and rainfall runoff to total runoff in the (a) LRB and (b) UNRB.
Water 12 03112 g007
Figure 8. Seasonal distribution of total runoff, rainfall runoff, snowmelt runoff, and glacier runoff in the (a) LRB and (b) UNRB.
Water 12 03112 g008
Figure 9. Mean monthly precipitation and temperature in the three periods over the LRB (a,b) and UNRB (c,d).
Water 12 03112 g009
Figure 10. Mean monthly rainfall runoff, snowmelt runoff, glacier runoff and total runoff during the reference period (1963–1990), 1990s (1991–2000), and 2000s (2001–2012) over two study basins.
Water 12 03112 g010
Figure 11. Trends of monthly temperature (a), precipitation (b), and Pearson correlation coefficient (R) between glacier runoff and temperature (c) in the UNRB.
Water 12 03112 g011
Figure 12. Scatterplots of glacier runoff contribution (Con) versus river total runoff (Q) over the LRB (a) and UNRB (b).
Water 12 03112 g012
Table 1. Characteristics of the study basins.
BasinGaugeGauge LocationDrainage Area (km2)Glacier Area (km2)Percent of Drainage Area for Glacier (%)
Latitude (°)Longitude (°)
LRBLhasa29.6391.1526,235356.01.36
UNRBGongbujiangda29.8893.256417231.03.60
Table 2. Monthly temperature laps rate (Tlaps) (°C/km) and correlation coefficient (R) between temperature and elevation.
MonthJanFebMarAprMayJunJulAugSepOctNovDec
Tlaps−3.6−4.1−4.9−5.7−6.4−5.6−5.1−5.2−5.8−3.8−4.4−3.8
R0.730.720.810.800.880.860.820.840.820.830.850.84
Table 3. The model’s parameter settings.
Model ParameterUnitRangeLRBUNRB
Degree-day factor for ice-melt (DDFice)mm °C1 day13.4–11.89.09.0
Degree-day factor for snowmelt (DDFsnow)mm °C1 day13.0–7.94.14.1
Fraction of Dsmax where non-linear baseflow begins (Ds)None0–10.030.02
Maximum velocity of baseflow(Dsmax)mm/d0–5010.010.0
Fraction of maximum soil moisture where non-linear baseflow occurs (Ws)None0–10.90.9
Variable infiltration curve parameter (binfilt)None0–0.40.30.2
Thickness of the second soil moisture layer (d2)m0–31.11.3
Table 4. Statistical indices for assessing performance of the simulation.
BasinOverall Calibration Validation
NSEPBIAS (%)NSEPBIAS (%)NSEPBIAS (%)
LRB0.873.380.87−2.810.866.82
UNRB0.85−0.980.87−5.220.843.5
Table 5. Trends for simulated runoff components during 1963–2012.
BasinTotal RunoffRainfall RunoffGlacial RunoffSnowmelt Runoff
LRB4.62 × 107 m3/year4.08 × 107 m3/year0.73 × 107 m3/year *−0.19 × 10⁷ m3/year
UNRB1.53 × 107 m3/year *0.974 × 10⁷ m3/year0.626 × 107 m3/year *−0.07 × 10⁷ m3/year
* Significance 0.05.
Table 6. Ratio contribution for attributing the trend of total runoff to three runoff components during 1963–2012 in the two basins.
BasinTrend of Total Runoff
(m3/Year)
Contribution from Rainfall Runoff (%)Contribution from Glacial Runoff (%)Contribution from Snowmelt Runoff (%)
LRB4.62 × 10788.3115.80−4.11
UNRB1.53 × 107 63.6640.92−4.58
Table 7. Percentage of base flow in total runoff in the two basins.
MonthJanFebMarAprMayJunJulAugSepOctNovDec
LRB91.387.864.726.28.94.98.213.019.740.974.990.8
UNRB90.577.641.015.05.83.64.56.19.026.964.190.7
Publisher’s Note: MDPI stays neutral with regard to jurisdictional claims in published maps and institutional affiliations.

