Article

Evaluation and Quantification of the Effects of Climate and Vegetation Cover Change on Karst Water Sources: Case Studies of Two Springs in South-Western Slovenia

1
Department of Geography, Faculty of Humanities, University of Primorska, SI-6000 Koper, Slovenia
2
ZRC SAZU, Karst Research Institute, SI-6230 Postojna, Slovenia
3
UNESCO Chair on Karst Education, University of Nova Gorica, SI-5271 Vipava, Slovenia
*
Author to whom correspondence should be addressed.
Water 2020, 12(11), 3087; https://doi.org/10.3390/w12113087
Submission received: 14 October 2020 / Revised: 30 October 2020 / Accepted: 2 November 2020 / Published: 4 November 2020
(This article belongs to the Special Issue Recent Advances in Karstic Hydrogeology)

Abstract

:
Karst aquifers hold important water resources such as regional water budgets and freshwater supply. Due to highly dynamic hydrological processes in comparison to other less permeable systems, they are particularly susceptible to environmental changes. However, little research directly characterizes the impacts of climate and vegetation cover changes on karst water sources. In this study, we aimed to evaluate individual long-term impacts and impacts of sudden large-scale forest disturbances on changes in groundwater recharge and in spring discharge. The work is based on temporal analysis of forest cover and a comparison of trend analysis of hydro-meteorological parameters. To investigate and evaluate vegetation cover change impacts on groundwater recharge, we used a soil water balance model and compared estimated actual daily values of effective precipitation to its fictional estimation disregarding the vegetation cover change. The applied methodology enabled quantification of the impacts of climate and vegetation cover change on selected karst water sources. The study suggests that the vegetation cover can have a significant impact on the spring recharge. Large-scale disturbances that occurred in a short-term mitigated the effects expected from the trend analysis of hydro-meteorological parameters. In the long-term, in addition to climate changes, the multi-decadal natural vegetation overgrowth significantly contributed to the reduction in the spring’s discharge values, especially in the warm season when water demand is higher. Therefore, the results are of key importance for developing proper water management and environmental policies.

Graphical Abstract

1. Introduction

The importance of aquifers with karst porosity, which already supply around a quarter of the global needs for drinking water, is gradually increasing [1]. This proportion even exceeds half of the demand of individual countries in the areas of the Dinaric Karst [2], the largest contiguous karst region in Europe [3], and in the Alps. These areas are mostly covered by forest and are important for its rich and unique (underground) ecosystems [4,5].
Due to the dissolution of the host rock, the karst surface is very permeable, the soil cover is usually clayey, very thin or even absent. Characteristic features are the immediate infiltration of rainwater or melted water from snow into the underground and the sinking of streams that drain the adjacent non-karst areas, while surface runoff is often negligible [6]. Most water in karst aquifers is transported through a network of solution conduits, which evolve along discontinuities in primary fissured aquifer [7,8,9]. Thus, fast diffuse and concentrated infiltration, high heterogeneity and anisotropy, mainly conditioned by the position of conduits and fast transport from inputs to the springs, is characteristic. A specificity of karst hydrology is the great variability in flow and thus transport processes as a function of temporal hydrological conditions [10,11], which can have practical implications for groundwater abstraction in terms of adequate quantity and quality.
Clear evidence shows that radiative forcing by anthropogenic greenhouse gases has affected the global water cycle in many ways [12], especially the alternation in the water balance elements. Observed records and climate simulations of some meteorological variables show increasing trends worldwide (e.g., temperature, evapotranspiration) [13,14] and shifts in precipitation patterns, something which affects discharge quantities [15,16,17] and regimes of rivers and springs [18,19]. These changes may, therefore, even intensify the high variability of flow and transport in karst. Long-term effects with a decrease in water resource quantities and short-term effects with the increasing frequency of extreme events (e.g., floods, droughts) have already been observed in karst areas in the Mediterranean, China, Texas and elsewhere [20,21,22,23].
Despite the important role of karst water resources, there are few studies that thoroughly assess their sensitivity to the predicted effects of global climate change. For example, Long and Mahler [24] modelled site-specific hydraulic responses to different climate scenarios. Expectations about the consequences of climate stress on the selected karst spring in the Mediterranean region were made by means of trend analyses [25]. Other studies mainly focus on prediction of future water availability on a global or local scale by hydrological modelling [26,27,28,29,30]. The expected effects are primarily attributed to altered recharge conditions (i.e., decreased precipitation aggravated by increased evaporation or decreased glacier melt runoff) and excessive human interventions (i.e., groundwater abstraction). Ravbar et al. [25] even stress that not only the quantity of spring water, but also its quality, is endangered due to expected climatological changes, especially during flood pulses caused by precipitation events after a long dry period.
Furthermore, changes in weather patterns, especially extreme events, increased CO2 emissions into the atmosphere and the effects of direct anthropogenic activities, such as rapid urbanization and industrialization, can lead to abrupt changes in vegetation cover [31,32,33,34,35,36]. Although some previous studies have shown that the soil and vegetation mantle plays an important role in the infiltration and storage of water in karst systems [37], hydrological functions of soil and vegetation layers in the hydrological cycle have been only marginally considered or even underestimated in the investigation of future hydrological processes in karst. The main reasons for this should be sought in poorly studied and understood infiltration mechanisms of soil and vegetation layers and their hydrological relationships with the overall groundwater recharge [38,39].
Changes in vegetation cover that, for example, include afforestation or natural overgrowth, deforestation, large-scale forest disturbances due to drought, ice breakage, natural fires, windthrows, and bark beetle infestation, may substantially influence the water balance through altered evapotranspiration and filtration, and thus influence the quantity and quality of water resources and underground habitats [40,41,42,43,44,45,46,47,48,49]. This may be especially problematic in large parts of the Middle-European karst areas that have been reforested in the last century and a half [37,50]. In some cases, the spruce forest has been favored due to its economic values, which is particularly susceptible to windthrow and bark beetle infestation [51,52]. In tropical and sub-tropical areas, strong soil erosion and rocky desertification may also occur as a consequence (e.g., [53,54]).
This leads to the need to assess the role of vegetation in recharge dynamics and intensify studies on differentiating the effects of climate and land cover changes on hydrological processes in karst. These issues will be addressed in the present study, which: (1) focuses on a catchment scale; (2) was done on a very well-studied test sites with a large amount of historical meteorological and hydrological data of high temporal resolution; (3) aimed to assess the direct impact of changes in climate and vegetation cover on karst water sources. More specifically, the aim of the study was to compare long- and short-term changes in groundwater recharge (i.e., effective precipitation) and in spring discharge, thus assessing the response of a karst aquifer to climate and vegetation cover changes.

2. Materials and Methods
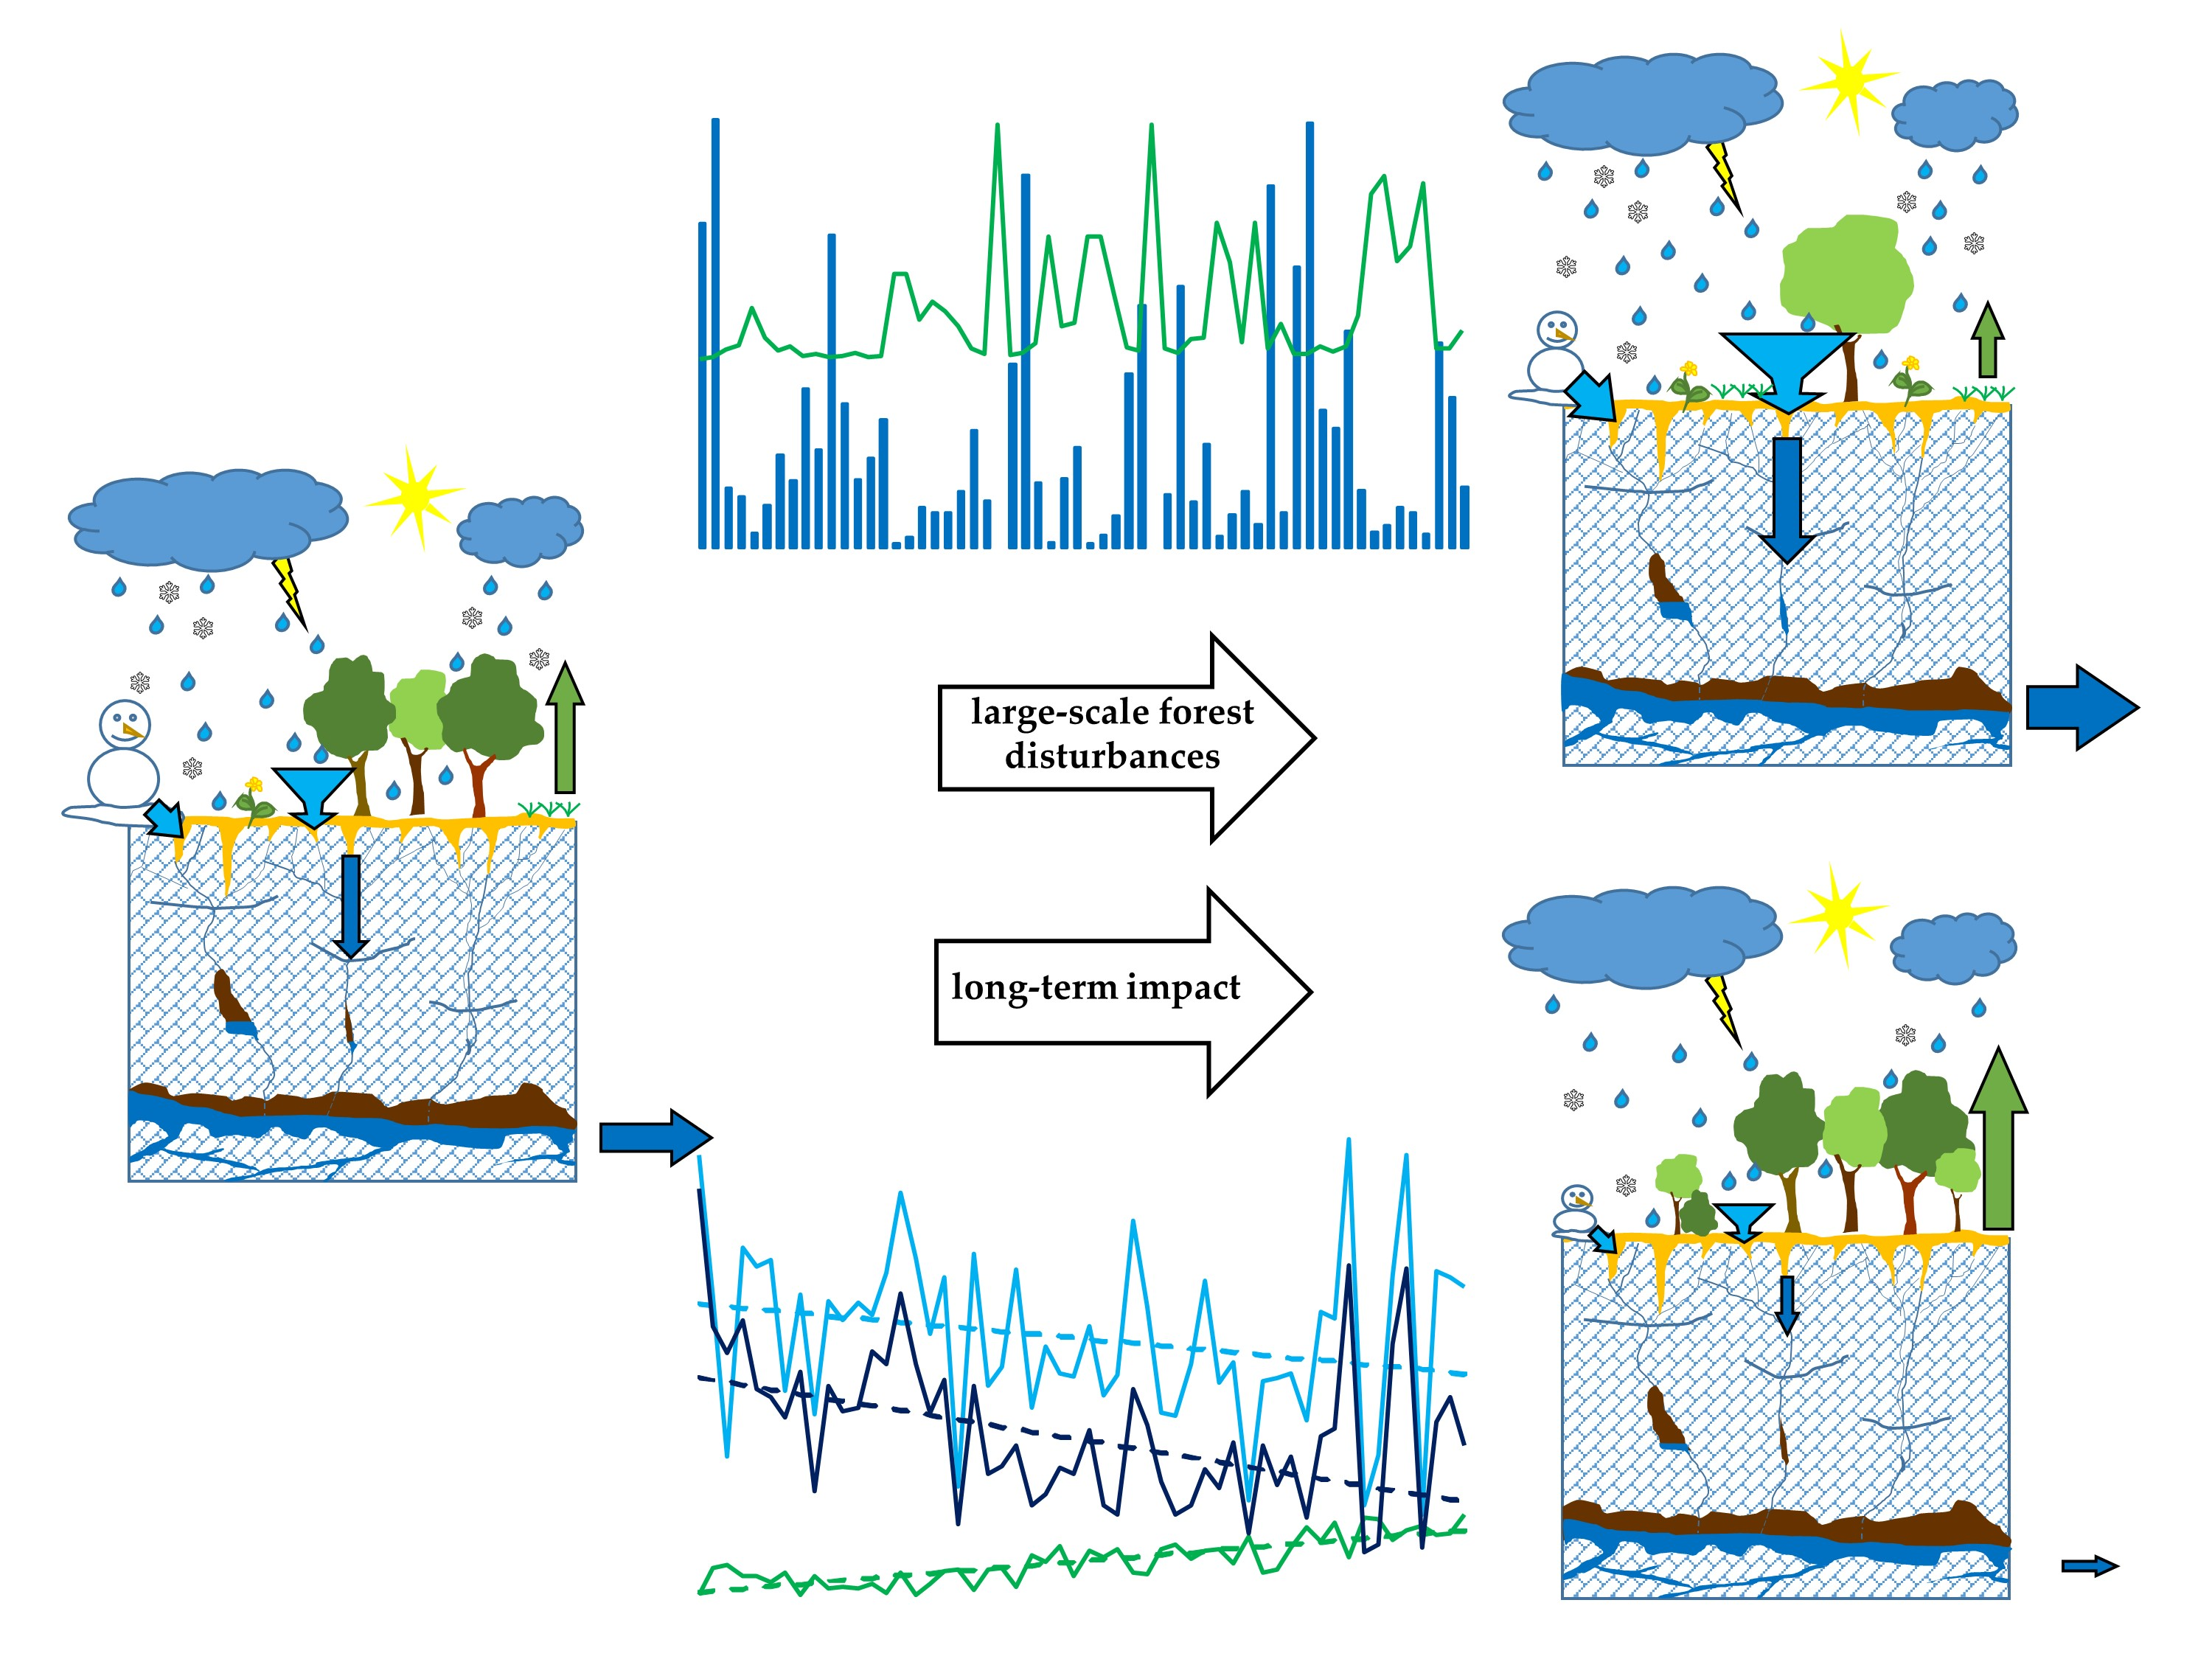
2.1. Study Areas

Two binary karst catchments in SW Slovenia have been selected as representative cases for the study (Figure 1, Table 1). The catchment area of the Unica karst springs enabled the study of the effects of large-scale forest disturbances (i.e., ice breakage, bark beetle infestation, windthrow) in the period 2014–2018 on the discharge conditions of the springs. The catchment area of the Rižana karst spring has been influenced by climate and land use changes over the last six decades and enabled studies of their long-term effects.
The catchment of the Unica springs extends over 800 km2 and embraces three distinctive subcatchments [55,56,57]; karst poljes of the Notranjska, the Pivka River basin at altitudes between 500 and 700 m, and the Javornik-Snežnik karst plateau, which reaches an altitude of 1800 m. In the first two subcatchments, dominant rock types are dolomite or flysch covered with eutric brown soils, which induce surface runoff that is part of the catchment area of the investigated spring. On the karst plateau, highly karstified limestone with very thin rendzinas or brown calcareous soil prevails, which conditions the direct infiltration of precipitation underground [58]. The catchment belongs to the moderate continental climate and is mostly covered with Abieti-Fagetum dinaricum forests. A greater concentration of settlements, industry and agricultural activities is at the bottom of the karst poljes and in the Pivka basin. The flow rates of the Unica River in the period 1989–2018 were between 1 and 90 m3/s, while the mean flow rate was 21 m3/s [59]. The average annual precipitation in the same period was estimated at 1505 mm, the average annual potential evapotranspiration (ETP) at 738 mm, the average annual runoff at 767 mm and the average annual runoff ratio at 0.51 [60].
The catchment of the Rižana spring is estimated at 247 km2 [61,62]. The predominant part cover highly karstified limestones and rendzina soil. The area is mainly forested with Orno-Quercetum petraeae-pubescentis. The spring is also recharged by the sinking rivers at the southern margin of the flysch Brkini Hills, where distric brown soils prevail. The location of the spring is at an altitude of 70 m while the catchment lies at between 500 and 1000 m altitudes. The area mainly belongs to the moderate Mediterranean climate. The flow rates of the Rižana River in the period 1989–2018 were between 70 L/s and 63 m3/s, while the mean flow rate was 3.5 m3/s [59]. The average annual amount of precipitation in the same period was 1484 mm, the average annual ETP was 892 mm, the average annual runoff was 592 mm and the average annual runoff ratio 0.4 [60].

2.2. Input Data

Meteorological and hydrological data were obtained from the archive of the Slovenian Environment Agency’s website [59,60]. For analysis of the Unica springs catchment, data on total monthly and annual precipitation and ETP from the Postojna meteorological station and data on monthly and annual characteristic discharges from the gauging station Hasberg on the Unica River for the period 1962–2018 (57 years) were used. For analysis of the Rižana spring catchment, data on total monthly and annual precipitation from the Podgrad precipitation station and data on monthly and annual characteristic discharges from the gauging station Kubed II on the Rižana River for the period 1965–2018 (54 years) were used. Data on total monthly and annual ETP for the Podgrad meteorological station was calculated as a mean value regarding data from the Postojna and Portorož–Airport meteorological stations. Podgrad precipitation station lies outside the Rižana spring catchment, yet it is the most representative one for the catchment. ETP is not a directly measured meteorological variable, but is calculated by the widely used Penman–Monteith equation recommended by FAO, including daily data on maximum and minimum air temperature, relative humidity, global net radiation and wind speed [63]. For the assessment of effective precipitation (Pef) in the Rižana and Unica catchments in the period 2014–2018, daily data on precipitation, snow cover depth, air temperature, average wind speed, relative humidity, and sunshine hours from the Postojna, Portorož–Airport and Kozina meteorological stations were used. For rain events within individual days, an average rain intensity was defined on the basis of precipitation data at 30-min intervals from the stations Postojna and Portorož–Airport.
Vegetation cover data were obtained from the historical digital orthophotographs from 1957 and recent national database on land use from 2013 and from 2018 [64]. Data on growing stock for the period 2014–2018 were provided by Slovenia Forest Service (unpublished data) and data on soil characteristics were extracted from soil maps [65].

2.3. Data Processing

2.3.1. Statistical Analysis

In the study, significant trends of change in meteorological and hydrological variables were determined using the non-parametric Mann–Kendall method [66,67], as it is distribution-free, more robust to outliers, and has a higher power than many other commonly used tests [68]. For the true slope of an existing trend (as change per year) the non-parametric Sen’s slope method (the Theil-Sen estimator) was used, which is one of the most commonly used tests for estimating linear time trends [69,70,71,72,73]. Slope estimator (β) as a measure of trend magnitude is calculated as the median value over all pairs of points in the time series [68]. Since this approach is more robust to outliers, compared to the standard linear regression, it has been widely used in identifying the slope of the trend lines of meteorological and hydrological time series (e.g., [12,74,75,76,77,78,79,80,81,82,83,84]). In the present study, we consider results of the trend analysis as statistically significant in cases where p-value exceeds 0.1. One exception refers to the mean annual discharge of the Unica River in the period 1962–2018, where we consider the p-value of 0.1084 as statistically significant, too. Further explanation can be found in the Section 3.1 and a more detailed explanation in the Supplementary Materials.

2.3.2. Vegetation Cover Changes Analysis

In the Unica catchment, the primary focus were effects of large-scale forest disturbances such as ice breakage, bark beetle infestation and windthrow that occurred in the period 2014–2018. For these purposes, a national database on land use for the years 2013 and 2018 was used. However, according to these maps, the forest area in the catchment area of Unica springs remained practically the same in the period 2014–2018. Therefore, additional information was gathered from the annual data on the growing stock provided by the Slovenia Forest Service. Each forest section with growing stock change was considered as damaged or lost forest area on an annual basis. The gained information was used to evaluate annual reduction in forest density in the observed period. This decrease was taken into account in the assessment of the forest cover in the Unica springs catchment area.
In the Rižana catchment, interest was shown in the long-term effects of changes in vegetation cover to karst spring discharge conditions. Therefore, different categories of land use cover were obtained from digital orthophotographs from 1957 and compared to the recent national database on land use from 2018 [64].
Changes in vegetation cover were determined with the help of ArcGIS 10.7.1 Software (Esri, GDi GISDATA, Ljubljana, Slovenia). The obtained information for both study areas enabled us to distinguish between areas with and without forest.

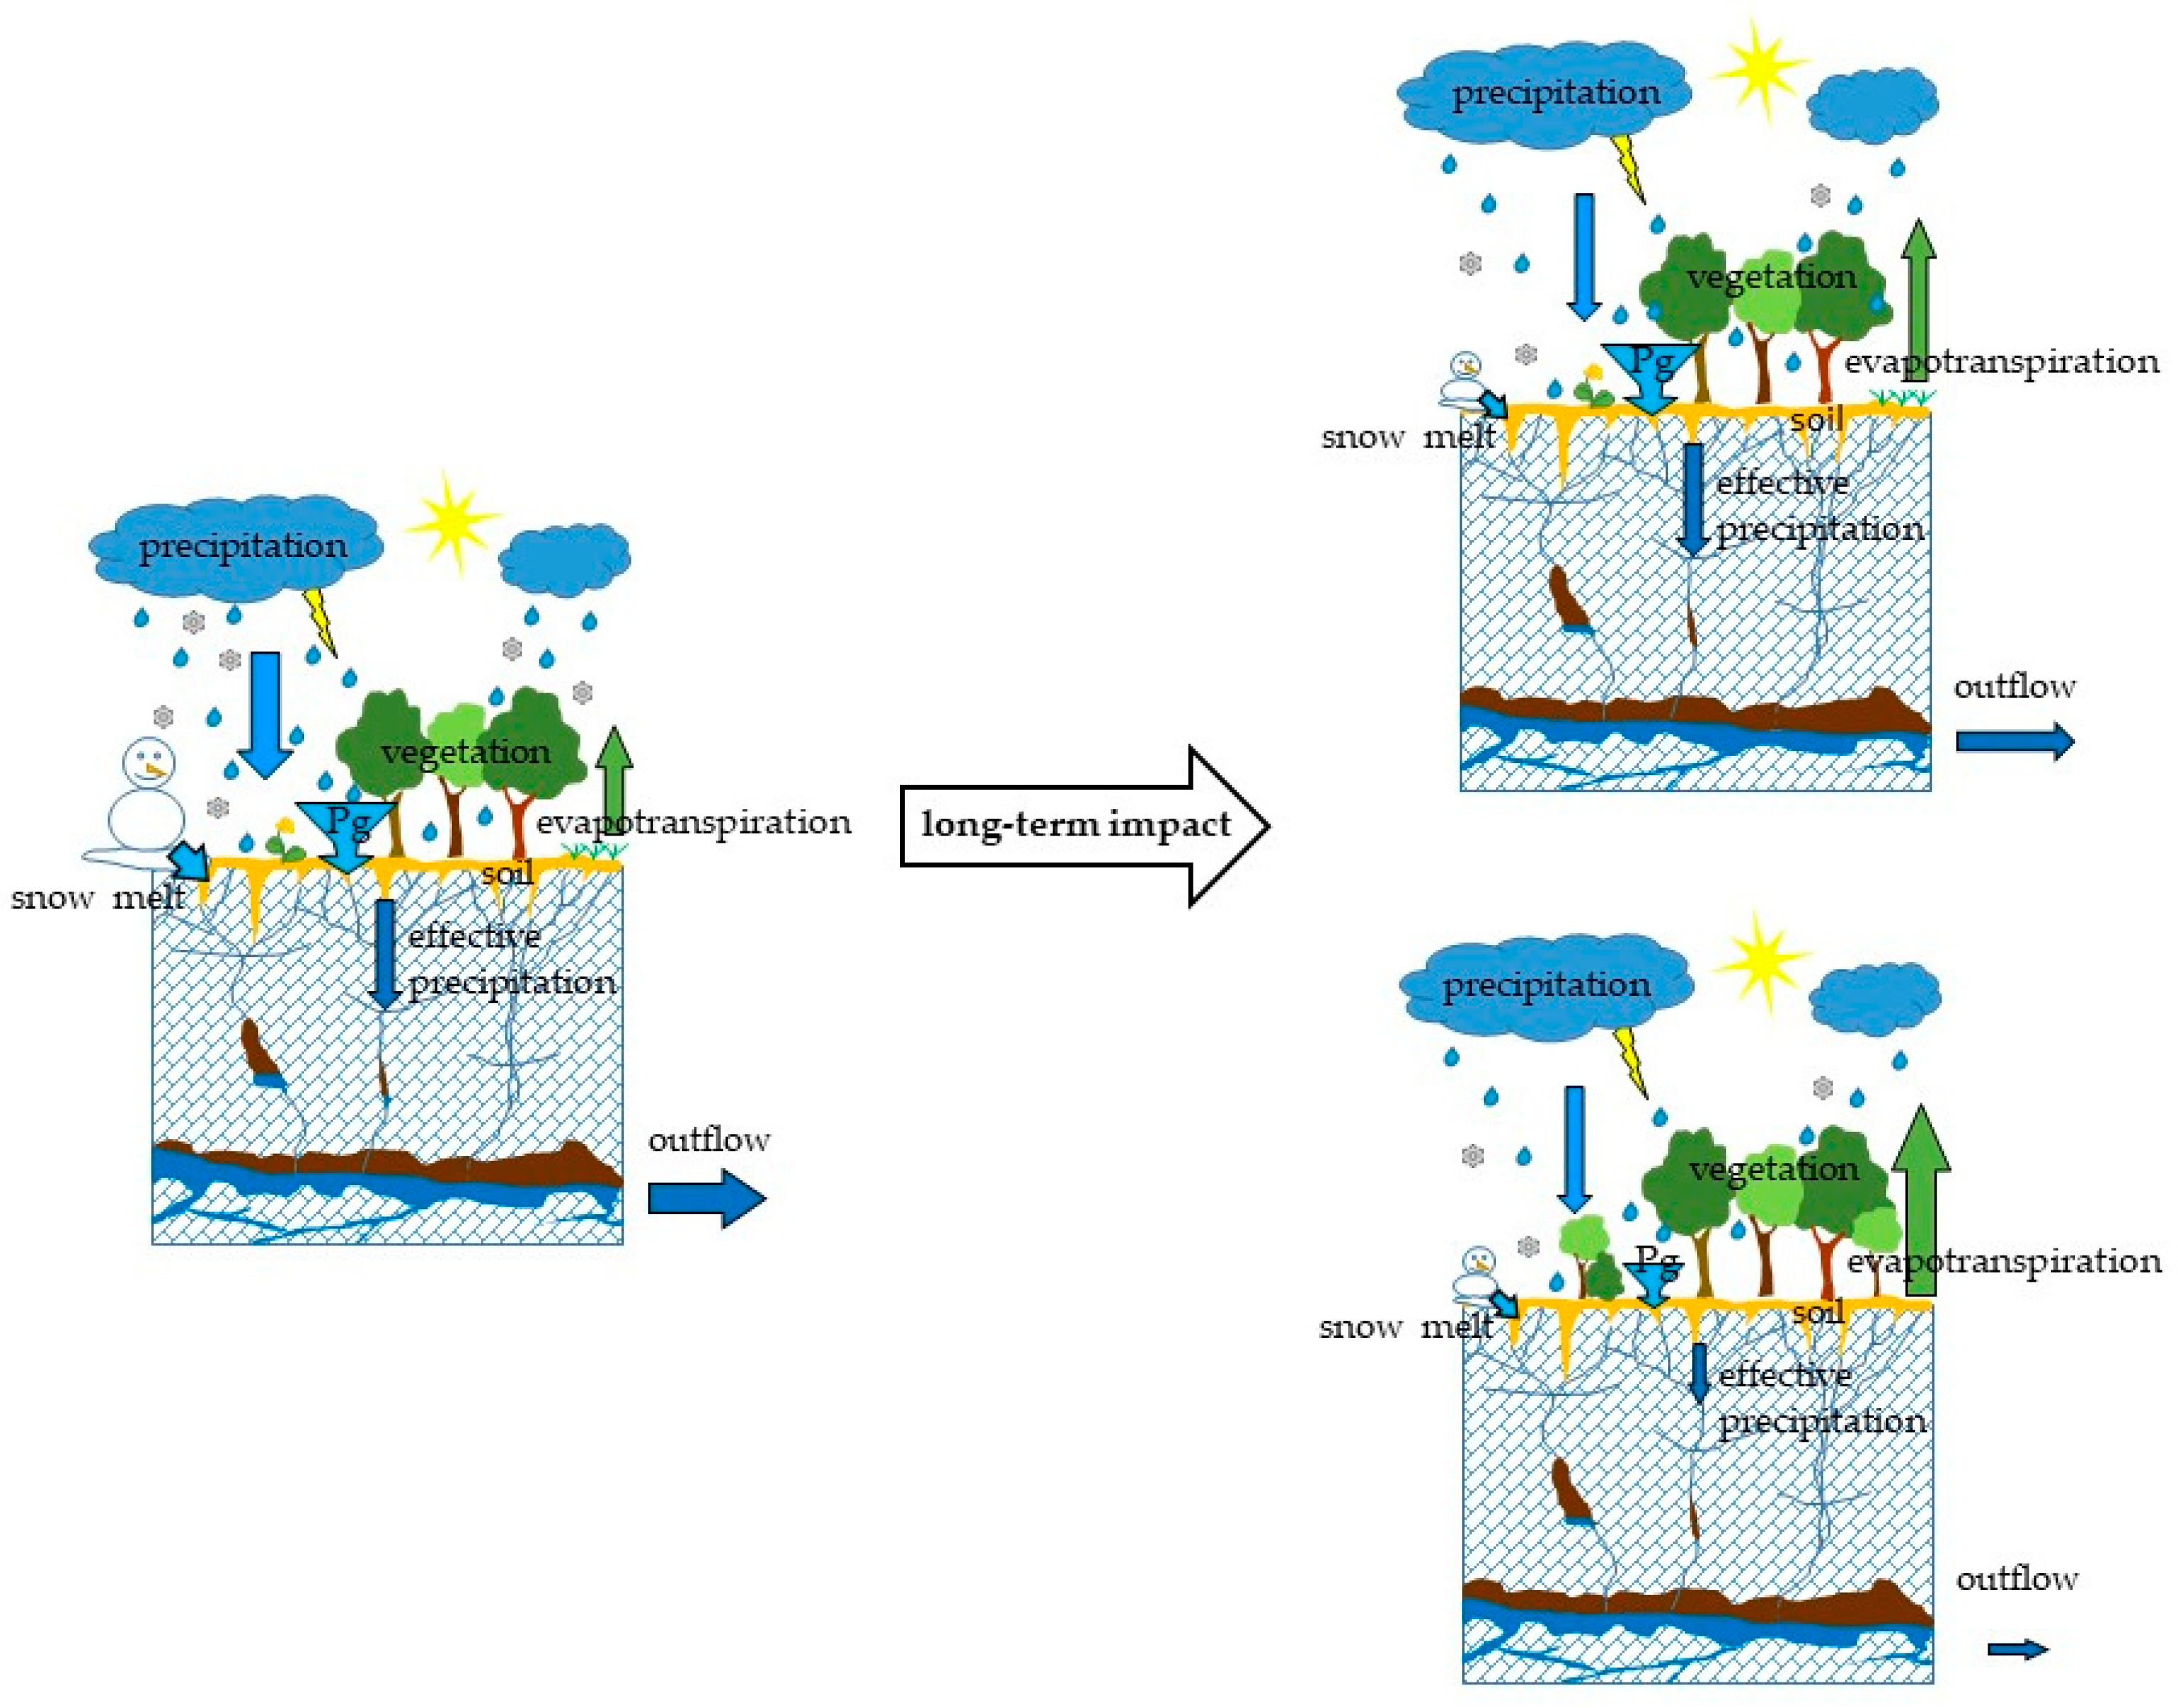
2.3.3. Assessment of the Influence of Changes in Vegetation Cover on the Effective Precipitation

As the main objective of the study was to make a general assessment of whether major changes in vegetation cover cause perceptible changes in the recharge of karst aquifers, and consequently in the discharge of drinking water sources, several existing tools for this assessment have been considered. However, a semi-distributed model VarKarst [85], which simulates karst potential recharge, cannot separate the effects of climate and vegetation cover changes. According to the authors of the LuKARS model [86,87], this semi-distributed model is more practical for catchments of smaller size, and therefore not very suitable for application in catchments of several 100 km2. For the purposes of this study, the V2Karst model [40], which is specified for integrated vegetation-recharge modelling in karst, would be suitable.
Due to the large extent of the study areas, their complex hydrogeological settings and the limited data set available, a soil water balance model was used. This decision also resulted from the fact that the model was first developed and its performance tested in relation to the data obtained in the study of the catchment area of the Vipava karst spring in western Slovenia, which has very similar meteorological, hydrogeological and vegetation characteristics to the two study areas [88,89]. The Pef, which represents the amount of precipitation that actually penetrates from the soil layer into the rock layer, was assessed as an average value for the entire catchment area at daily intervals. Only two basic vegetation types were considered: forest and area without forest. This is acceptable as more than 2/3 of the study areas are covered by forest and the research was focused on the effects of forest cover change. The main equation used was
Pef = Pg + M − ETR − ΔS
The source of water is precipitation, reduced by the amount of precipitation, collected by the vegetation cover (Pg). Under favorable climatic conditions, the additional quantities of water are provided by the snowmelt (M). The actual evapotranspiration (ETR), through which the water is returned to the atmosphere, thus also denotes the amount of water consumption. The relationship between absorption and consumption is influenced by the water storage capacity of the soil, which in turn determines the amount of water that can be stored in it. The change in water storage in the soil is defined by the parameter ΔS.
The precipitation data were corrected for errors due to wind and wetting losses [90]. Interception is defined as the process by which precipitation falls on vegetative surfaces, while loss due to this interception is the proportion of water that returns to the atmosphere by evaporation [91]. For the assessment, we used the conceptual Rutter model [92], which calculates a running water balance of the canopy and tree trunks and separates the areas with and without forest. Experimental data on parameters describing the properties of the canopy and the tree trunks were not available. Therefore, they were introduced into the model as calibration parameters with different values for the foliated and leafless periods. The empirical equations introduced by the US Army Corps of Engineers [93] were used to calculate the amount of snowmelt. They are presented in different forms depending on the precipitation and vegetation conditions.
The modified Penman equation [94] was used to assess ETP. In this way, it was possible to estimate the amount of precipitation reaching the ground, the amount of melted snow and ETP. On the other hand, the evaluation of the ETR and the changes in water storage in the soil depend on the hydrological properties of the soil. The basic soil properties were obtained from the soil maps of the study areas [65], but the soil hydrological parameters were subsequently corrected in the calibration process. The calibration process was based on the general equation of the water budget: water input = water output ± change in storage, where the water input is the volume of water produced by Pef in the recharge area and the water output is the volume of water discharged by the spring within a selected time interval. A certain error has been made in assuming that the change in storage is negligible. However, this simplification was considered acceptable, since the observed interval of 5 years starts and ends with similar hydrological conditions at the end of a recession period with very similar slopes of the recession curve and values of the minimum discharge (Figure S1 in Supplementary Materials). The delineation of the two catchment areas is based on many hydrogeological studies, including numerous tracer tests. Since the directions and characteristics of groundwater flow are well known, the possibility of water balance errors due to overlooked inter-basin groundwater flows in both large catchments is significantly reduced. However, such errors cannot be completely avoided due to the complex structure and functioning of karst aquifers.
The model, which combines all the above-described calculations, was set in a Microsoft Excel file [88]. A more detailed description of the parameters and equations used can be found in the Supplementary Materials.
First, the model was used in the catchment of the Unica springs for the assessment of the impact of large-scale disturbances on effective precipitation. For the period 2014–2018, it was calibrated (more details in Supplementary Materials) based on the actual meteorological, hydrological and land cover data (gradual decrease in forest cover due to large-scale disturbances). The model was then used with the assumption that the large-scale disturbances did not occur. In this way, the calculated notional amount of total Pef was compared with the actual amount.
In the catchment area of the Rižana spring, the model was used to assess the effects of natural vegetation overgrowth on Pef. For the period 2014–2018, it was calibrated (more details in Supplementary Materials) on the basis of the actual meteorological, hydrological and land cover data. Then, it was used under the assumption that natural overgrowth did not occur and the share of forest remained the same as in 1957. In this way, the calculated notional amount of total Pef was compared with the actual amount.

3. Results

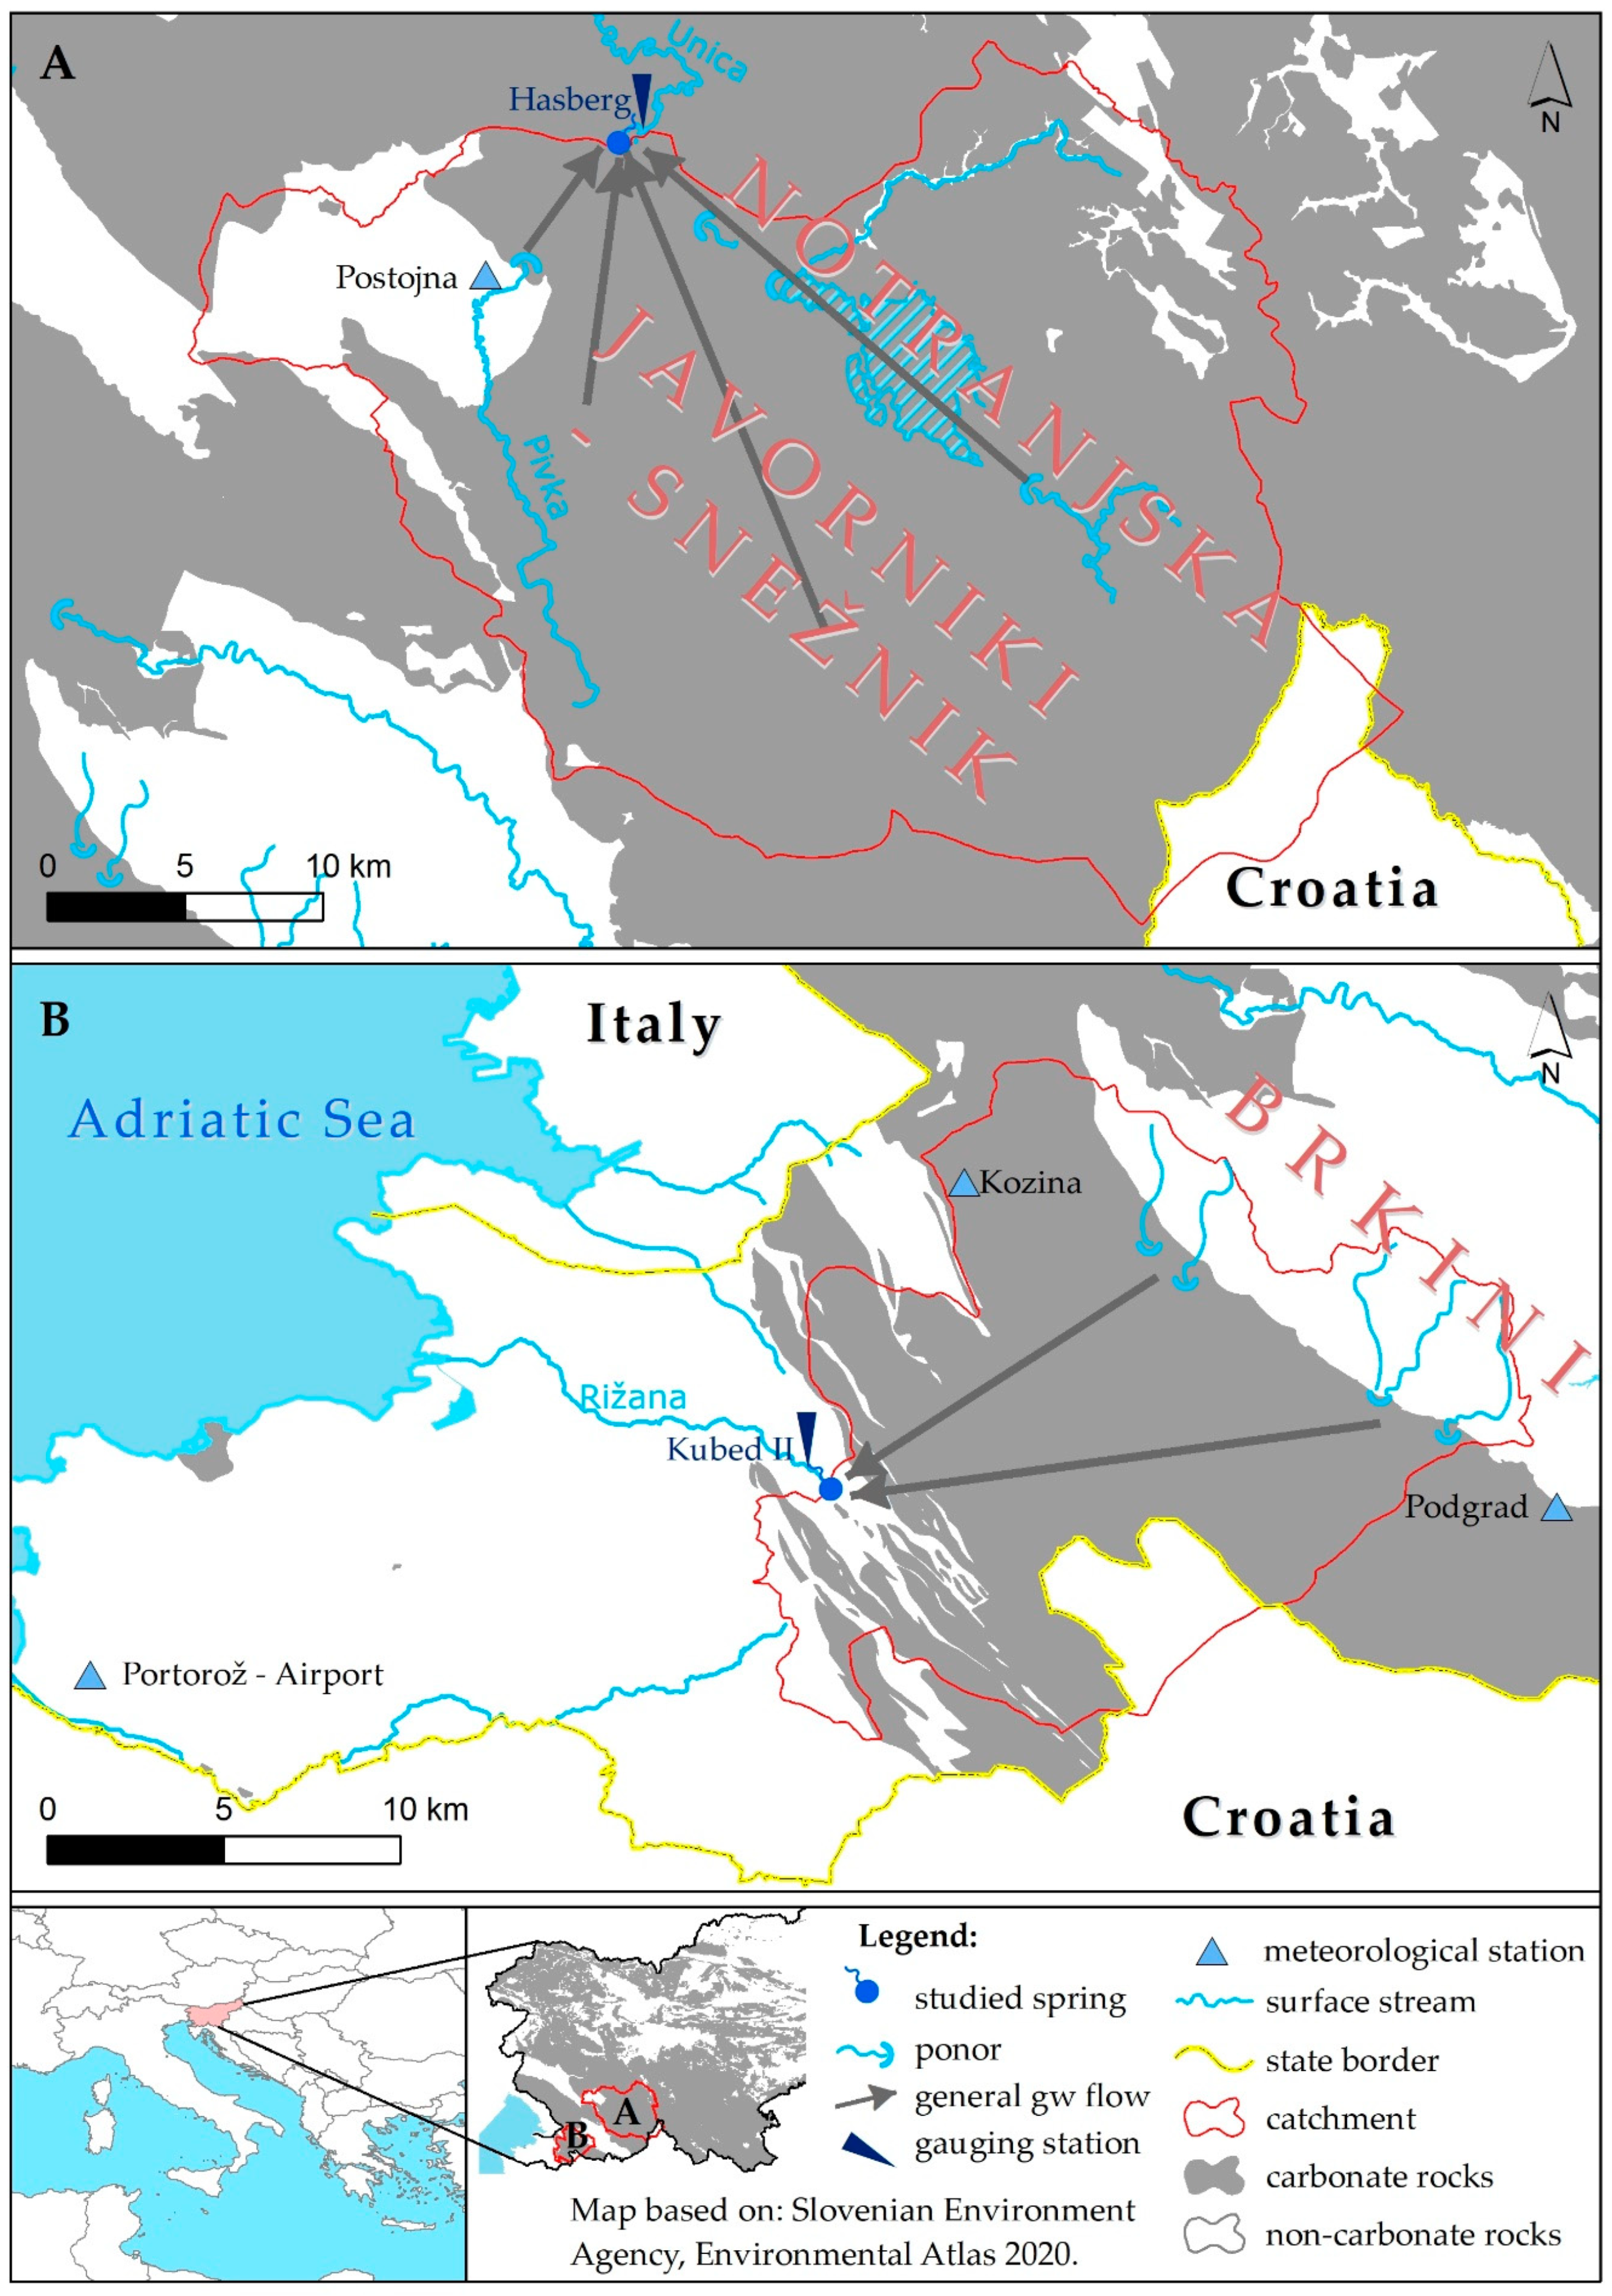
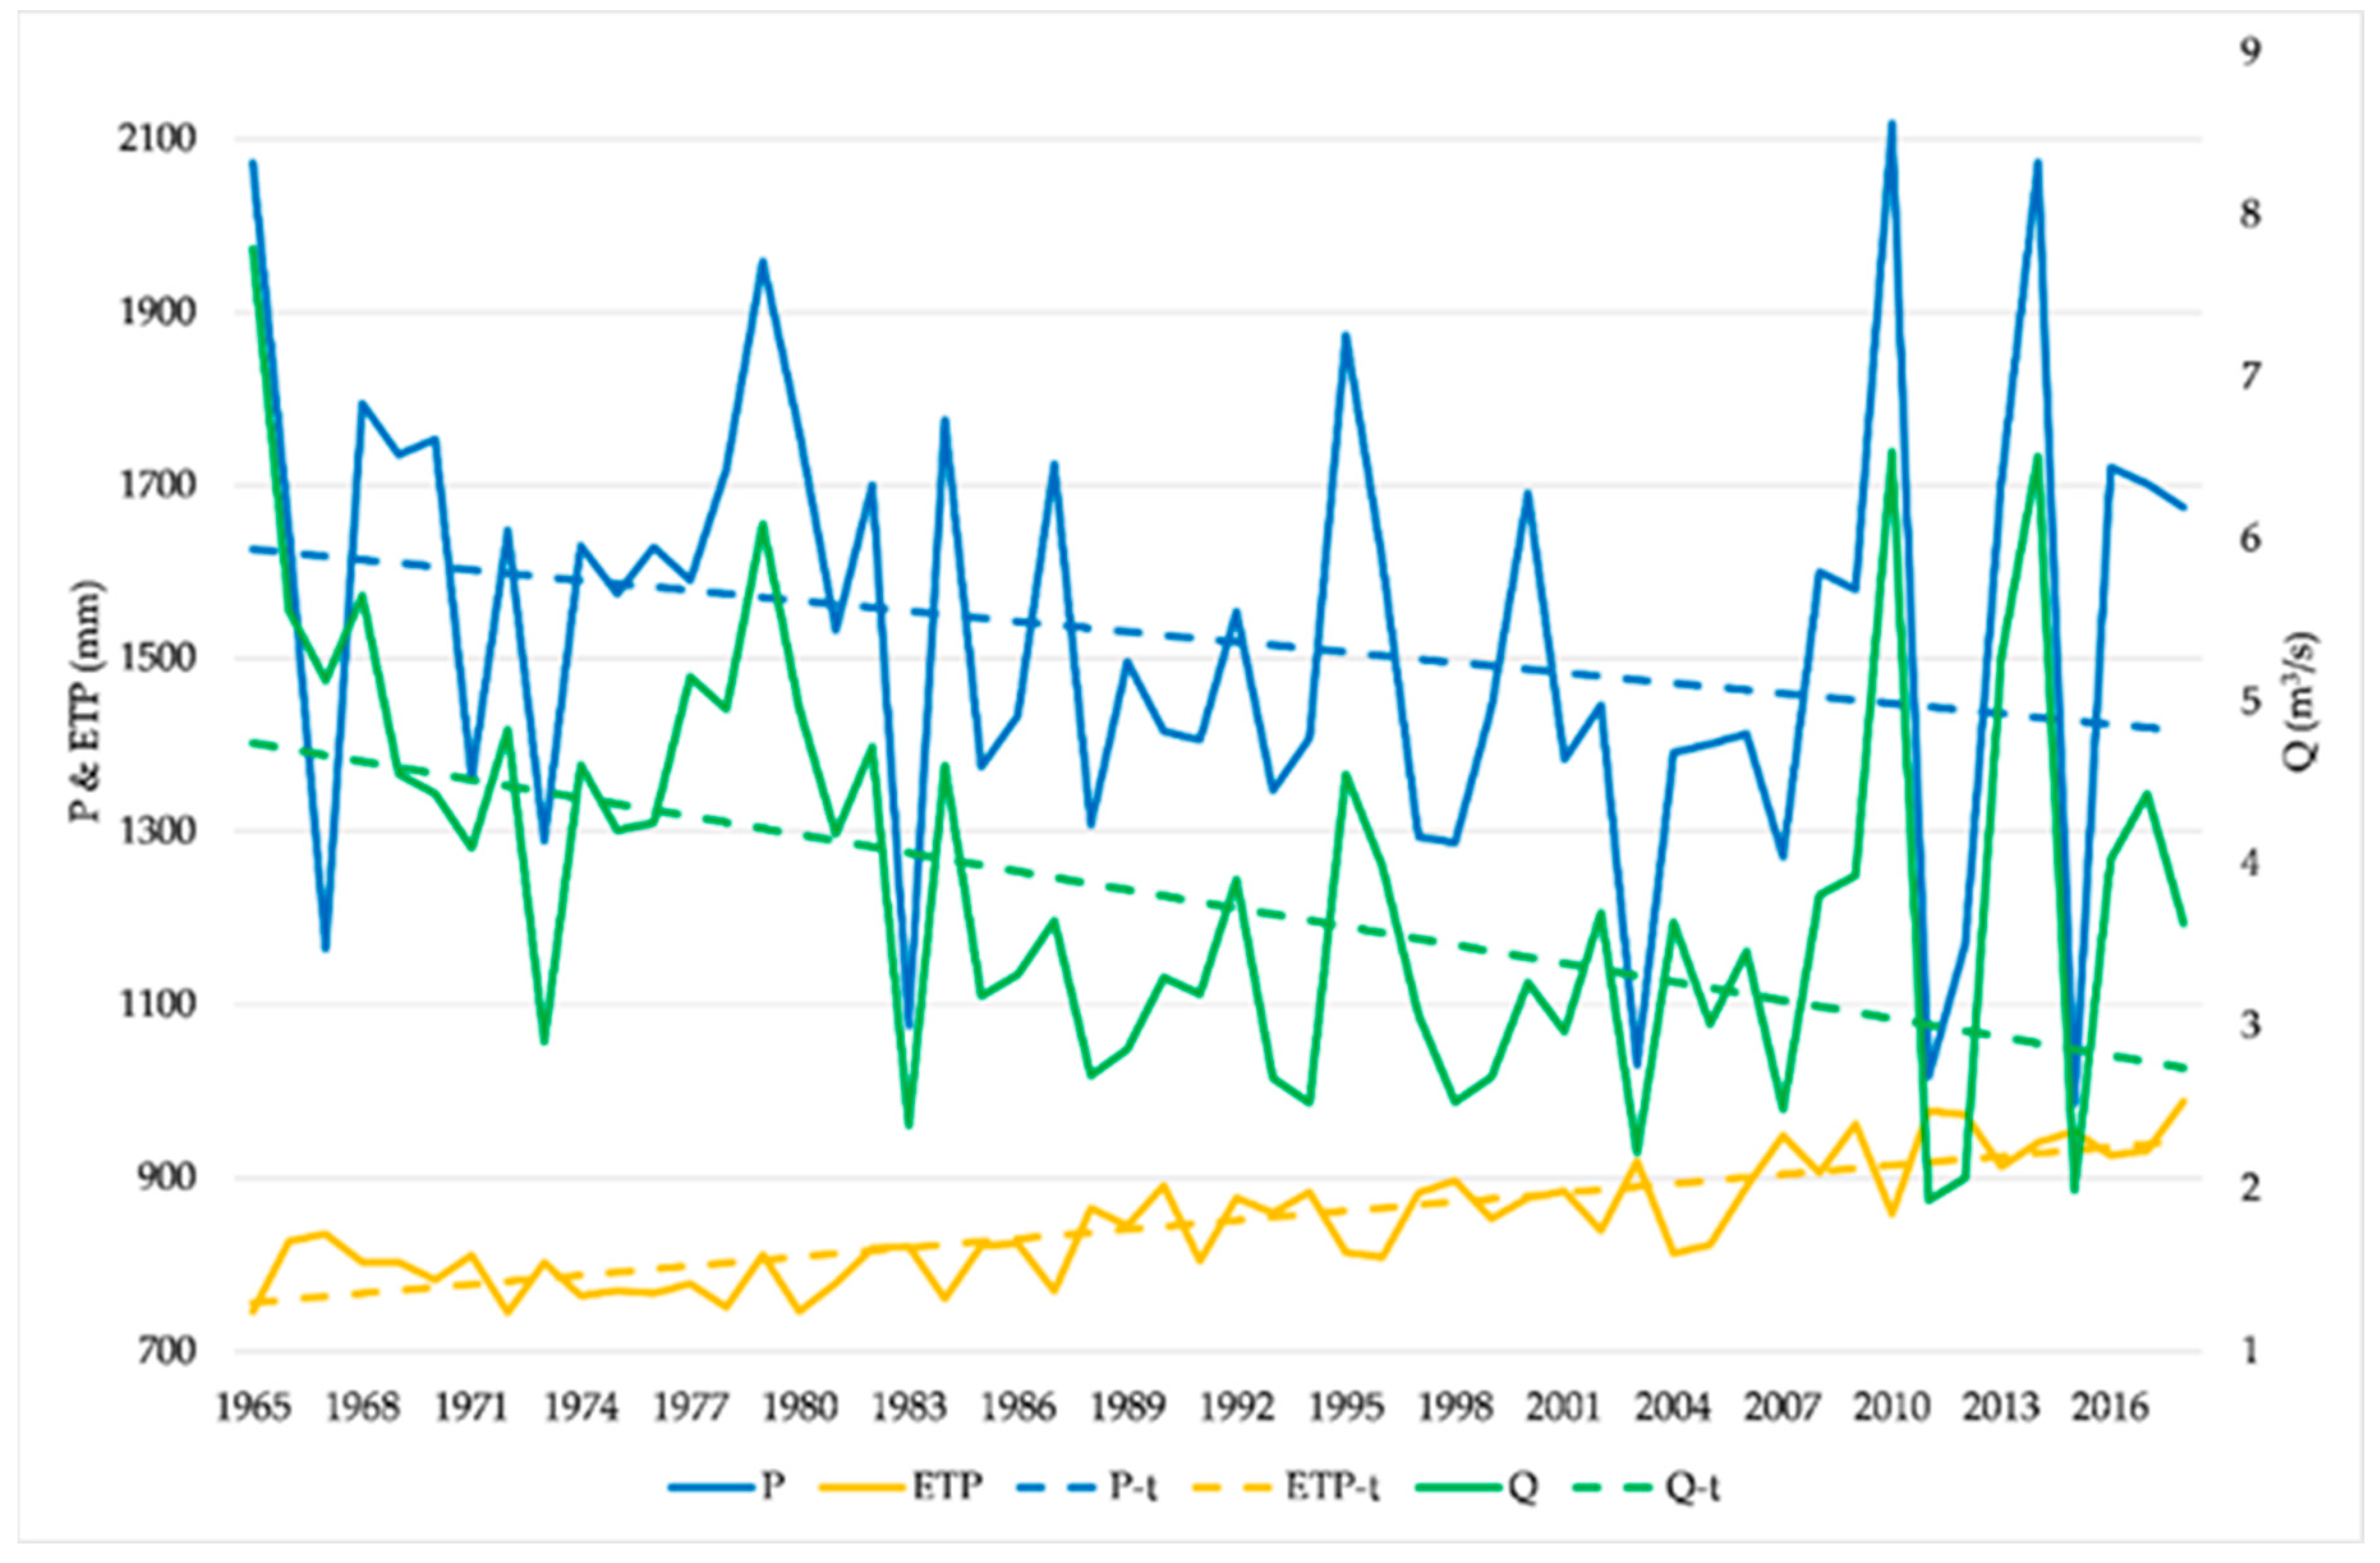
3.1. Trend Analysis of the Hydro-Meteorological Parameters

In case of the Unica River, long-term trend analysis in the period 1962–2018 confirmed statistically significant decreasing trend in annual P (28 mm per decade; p < 0.05), increasing trend in annual ETP (28 mm per decade; p < 0.001) in its catchment.
In the 57-year measuring period (1962–2018; Qmean = 21.967 m3/s) of the mean annual discharge of the Unica River at the Hasberg gauging station (Slovenia), in 2014, a record mean yearly discharge of 40.76 m3/s was measured. This is the only value in the entire observation period that is greater than the sum of (1) the mean value in the period (21.967 m3/s) and (2) the value of three standard deviations (1 SD = 5.82 m3/s; 3 SD = 17.45 m3/s) and thus reaches the value of 40.76 m3/s. The year 2014 was exceptionally wet, which is indicated by the mean annual precipitation height from the Postojna meteorological station (2069 mm). However, the precipitation quantity hardly exceeded the sum of (1) mean annual precipitation in the period 1962–2018 (1537.6 mm) and (2) 2 standard deviations (1 SD = 235.3 mm; 2 SD = 470.7 mm). We assume that the measured discharges of the Unica River were quite high in 2014, which influenced the calculation of a trend, although the used Mann–Kendall method and the non-parametric Sen’s slope methods are not as sensitive to outliers. However, the year 2014 is rather at the end of the observed period and an existence of a high positive outlier at the end of the interval resulted in a p-value of only 0.1084. When we experimented and excluded the year 2014 in the trend calculations (the methodology we used allows this), the p-value of the mean annual discharge of the Unica River was lower than 0.05.
Overall, we decided to consider the mean annual discharge trend of the Unica River as statistically significant. It shows a decreasing trend of 820 L/s per decade (Table 2, Figure 2). Statistically significant are also negative trends of the absolute minimum annual discharge (170 L/s per decade; p < 0.05).
In case of the Rižana River, long-term trend analysis in the period 1965–2018 confirmed a statistically significant increasing trend in annual ETP of 35 mm per decade (p < 0.001) in its catchment, while the decreasing trend in annual P (39 mm per decade) is not statistically significant (Table 2; Figure 3). Long-term changes in values of P and ETP are reflected in the reduced discharge of the Rižana River, for which a statistically significant decreasing trend in mean annual discharge of 380 L/s per decade (p < 0.001) is characteristic (Figure 3). The decreasing trends of the absolute minimum annual discharge (30 L/s per decade; p < 0.001) and a maximum annual discharge (2.75 m3/s per decade; p < 0.05) are statistically significant.

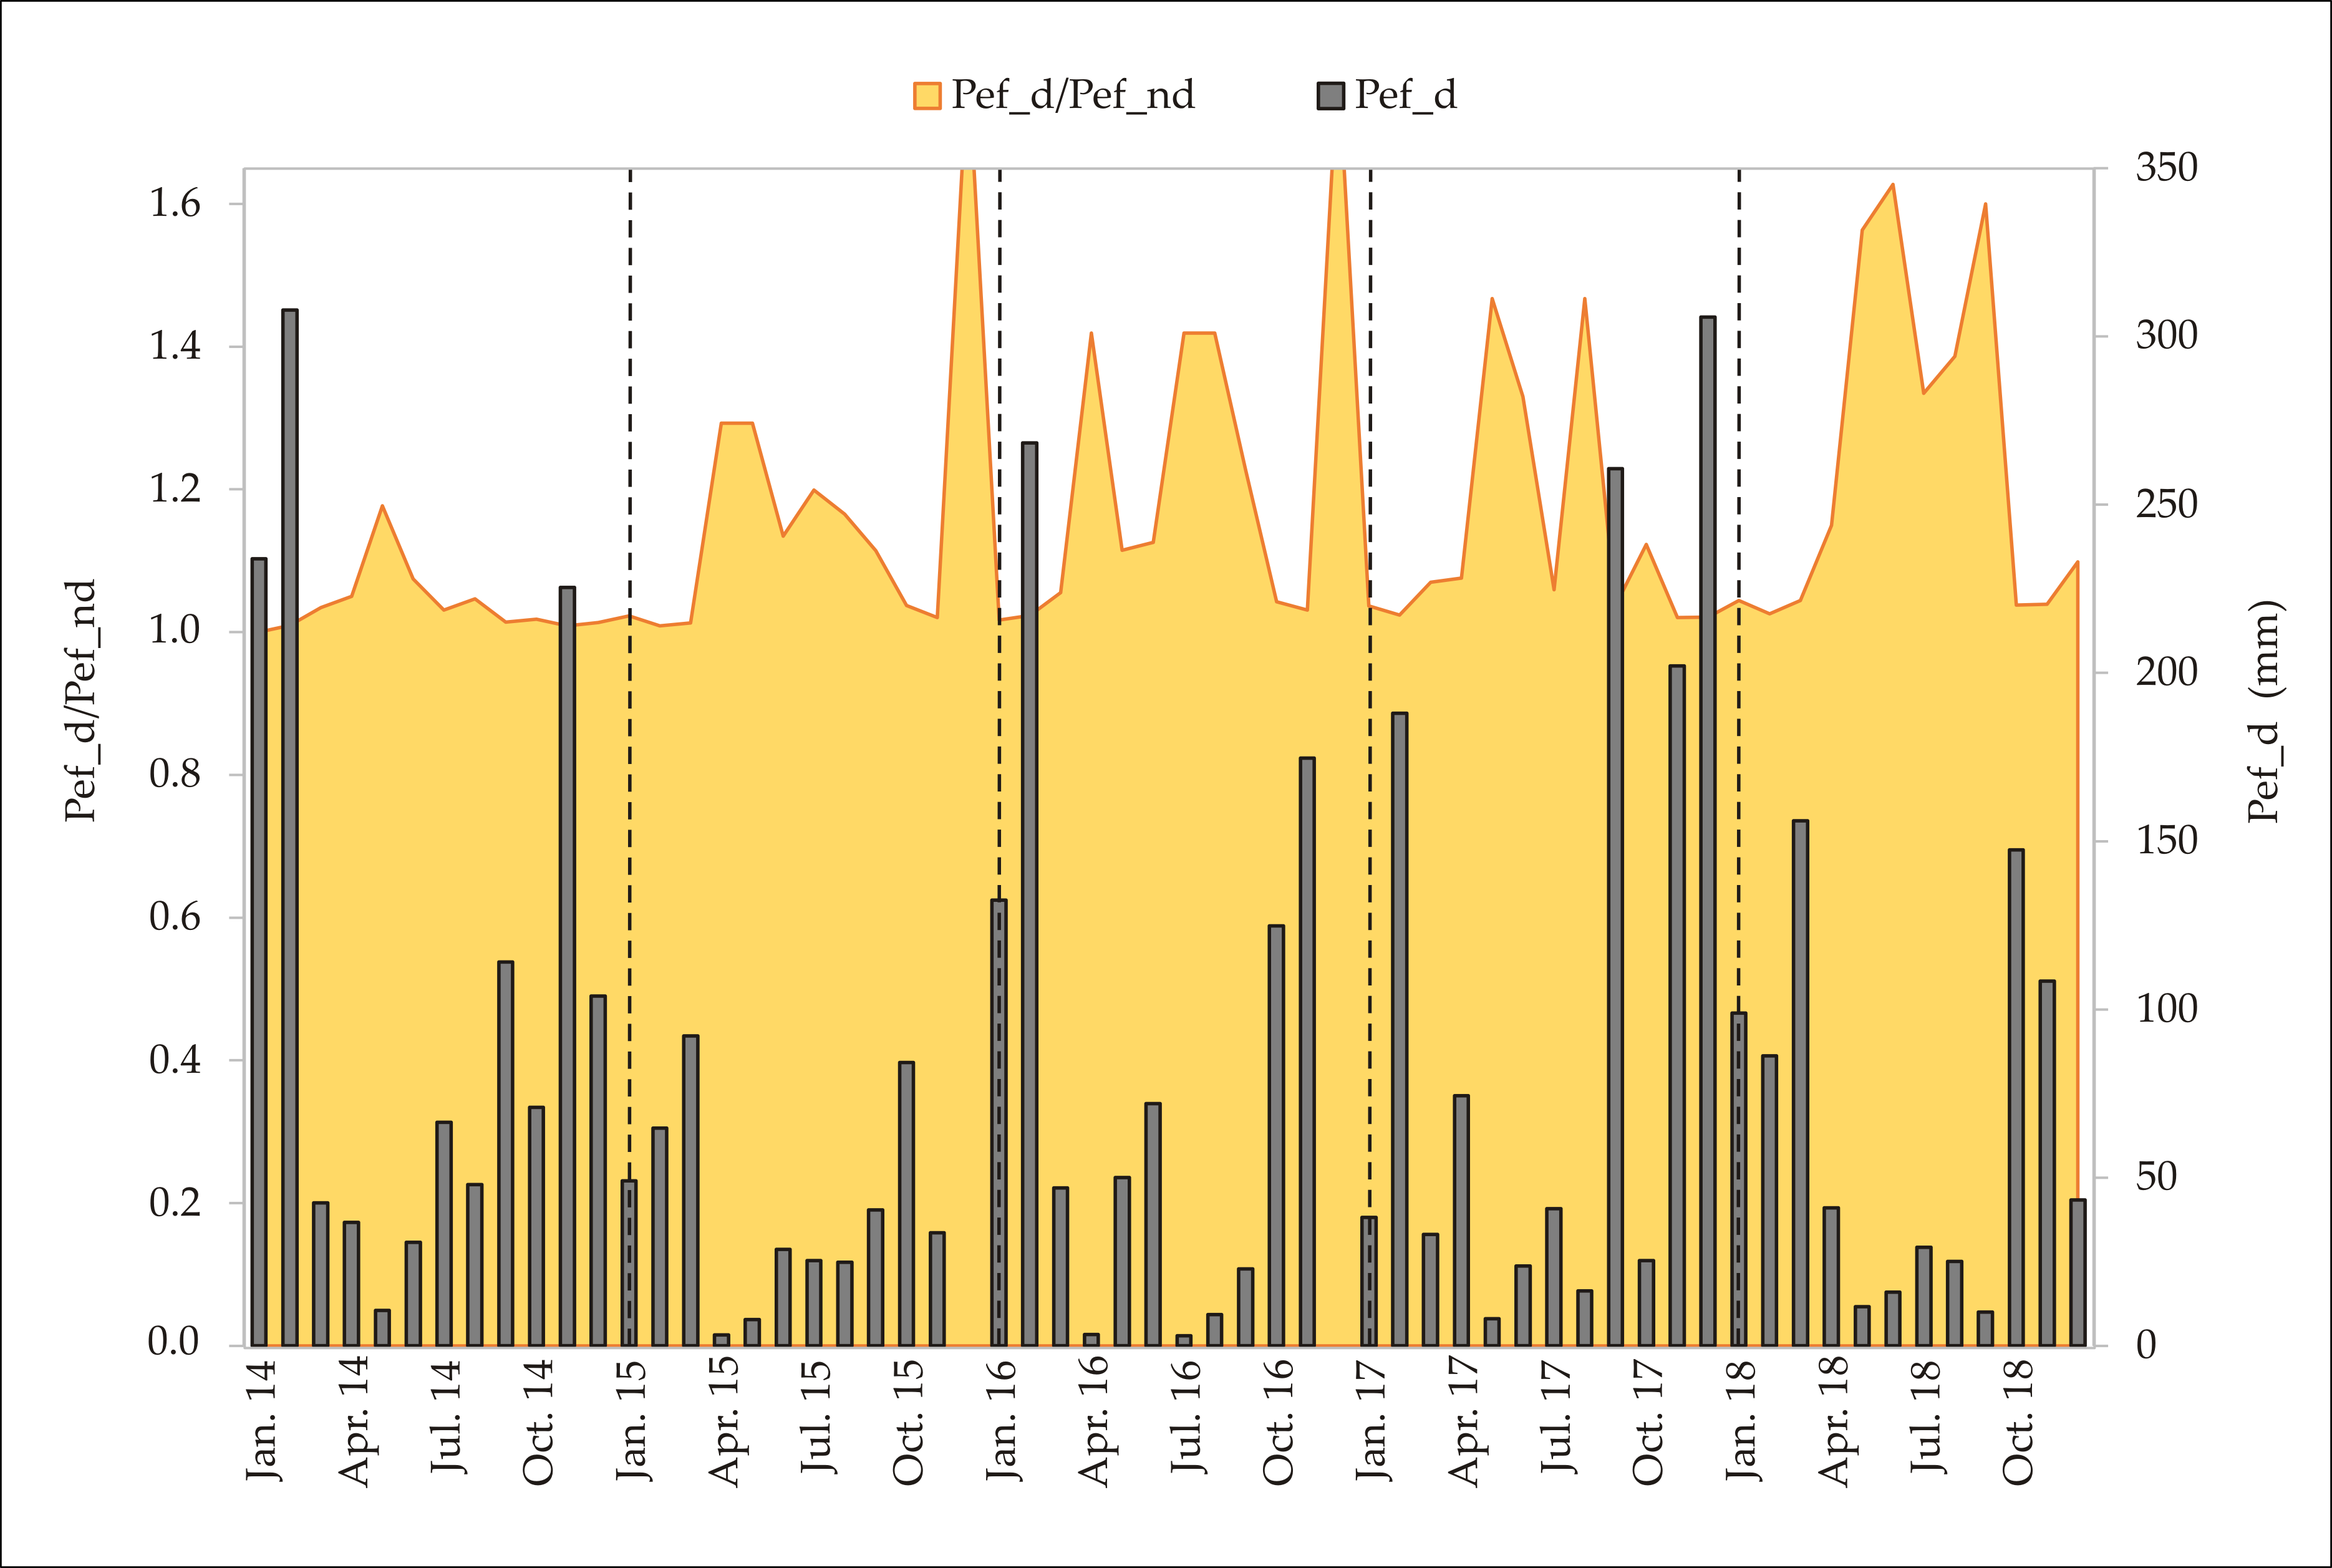
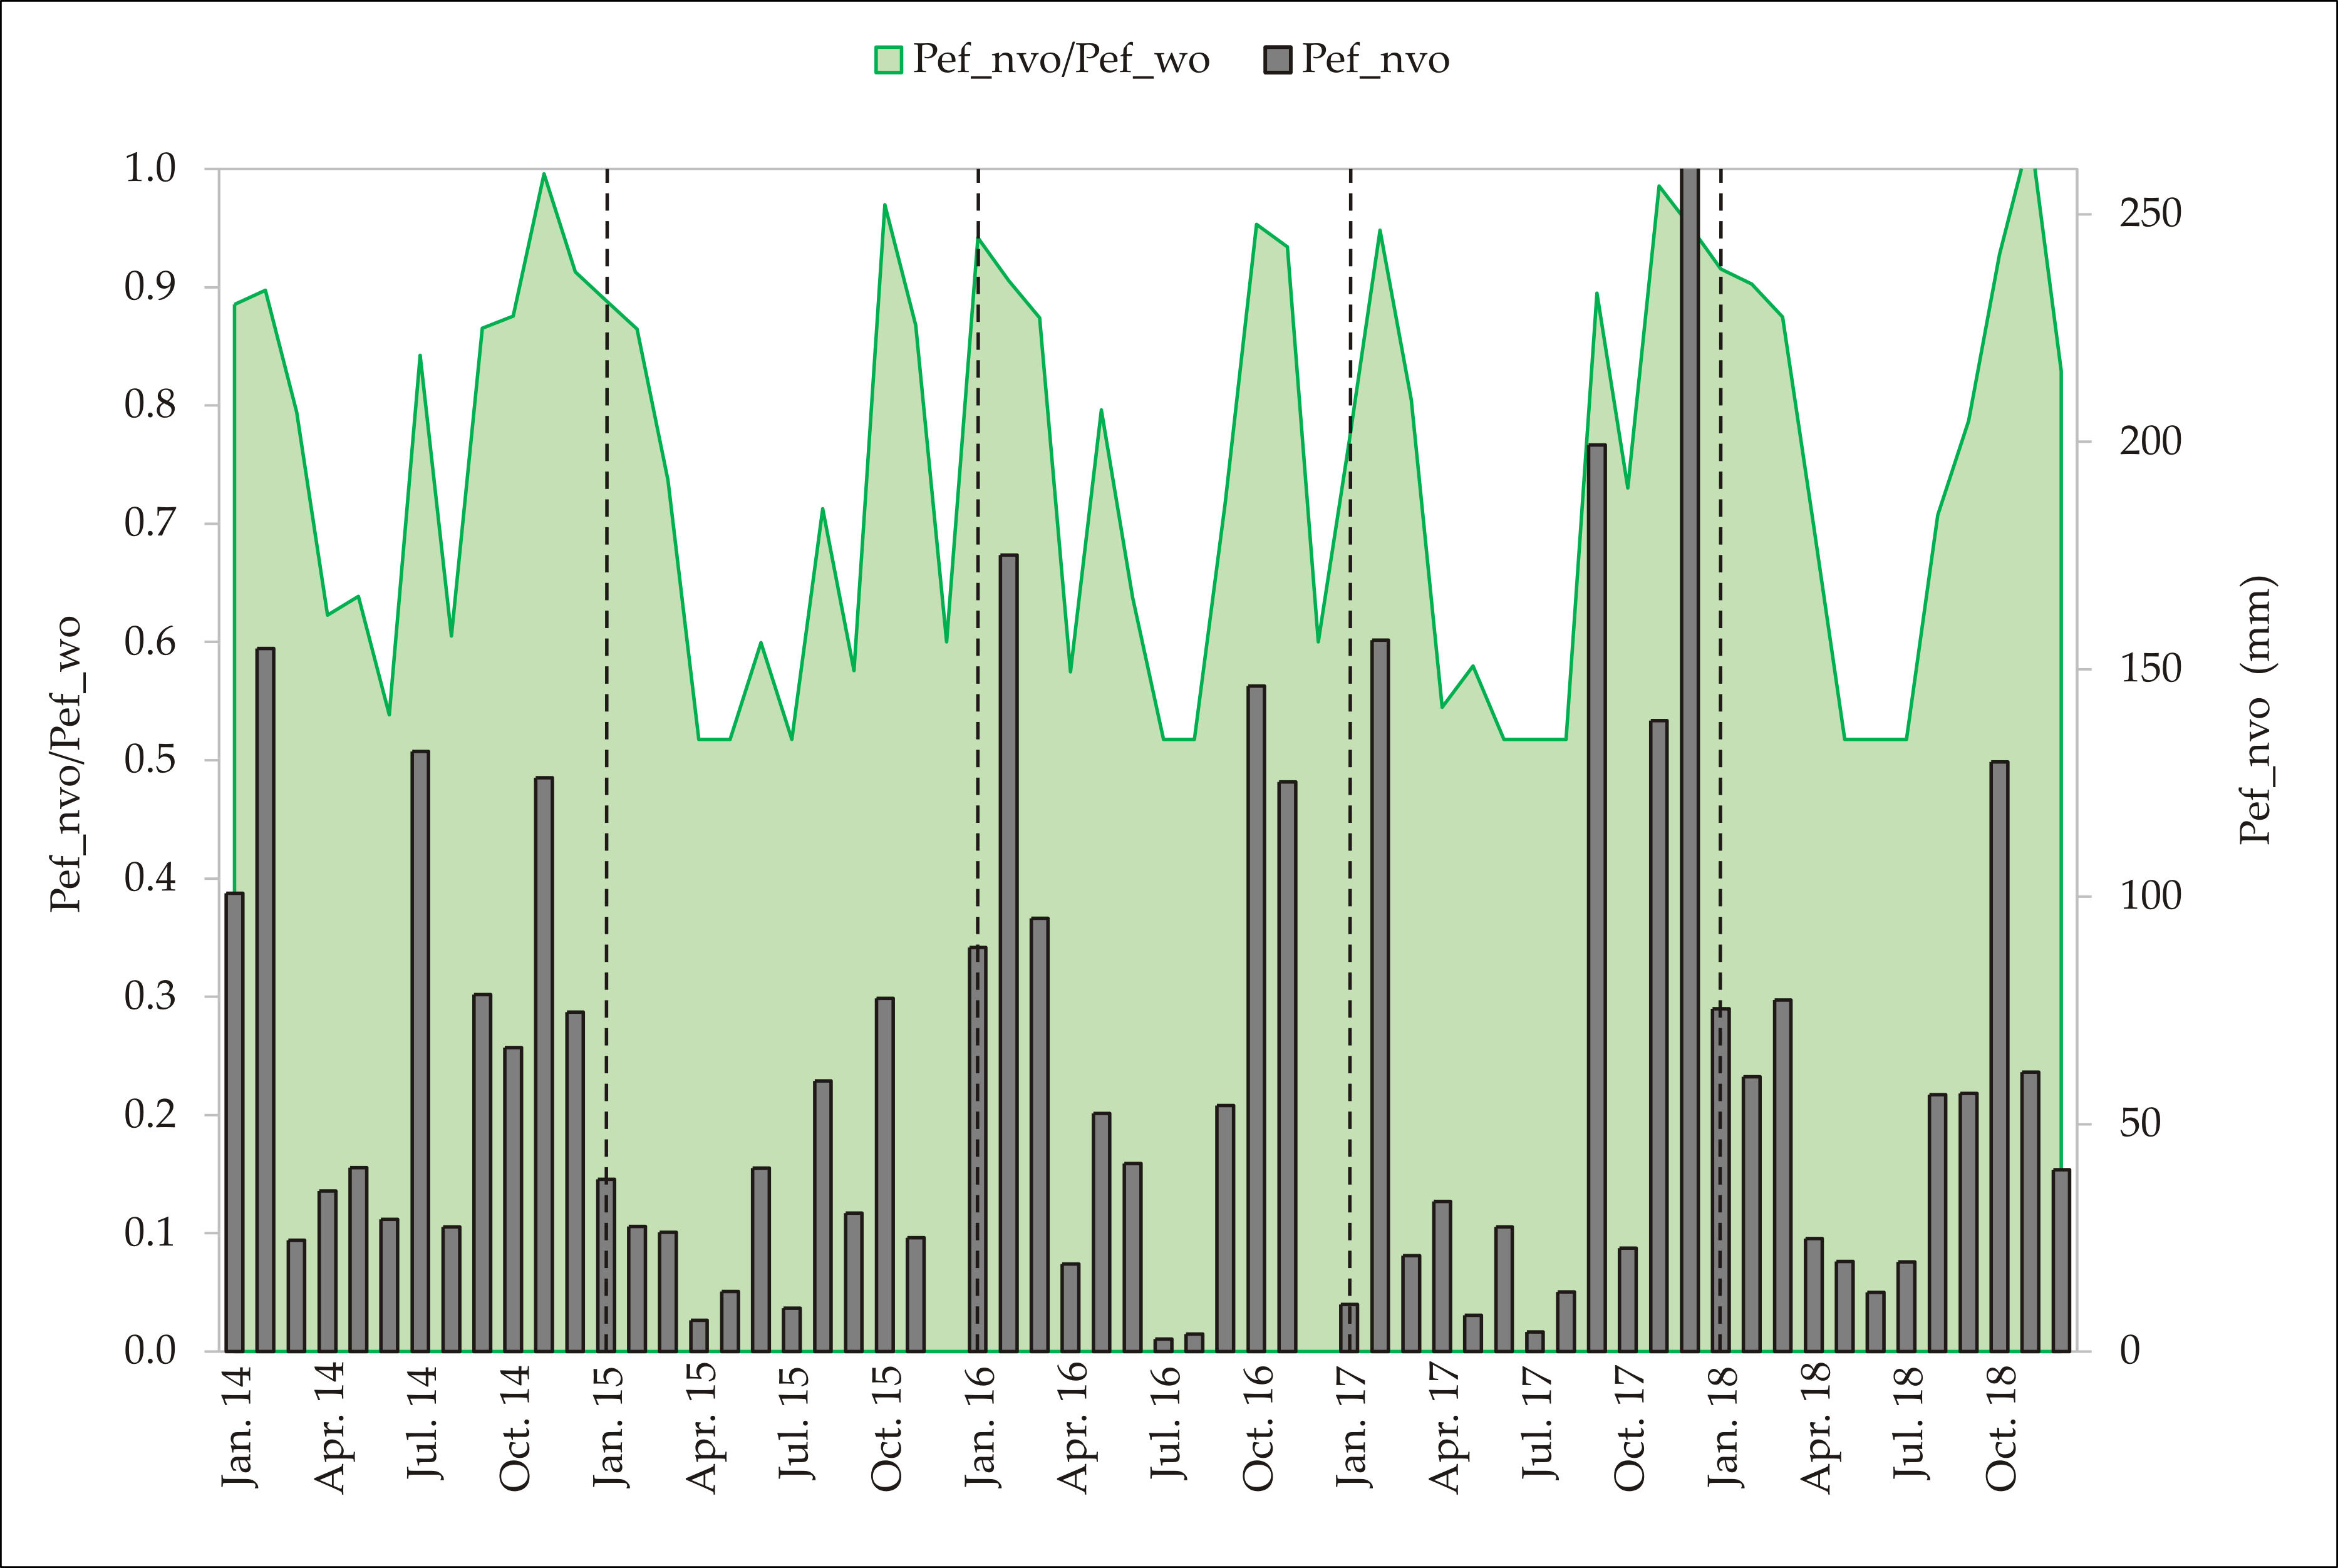
3.2. Evaluation of Changes in Vegetation Cover and Their Influence on Effective Precipitation
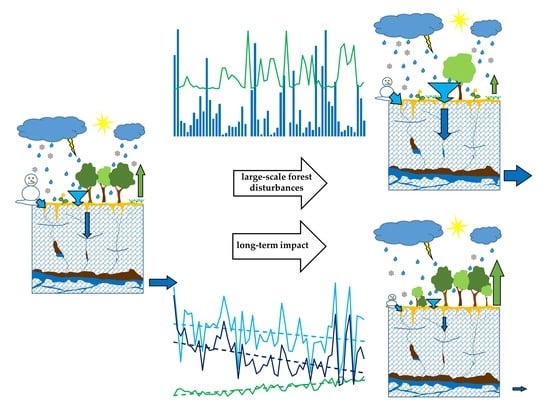
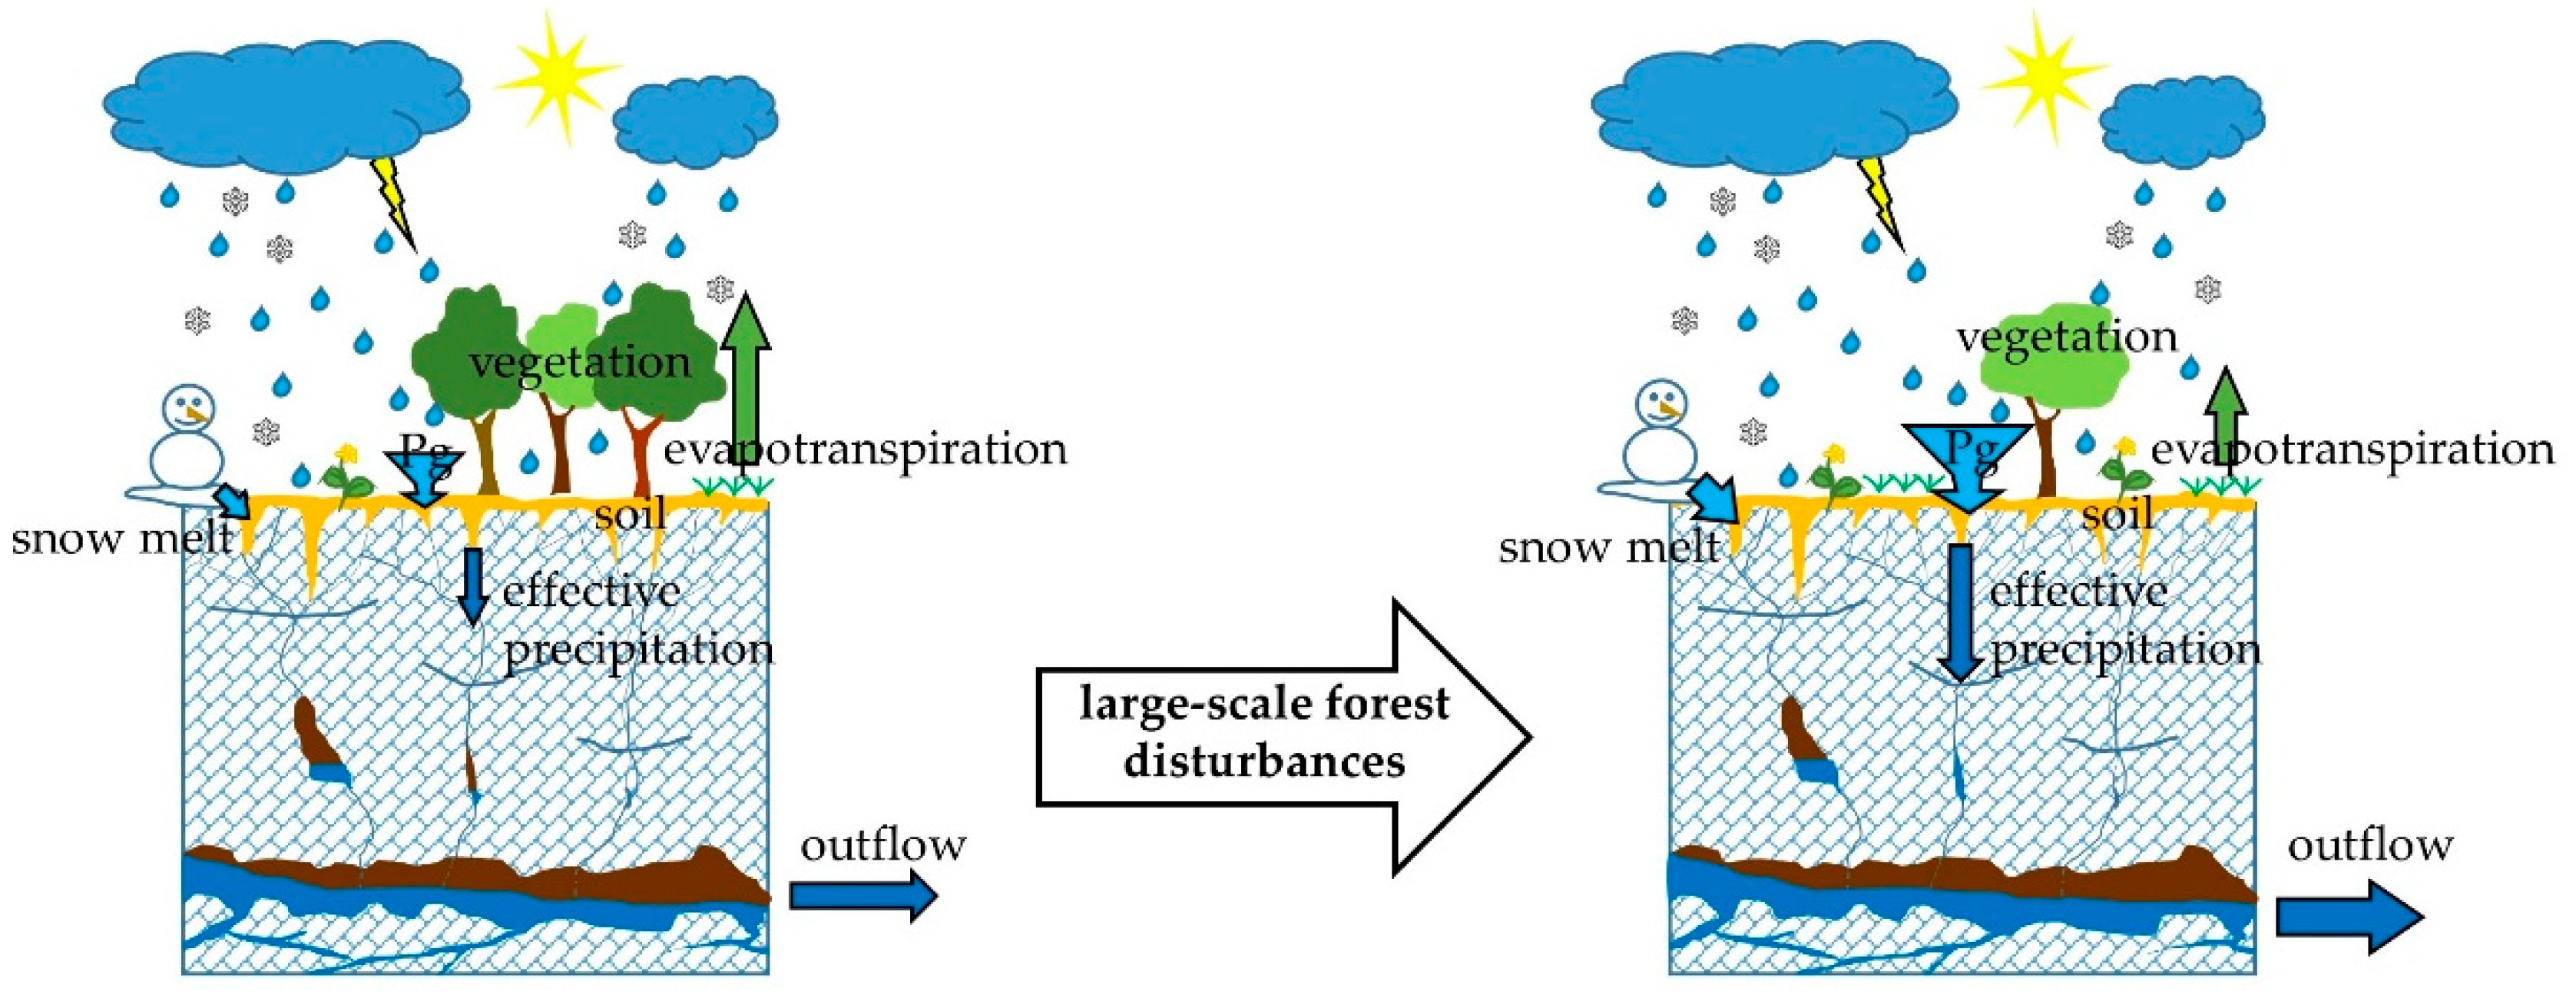
Although according to the national database on land use the area of forest in the catchment of the Unica springs in period 2014–2018 remained practically the same, the forestry data show that growing stock decreased for 16.77% due to the large-scale forest disturbances. On the basis of this information, it was calculated that in the assessment of Pef, the share of forests should be gradually reduced from 77.1% before 2014 to 64.2% by the end of the 2014–2018 period. These values were implemented in the soil water balance model in Microsoft Excel and the model was calibrated (calibration parameters: soil water storage capacity and canopy properties) to correspond to the mean discharge of the Unica River in the same period (21.24 m3/s). In this way, the total Pef for the period 2014–2018 was estimated at 4875 mm (annual average 975 mm). Assuming that the large-scale disturbances did not occur, in the model the share of forest was set to 77.1% over the entire period. This would reduce the total Pef in the years 2014–2018 to 4643 mm (annual average 929 mm).
A comparison of the monthly values of Pef calculated with the two models (Figure 4) shows that the ratio ranges between 1 and 1.6 and depends on the amount of precipitation and the season. As expected, in dry periods with active vegetation, the increase of Pef due to the decrease in the share of forests is evidently higher.
In the catchment of the Rižana spring, at present more than 2/3 of the total area is covered with forests. Only about 60 years ago, this share was slightly above 1/3. To evaluate the influence of such intensive natural vegetation overgrowth on the recharge of the karst aquifer, the same calculation mode was used as for the Unica karst spring. The actual share of forest (67.6% of the total catchment area) was taken into account and the model was calibrated to correspond to the mean discharge of the Rižana River in the period 2014–2018 (4.12 m3/s). In this way, the total Pef for the period 2014–2018 was estimated to be 3579 mm (annual average 716 mm). Assuming that natural overgrowth did not occur and the share of forest remains the same as in 1957 (37.4%), this amount would increase by 20% to 4293 mm (annual average 857 mm).
Comparison of the monthly values of Pef calculated with the two models (Figure 5) shows that the ratio ranges between 0.5 and 1. The ratio depends on the amount of precipitation and the season. As expected, in dry periods with active vegetation the natural vegetation overgrowth has higher influence and significantly reduces the amount of Pef.

4. Discussion

Both the Unica and the Rižana springs show a negative long-term trend in mean annual discharge in the studied periods. However, results of the long-term trend analysis show that the magnitude of a decrease in runoff differs between the studied springs. Namely, the relative decrease in mean annual discharge is greater for the Rižana spring. Since an apparent difference in long-term vegetation cover change in the catchments of the studied spring exists, both climate and vegetation factors have been considered for the interpretation of a long-term decrease of mean annual discharges of the springs. The effects of large-scale forest disturbances have been studied and discussed in the catchment of the Unica springs.

4.1. The Unica Case Study

Statistically significant long-term changes in the values of the water balance elements (precipitation and ETP) in the period 1962–2018 reflect in reduced runoff in the Unica spring catchment. From the beginning to the end of the observed period in 2018, the mean annual discharge of the Unica springs dropped from 23.86 to 19.30 m3/s or for 20.8% according to the Sen’s linear regression function. These results are in accordance with the statistically significant increase in annual ETP in the catchment of the Unica springs in the observed period, which, according to the trend function, increased from 624.10 mm in 1962 to 780.35 mm in 2018 or for 22.3%. Using trend function, we also determined 10.4% drop of annual precipitation from 1642.22 to 1483.14 mm in the observed period.
Mean monthly discharges of the Unica River in the cold span of the year show an increasing trend that is most probably the result of an increase in air temperatures in winter months in the region (Table 2; Figure 2). Higher temperatures mean less snow precipitation and a shorter snow residence time, which is reflected in increased runoff during the cold period of the year, when, in addition, vegetation is not active; something that has already been observed in catchments with similar relief and climate characteristics elsewhere [83,95,96,97,98]. The effect of the described phenomenon on runoff in the Unica catchment is not significantly hindered by the increased ETP. Namely, monthly ETP trends from December to March show a statistically significant increase.
Long-term changes in the vegetation cover in the catchment of the Unica springs are relatively small for the entire study period 1962–2018. As these only account for a few percentage points, changes in the vegetation cover were not attributed any major impact on the springs. The impact of climatological changes (in particular, the increase in ETP) was instead considered more influential in the overall decrease in the Unica River discharge, although some studies indicate that there are significant seasonal variations in ETP, especially in temperate climatic zones where deciduous trees predominate and are not often exposed to drought conditions [40,99,100].
More significant are the vegetation cover changes caused by ice breakage, bark beetle infestation and windthrow, which occurred in the years 2014–2018, with a gradual decrease in the proportion of forest from 77.1% to 64.2%. We therefore hypothesized consequent changes in the rate of precipitation interception and transpiration. A higher infiltration rates of precipitation into unsaturated zone and subsequent higher recharge of groundwater was expected.
To assess influence of altered forest cover on Pef, two different scenarios were tested in a model of the soil water balance. Results show that the large-scale disturbances caused an increase in Pef of 5%; taking into account the catchment size, this would mean an increase in mean discharge of 1 m3/s. We explain this with the fact that reduced forest vegetation caused diminution of canopy interception, water consumption and soil evaporation (Figure 6), which are dominant components of evapotranspiration [99,101].
Changes in evapotranspiration processes and consequent groundwater recharge due to altered forest cover have previously been shown by other studies as well [100,102]. Although our study provided a rough estimate that cannot take into account the exact natural conditions, the results are consistent with the comparison discussed hereafter. For the 5-year period 2014–2018, compared to the 52-year period 1962–2013, an increase in annual precipitation of 2.7% and annual evapotranspiration ETP of 14.8% and a decrease in annual runoff, calculated as the direct difference between precipitation and ETP, of 6.9% was calculated. Changes in the values of the above-mentioned water balance elements should be reflected in a significant decrease in the mean discharge of the Unica River. However, in the period 2014–2018 its mean discharge decreased by only 0.4% compared to the period 1962–2013. The results obtained support the assumption that the decrease in forest density due to large-scale disturbances causes an increase in Pef and a relative increase in the discharge of the Unica River. Furthermore, our findings are consistent with virtual experiment conducted by Sarrazin et al. [40], which is focused on the impact of land cover change.

4.2. The Rižana Case Study

From the beginning to the end of the observed period 1965–2018, the mean annual discharge of the Rižana River dropped from 4.75 to 2.74 m3/s, or by 51% according to the trend function. For the spring catchment, using the trend function, we determined a 13.7% drop in annual precipitation from 1625.96 to 1416.08 mm in the same period. Since the negative precipitation trend is not statistically significant, we cannot consider it as an important factor of the drop in mean annual discharge of the Rižana River in the observed period, as was already indicated for the Unica River. Furthermore, unlike the Unica River, where we confirmed an increasing trend in mean discharges in winter months, no such phenomenon was determined for the Rižana River. In comparison to the Unica springs catchment, the Rižana spring catchment lies on lower altitudes with less snow precipitation, hence the effect of decreasing snow precipitation and a consequently shorter snow residence time due to a general increase in air temperatures in the observed period was not so evident [25]. Concerning water availability for the drinking water supply of the region in the warm season, when the water demand is the highest, statistically significant negative monthly trends of Qmean and Qmin of the Rižana spring from April to September are discouraging (Table 2; Figure 3).
Although Ravbar et al. [25] gave the effects of climatological changes as the reason for a decrease in mean annual discharge of the spring, this study seeks additional causes. The observed significant drop in the mean annual discharge cannot be simply explained by the effects of climate change with increased annual ETP in its catchment that, in the observed period, increased from 756.65 to 942.80 mm or for 22%, which is exactly the same ratio as we calculated for the Unica catchment.
A possible explanation for such a huge decrease in mean annual discharge of the Rižana River is a distinctive change in vegetation cover in its catchment in the last six decades. The percentage of forests increased from 37.4% in 1957 to 67.6% in 2018, which could have a significant impact on changing the recharge characteristics of the entire catchment. As shown in a study by Huxman et al. [103], woody plant encroachment leads to increased plant transpiration and simultaneously to reduced availability of soil water. Similar anticipations have been reported by previous studies undertaken in karst areas [99,104].
Analysis of evaluation of Pef in the period 2014–2018 for the Rižana spring, assuming that natural overgrowth did not occur and the share of forest remained the same as in 1957, shows that the amount of Pef would be 20% higher and supports the assumption that forest cover expansion leads to a reduction in groundwater recharge. The findings also show that without significant natural vegetation overgrowth the average discharge of the spring would increase from 4.12 to 4.95 m3/s. This value is in accordance with the calculated mean annual discharge according to the trend function of the spring for the year 1965 (4.75 m3/s). If the comparison is focused only on the summer months (June, July, August), the difference in Pef is much higher, reaching up to 49%.
The statistically significant decrease in mean annual discharge of the Rižana River in the period 1965–2018 can thus be considered as a result of interacting impacts of long-term climate and vegetation cover changes (Figure 7), which is in line with virtual simulations made by Sarrazin et al. [40].

5. Conclusions

Our research is a comprehensive study that evaluates the changes within the entire catchment area in order to investigate individual influences, i.e., of climate and vegetation cover changes, on groundwater recharge in karst regions. It suggests that the vegetation cover change in a catchment of a karst spring can, in addition to climate changes, have a significant impact on the spring hydrology over a short and long timespan. Based on observational data, a further finding of this study is that the methodology applied allowed the quantification of impacts of these changes on karst water sources.
The case of the Unica springs catchment enabled the study of the effects of changes in vegetation cover to karst spring discharge conditions due to large-scale forest disturbances in the period 2014–2018. The findings show a resulting increase in Pef by 5% (due to less canopy interception and evapotranspiration) and a relative increase in the discharge of the Unica River, which were due to changes in the water balance elements, expected to decrease more significantly. The effects of large-scale forest disturbances thus mitigated the effects expected from the trend analysis of hydro-meteorological parameters.
The catchment of the Rižana spring has been impacted by climate and land use changes in the past six decades and enabled studies of their long-term impacts. Comparing the effects of climate change, reflected in the long-term increase in ETP, and of change in percentage of forest, resulting in a long-term decrease in Pef, the study points to interacting impacts of climate and vegetation cover changes. Without significant natural vegetation overgrowth, the mean discharge values of Rižana would be 4.95 m3/s, which is 0.83 m3/s higher than the actual average value. Even more significantly, up to 49% higher Pef and consequently higher discharges would be expected in summer months (June to August), when water scarcity is a serious problem under current conditions.
Although the study is site-specific, the selected karst catchments were nevertheless recognized for the following contributions: (1) well studied complex binary karst aquifers, (2) containing a long history of both climatological and hydrological datasets of high quality and (3) exhibiting strong and clear long-term vegetation cover changes or large-scale forest disturbances. Therefore, the results of this research are transferable to other similar studies aiming to assess the direct impact of various environmental changes on karst water sources. The study is also useful for the further evaluation of ecohydrological processes and the improvement in environmental policies, as it was able to distinguish between effects of climate and land cover changes on hydrological processes in karst. Furthermore, the study has a direct relevance to numerous land management challenges, due to issues of water availability to water-dependent economic sectors in particular.

Supplementary Materials

The following are available online at https://www.mdpi.com/2073-4441/12/11/3087/s1, Figure S1: Cumulative Pef for the Unica study area in the period 2014-2018 calculated in the calibration process using various combinations of calibration parameters, Figure S2: Cumulative Pef for the Rižana study area in the period 2014-2018 calculated in the calibration process using various combinations of calibration parameters, Table S1: Measured parameters, Table S2: Parameters taken from published tables and previous applications of the model in areas with similar hydrogeological, vegetation and climate conditions, Table S3: Calibration parameters, Table S4: Calibration process.

Author Contributions

All authors participated significantly and equally in the conceptual and methodological preparation of the paper, in data collection, their analysis and interpretation, as well as contributed to graphical production. Trend analyses were made by G.K., modelling was conducted by M.P. Project administration and funding acquisition was done by N.R. All authors have read and agreed to the published version of the manuscript.

Funding

This study was conducted within the context of the project’s Environmental effects and karst water sources: impacts, vulnerability and adaptation of land use, No. J6-8266, Infiltration processes in forested karst aquifers under changing environment, No. J2-1743, and Characterisation of karst aquifers on regional and local scales: the recharge area of the Malni water source, No. L7-2630, the programmes Karst Research, No. P6-0119, and Areas of cultural contact in integration processes, No. P6-0279, all financially supported by the Slovenian Research Agency.

Acknowledgments

The authors acknowledge the help of the Slovenia Forest Service for forestry data providing and the help of the Slovenian Environment Agency for environmental data providing.

Conflicts of Interest

The authors declare no conflict of interest.

References

  1. Ford, D.C.; Williams, P.W. Karst Hydrogeology and Geomorphology; Wiley: Chichester, UK, 2007; ISBN 978-0-470-84996-5. [Google Scholar]
  2. Stevanovic, Z.; Eftimi, R. Karstic sources of water supply for large consumers in Southeastern Europe–sustainability, disputes and advantages. Geol. Croat. 2010, 63, 179–185. [Google Scholar] [CrossRef]
  3. Zupan Hajna, N. Encyclopedia of Caves; Academic Press: Amsterdam, The Netherlands, 2012; pp. 195–203. ISBN 9780123838322. [Google Scholar]
  4. Culver, D.C.; Pipan, T. Subterranean ecosystems. In Encyclopedia of Biodiversity, 2nd ed.; Levin, S.A., Ed.; Academic Press: Waltham, MA, USA, 2013; pp. 49–62. ISBN 978-0-123-84719-5. [Google Scholar]
  5. Kobal, M.; Bertoncelj, I.; Pirotti, F.; Dakskobler, I.; Kutnar, L. Using Lidar Data to Analyse Sinkhole Characteristics relevant for understory vegetation under forest cover-case study of a high karst area in the Dinaric mountains. PLoS ONE 2015, 10, e122070. [Google Scholar] [CrossRef] [PubMed] [Green Version]
  6. Bakalowicz, M. Karst groundwater: A challenge for new resources. Hydrogeol. J. 2005, 13, 148–160. [Google Scholar] [CrossRef]
  7. Moore, C.H. Carbonate Reservoirs Porosity Evolution and Diagenesis in a Sequence Stratigraphic Framework, 1st ed.; Elsevier: Amsterdam, The Netherlands, 2001; ISBN 978-0-444-50838-6. [Google Scholar]
  8. Smart, C.; Worthington, S.R.H. Groundwater in karst. In Encyclopedia of Caves and Karst Science; Gunn, J., Ed.; Fitzroy Dearborn: New York, NY, USA, 2004; pp. 817–825. ISBN 978-1-57958-399-7. [Google Scholar]
  9. Jones, W.K.; White, W.B. Karst. In Encyclopedia of Caves; White, W.B., Culver, D.C., Eds.; Academic Press: Amsterdam, The Netherlands, 2012; pp. 430–438. ISBN 9780123838322. [Google Scholar]
  10. Ford, D. Karst. In Encyclopedia of Caves and Karst Science; Gunn, J., Ed.; Fitzroy Dearborn: New York, NY, USA, 2004; pp. 1017–1020. ISBN 1-57958-399-7. [Google Scholar]
  11. Worthington, S.R.H. Diagnostic hydrogeologic characteristics of a karst aquifer (Kentucky, USA). Hydrogeol. J. 2009, 17, 1665–1678. [Google Scholar] [CrossRef]
  12. Murphy, C.; Harrigan, S.; Hall, J.; Wilby, R.L. Climate-driven trends in mean and high flows from a network of reference stations in Ireland. Hydrol. Sci. J. 2013, 58, 755–772. [Google Scholar] [CrossRef]
  13. Intergovernmental Panel on Climate Change. Climate Change. The Physical Science Basis. Contribution of Working Group I to the Fourth Assessment Report of the Intergovernmental Panel on Climate Change; Cambridge University Press: Cambridge, UK; New York, NY, USA, 2007; 996p. [Google Scholar]
  14. Luis, M.; Čufar, K.; Saz, M.; Longares, L.; Ceglar, A.; Kajfež-Bogataj, L. Trends in seasonal precipitation and temperature in Slovenia during 1951–2007. Reg. Environ. Chang. 2012, 14, 1801–1810. [Google Scholar] [CrossRef]
  15. Frei, C.; Schöll, R.; Fukutome, S.; Schmidli, J.; Vidale, P.L. Future change of precipitation extremes in Europe: Intercomparison of scenarios from regional climate models. J. Geophys. Res. Atmos. 2006, 111, 1–22. [Google Scholar] [CrossRef] [Green Version]
  16. Gobiet, A.; Kotlarski, S.; Beniston, M.; Heinrich, G.; Rajczak, J.; Stoffel, M. 21st century climate change in the European Alps—A review. Sci. Total Environ. 2014, 493, 1138–1151. [Google Scholar] [CrossRef]
  17. Rodell, M.; Famiglietti, J.S.; Wiese, D.N.; Reager, J.T.; Beaudoing, H.K.; Landerer, F.W.; Lo, M.H. Emerging trends in global freshwater availability. Nature 2018, 557, 651–659. [Google Scholar] [CrossRef] [PubMed]
  18. Milly, P.C.D.; Dunne, K.A.; Vecchia, A.V. Global pattern of trends in streamflow and water availability in a changing climate. Nature 2005, 438, 347–350. [Google Scholar] [CrossRef]
  19. Frantar, P.; Hrvatin, M. Discharge regimes in Slovenia from 1971 to 2000. Geogr. Vestn. 2005, 77, 115–127. [Google Scholar]
  20. Camarasa-Belmonte, A.M.; Segura, F.S. Flood events in Mediterranean ephemeral streams (ramblas) in Valencia region, Spain. Catena 2001, 45, 229–249. [Google Scholar] [CrossRef] [Green Version]
  21. Stone, D.; Schindel, G.M. The application of GIS in support of land acquisition for the protection of sensitive groundwater recharge properties in the Edwards aquifer of south-central Texas. J. Cave Karst Stud. 2002, 64, 38–44. [Google Scholar]
  22. Jourde, H.; Roesch, A.; Guinot, V.; Bailly-Comte, V. Dynamics and contribution of karst groundwater to surface flow during mediterranean flood. Environmental Geology 2007, 51, 725–730. [Google Scholar] [CrossRef]
  23. Hagemann, S.; Chen, C.; Clark, D.; Folwell, S.; Gosling, S.; Haddeland, I.; Haddeland, I.; Hanasaki, N.; Ludwig, F.; Voss, F.; et al. Climate change impact on available water resources obtained using multiple global climate and hydrology models. Earth Syst. Dyn. 2013, 4, 129–144. [Google Scholar] [CrossRef] [Green Version]
  24. Long, A.J.; Mahler, B.J. Prediction, time variance, and classification of hydraulic response to recharge in two karst aquifers. Hydrol. Earth Syst. Sci. 2013, 17, 281–294. [Google Scholar] [CrossRef] [Green Version]
  25. Ravbar, N.; Kovačič, G.; Petrič, M.; Kogovšek, J.; Brun, C.; Koželj, A. Climatological trends and anticipated karst spring quantity and quality: Case study of the Slovene Istria. In Advances in Karst Research: Theory, Fieldwork and Applications; Parise, M., Gabrovsek, F., Kaufmann, G., Ravbar, N., Eds.; Geological Society, London, Special Publications: London, UK, 2018; Volume 466, pp. 295–305. [Google Scholar] [CrossRef]
  26. Loáiciga, H.A.; Maidment, D.R.; Valdes, J.B. Climate-change impacts in a regional karst aquifer, Texas, USA. J. Hydrol. 2000, 227, 173–194. [Google Scholar] [CrossRef]
  27. Finger, D.; Hugentobler, A.; Huss, M.; Voinesco, A.; Wernli, H.R.; Fischer, D.; Weber, E.; Jeannin, P.-Y.; Kauzlaric, M.C.; Wirz, A.C.; et al. Identification of glacial meltwater runoff in a karstic environment and its implication for present and future water availability. Hydrol. Earth Syst. Sci. 2013, 17, 3261–3277. [Google Scholar] [CrossRef] [Green Version]
  28. Hartmann, A.; Lange, J.; Aguado, À.V.; Mizyed, N.; Smiatek, G.; Kunstmann, H. A multi-model approach for improved simulations of future water availability at a large Eastern Mediterranean karst spring. J. Hydrol. 2012, 468–469, 130–138. [Google Scholar] [CrossRef]
  29. Hartmann, A.; Gleeson, T.; Wada, Y.; Wagener, T. Enhanced groundwater recharge rates and altered recharge sensitivity to climate variability through subsurface heterogeneity. Proc. Natl. Acad. Sci. USA 2017, 114, 2842–2847. [Google Scholar] [CrossRef] [PubMed] [Green Version]
  30. Koohbor, B.; Fahs, M.; Hoteit, H.; Doummar, J.; Younes, A.; Belfort, B. An advanced discrete fracture model for variably saturated flow in fractured porous media. Adv. Water Resour. 2020, 103602. [Google Scholar] [CrossRef]
  31. Granier, A.; Reichstein, M.; Breda, N.; Janssens, I.A.; Falge, E.; Ciais, P.; Gruenwald, T.; Aubineth, M.; Berbigier, P.; Bernhofer, C.; et al. Evidence for soil water control on carbon and water dynamics in European forests during the extremely dry year: 2003. Agric. For. Meteorol. 2007, 143, 123–145. [Google Scholar] [CrossRef]
  32. Palahi, M.; Mavsar, R.; Gracia, C.; Birot, Y. Mediterranean forests under focus. Int. For. Rev. 2008, 10, 676–688. [Google Scholar] [CrossRef]
  33. Bertini, G.; Amoriello, T.; Fabbio, G.; Piovosi, M. Forest growth and climate change: Evidences from the ICP-Forests intensive monitoring in Italy. iForest-Biogeosci. For. 2011, 4, 262–267. [Google Scholar] [CrossRef] [Green Version]
  34. Bredemeier, M. Forest, climate and water issues in Europe. Ecohydrology 2011, 4, 159–167. [Google Scholar] [CrossRef]
  35. Kutnar, L.; Kobler, A. Prediction of forest vegetation shift due to different climate-change scenarios in Slovenia. Šumarski List 2011, 135, 113–126. [Google Scholar]
  36. Michelot, A.; Bréda, N.; Damesin, C.; Dufrêne, E. Differing growth responses to climatic variations and soil water deficits of Fagus sylvatica, Quercus petraea and Pinus sylvestris in a temperate forest. For. Ecol. Manag. 2012, 265, 161–171. [Google Scholar] [CrossRef]
  37. Dirnböck, T.; Grabherr, G. GIS assessment of vegetation and hydrological change in a high mountain catchment of the Northern Limestone Alps. Mt. Res. Dev. 2000, 20, 172–179. [Google Scholar] [CrossRef]
  38. Dasgupta, S.; Mohanty, B.P.; Köhne, J.M. Impacts of juniper vegetation and karst geology on subsurface flow processes in the Edwards Plateau, Texas. Vadose Zone J. 2006, 5, 1076–1085. [Google Scholar] [CrossRef] [Green Version]
  39. Zhang, Z.; Chen, X.; Ghadouani, A.; Shi, P. Modelling hydrological processes influenced by soil, rock and vegetation in a small karst basin of southwest China. Hydrol. Process. 2011, 25, 2456–2470. [Google Scholar] [CrossRef]
  40. Sarrazin, F.; Hartmann, A.; Pianosi, F.; Rosolem, R.; Wagener, T. V2Karst V1. 1: A parsimonious large-scale integrated vegetation–recharge model to simulate the impact of climate and land cover change in karst regions. Geosci. Model Dev. 2018, 11, 4933–4964. [Google Scholar] [CrossRef] [Green Version]
  41. Cognard-Plancq, A.L.; Marc, V.; Didon-Lescot, J.F.; Norman, M. The role of forest cover on streamflow down sub-Mediterranean mountain watersheds: A modelling approach. J. Hydrol. 2001, 254, 229–243. [Google Scholar] [CrossRef]
  42. Theurillat, J.P.; Guisan, A. Potential impact of climate change on vegetation in the European Alps: A review. Clim. Chang. 2001, 50, 77–109. [Google Scholar] [CrossRef]
  43. Rothe, A.; Huber, C.; Kreutzer, K.; Weis, W. Deposition and soil leaching in stands of Norway spruce and European Beech: Results from the Höglwald research in comparison with other European case studies. Plant Soil 2002, 240, 33–45. [Google Scholar] [CrossRef]
  44. Pronk, M.; Goldscheider, N.; Zopfi, J. Dynamics and interaction of organic carbon, turbidity and bacteria in a karst aquifer system. Hydrogeol. J. 2005, 14, 473–484. [Google Scholar] [CrossRef] [Green Version]
  45. Bréda, N.; Huc, R.; Dreyer, E.; Granier, A. Temperate forest trees and stands under severe drought: A review of ecophysiological responses, adaptation processes and long-term consequences. Ann. For. Sci. 2006, 63, 625–644. [Google Scholar] [CrossRef] [Green Version]
  46. Bonan, G.B. Forests and climate change: Forcings, feedbacks, and the climate benefits of forests. Science 2008, 320, 1444–1449. [Google Scholar] [CrossRef] [Green Version]
  47. Hartmann, A.; Kobler, J.; Kralik, M.; Dirnböck, T.; Humer, F.; Weiler, M. Model-aided quantification of dissolved carbon and nitrogen release after windthrow disturbance in an Austrian karst system. Biogeosciences 2016, 13, 159–174. [Google Scholar] [CrossRef] [Green Version]
  48. Hartmann, A.; Baker, A. Modelling karst vadose zone hydrology and its relevance for paleoclimate reconstruction. Earth-Sci. Rev. 2017, 172, 178–192. [Google Scholar] [CrossRef]
  49. Poljanšek, S.; Vilhar, U.; Levanič, T. Green water reconstructed for Rižana watershed, SW Slovenia. Environ. Earth Sci. 2018, 77, 1–10. [Google Scholar] [CrossRef] [Green Version]
  50. Kaligarič, M.; Ivajnšič, D. Vanishing landscape of the “classic” Karst: Changed landscape identity and projections for the future. Landsc. Urban Plan. 2014, 132, 148–158. [Google Scholar] [CrossRef]
  51. Hanewinkel, M.; Cullmann, D.A.; Schelhaas, M.J.; Nabuurs, G.J.; Zimmermann, N.E. Climate change may cause severe loss in the economic value of European forest land. Nat. Clim. Chang. 2013, 3, 203–207. [Google Scholar] [CrossRef]
  52. Seidl, R.; Schelhaas, M.J.; Lexer, M.J. Unraveling the drivers of intensifying forest disturbance regimes in Europe. Glob. Chang. Biol. 2011, 17, 2842–2852. [Google Scholar] [CrossRef]
  53. Peng, T.; Wang, S.J. Effects of land use, land cover and rainfall regimes on the surface runoff and soil loss on karst slopes in southwest China. Catena 2012, 90, 53–62. [Google Scholar] [CrossRef]
  54. Liu, Y.; Huang, X.; Yang, H.; Zhong, T. Environmental effects of land-use/cover change caused by urbanization and policies in Southwest China Karst area–A case study of Guiyang. Habitat Int. 2014, 44, 339–348. [Google Scholar] [CrossRef]
  55. Gospodarič, R.; Habič, P. Underground Water Tracing: Investigations in Slovenia 1972–1975; Inštitut Za raziskovanje Krasa ZRC SAZU: Postojna, Slovenia, 1976. [Google Scholar]
  56. Gabrovšek, F.; Kogovšek, J.; Kovačič, G.; Petrič, M.; Ravbar, N.; Turk, J. Recent results of tracer tests in the catchment of the Unica River (SW Slovenia). Acta Carsologica 2010, 39, 27–37. [Google Scholar] [CrossRef]
  57. Kovačič, G. Hydrogeological study of the Malenščica karst spring (SW Slovenia) by means of a time series analysis. Acta Carsologica 2010, 39, 201–215. [Google Scholar] [CrossRef] [Green Version]
  58. Petrič, M. Case Study: Characterization, exploitation, and protection of the Malenščica karst spring, Slovenia. In Groundwater Hydrology of Springs; Kresic, N., Stevanovic, Z., Eds.; Butterworth-Heinemann: Oxford, UK, 2010; pp. 428–441. [Google Scholar] [CrossRef]
  59. Slovenian Environment Agency. Archive of Hydrological Data. Available online: http://vode.arso.gov.si/hidarhiv/ (accessed on 15 December 2019).
  60. Slovenian Environment Agency. Archive of Meteorological Data. Available online: http://www.meteo.si (accessed on 1 April 2020).
  61. Krivic, P.; Bricelj, M.; Trišič, N.; Zupan, M. Water tracing experiment in the Rižana spring ground water basin (in Slovene). Acta Carsologica 1987, 16, 83–104. [Google Scholar]
  62. Krivic, P.; Bricelj, M.; Zupan, M. Underground water connections in Cicarija region and in Middle Istria. Acta Carsologica 1989, 18, 265–295. [Google Scholar]
  63. Allen, R.G.; Pereira, L.S.; Raes, D.; Smith, M. Crop Evapotranspiration–Guidelines for Computing Crop Water Requirements; FAO Irrigation and Drainage Paper 56; Food and Agriculture Organization of the United Nations: Rome, Italy, 1998; ISBN 92-5-104219-5. [Google Scholar]
  64. Ministry of Agriculture, Forestry and Food, Records of Actual Use of Agricultural and Forest Land. Available online: https://rkg.gov.si/vstop/ (accessed on 19 December 2019).
  65. Ministry of Agriculture, Forestry and Food, Pedological Map. Available online: https://rkg.gov.si/vstop/ (accessed on 16 April 2020).
  66. Mann, H.B. Non-parametric tests against trend. Econometrica 1945, 33, 245–259. [Google Scholar] [CrossRef]
  67. Kendall, M.G.; Gibbons, J.D. Rank Correlation Methods, 4th ed.; Edward Arnold: London, UK, 1990; ISBN 978-0-85264-305-5. [Google Scholar]
  68. Hess, A.; Lyer, H.; Malm, W. Linear trend analysis: A comparison of methods. Atmos. Environ. 2001, 35, 5211–5222. [Google Scholar] [CrossRef]
  69. Theil, H. A rank-invariant method of linear and polynomial regression analysis, Part 1. Proc. R. Neth. Acad. Sci. 1950, 53, 386–392. [Google Scholar]
  70. Sen, P.K. Estimates of the regression coefficient based on Kendall’s tau. J. Am. Stat. Assoc. 1968, 63, 1379–1389. [Google Scholar] [CrossRef]
  71. Salmi, T.; Määttä, A.; Anttila, P.; Ruoho-Airola, T.; Ammell, T. Detecting Trends of Annual Values of Atmospheric Pollutants by the Mann-Kendall Test and Sen’s Slope Estimates–the Excel Template Application MAKESENS; Finnish Meteorological Institute, Air Quality Research: Helsinki, Finland, 2002; ISBN 951-697-563-1. [Google Scholar]
  72. Tilgenkamp, A. Theil-Sen Estimator. Available online: http:/www.mathworks.com/matlabcentral/fileexchange/34308-theil-sen-estimator (accessed on 12 December 2019).
  73. Helsel, D.R.; Hirsch, R.M. Statistical Methods in Water Resources; Elsevier: New York, NY, USA, 1992; ISBN 978-0-444-88528-9. [Google Scholar]
  74. Zhao, G.; Hörmann, G.; Fohrer, N.; Zhang, Z.; Zhai, J. Streamflow Trends and Climate Variability Impacts in Poyang Lake Basin, China. Water Resour. Manag. 2010, 24, 689–706. [Google Scholar] [CrossRef]
  75. Dinpashoh, Y.; Jhajharia, D.; Fakheri-Fard, A.; Singh, V.P.; Kahya, E. Trends in reference crop evapotranspiration over Iran. J. Hydrol. 2011, 399, 422–433. [Google Scholar] [CrossRef]
  76. Espadafor, M.; Lorite, I.J.; Gavilán, P.; Berengena, J. An analysis of the tendency of reference evapotranspiration estimates and other climate variables during the last 45 years in Southern Spain. Agric. Water Manag. 2011, 98, 1045–1061. [Google Scholar] [CrossRef]
  77. Tabari, H.; Talaee, P.H. Temporal variability of precipitation over Iran: 1966–2005. J. Hydrol. 2011, 396, 313–320. [Google Scholar] [CrossRef]
  78. Tabari, H.; Marofi, S.; Aeini, A.; Talaee, P.H.; Mohammadi, L. Trend analysis of reference evapotranspiration in the western half of Iran. Agric. For. Meteorol. 2011, 151, 128–136. [Google Scholar] [CrossRef]
  79. Some’e, B.S.; Ezani, A.; Tabari, H. Spatiotemporal trends and change point of precipitation in Iran. Atmos. Res. 2012, 113, 1–12. [Google Scholar] [CrossRef]
  80. Tabari, H.; Talaee, P.H.; Ezani, A.; Some’e, B.S. Shift changes and monotonic trends in autocorrelated temperature series over Iran. Theor. Appl. Climatol. 2012, 109, 95–108. [Google Scholar] [CrossRef]
  81. Gudmundsson, L.; Seneviratne, S.I. European drought trends. Proc. IAHS 2015, 369, 75–79. [Google Scholar] [CrossRef] [Green Version]
  82. Yürekli, K. Impact of climate variability on precipitation in the Upper Euphrates–Tigris Rivers Basin of Southeast Turkey. Atmos. Res. 2015, 154, 25–38. [Google Scholar] [CrossRef]
  83. Kovačič, G. Discharge trends of the Adriatic Sea basin rivers in Slovenia, excluding the Soča river basin. Geogr. Vestn. 2016, 88, 9–29. [Google Scholar]
  84. Kovačič, G.; Kolega, N.; Brečko Grubar, V. Climate change impacts on water quantities and sea flooding in Slovene Istria. Geogr. Vestn. 2016, 88, 21–36. [Google Scholar]
  85. Hartmann, A.; Gleeson, T.; Rosolem, R.; Pianosi, F.; Wada, Y.; Wagener, T. A large-scale simulation model to assess karstic groundwater recharge over Europe and the Mediterranean. Geosci. Model. Dev. 2015, 8, 1729–1746. [Google Scholar] [CrossRef] [Green Version]
  86. Bittner, D.; Narany, T.S.; Kohl, B.; Disse, M.; Chiogna, G. Modeling the hydrological impact of land use change in a dolomite-dominated karst system. J. Hydrol. 2018, 567, 267–279. [Google Scholar] [CrossRef]
  87. Bittner, D.; Rychlik, A.; Klöffel, T.; Leuteritz, A.; Disse, M.; Chiogna, G. A GIS-based model for simulating the hydrological effects of land use changes on karst systems–The integration of the LuKARS model into FREEWAT. Environ. Model. Softw. 2020, 104682. [Google Scholar] [CrossRef]
  88. Petrič, M. The role of accurate recharge estimation in the hydrodynamic analysis of karst aquifers. Acta Carsologica 2001, 30, 69–84. [Google Scholar]
  89. Petrič, M. Characteristics of Recharge-Discharge Relations in Karst Aquifer; ZRC Publishing: Postojna-Ljubljana, Slovenia, 2002. [Google Scholar]
  90. Sevruk, B. Methods of Correction for Systematic Error in Point Precipitation Measurement for Operational Use; No. 589, Operational Hydrology, Report No. 21; WMO: Geneva, Switzerland, 1982; pp. 1–91. [Google Scholar]
  91. Dingman, L.S. Physical Hydrology; Macmillan Publishing Company: New York, NY, USA, 1994. [Google Scholar]
  92. Rutter, A.J.; Kershaw, K.A.; Robins, P.C.; Morton, A.J. A predictive model of rainfall interception on forests. I. Derivation of the model from observations in a plantation of Corsican pine. Agric. Meteorol. 1971, 9, 367–384. [Google Scholar] [CrossRef]
  93. US Army Corps of Engineers. Runoff from Snowmelt, EM 1110-2-1406; Engineering and Design Manuals; US Army Corps of Engineers: Washington, DC, USA, 1960.
  94. Shaw, E.M. Hydrology in Practice; Chapman & Hall: London, UK, 1994. [Google Scholar]
  95. Middelkoop, H.; Daamen, K.; Gellens, D.; Grabs, W.; Kwadijk, J.C.J.; Lang, H.; Parmet, B.W.A.H.; Schädler, B.; Schulla, J.; Wilke, K. Impact of Climate Change on Hydrological Regimes and Water Resources Management in the Rhine Basin. Clim. Chang. 2001, 49, 105–128. [Google Scholar] [CrossRef]
  96. Horton, P.; Schaefli, B.; Mezghani, A.; Hingray, B.; Musy, A. Assessment of climate-change impacts on alpine discharge regimes with climate model uncertainty. Hydrol. Process. 2006, 20, 2091–2109. [Google Scholar] [CrossRef]
  97. Bormann, H. Runoff regime changes in German rivers due to climate change. Erdkunde 2010, 64, 257–279. [Google Scholar] [CrossRef]
  98. Sanmiguel-Vallelado, A.; Morán-Tejeda, E.; Alonso-Gonzalez, E.; López-Moreno, J.I. Effect of snow on mountain river regimes: An example from the Pyrenees. Front. Earth Sci. Vol. 2017, 11, 515–530. [Google Scholar] [CrossRef]
  99. Moore, G.W.; Heilman, J.L. Proposed principles governing how vegetation changes affect transpiration. Ecohydrology 2011, 4, 351–358. [Google Scholar] [CrossRef]
  100. Heilman, J.L.; Litvak, M.E.; McInnes, K.J.; Kjelgaard, J.F.; Kamps, R.H.; Schwinning, S. Water-storage capacity controls energy partitioning and water use in karst ecosystems on the Edwards Plateau, Texas. Ecohydrology 2014, 7, 127–138. [Google Scholar] [CrossRef]
  101. Calder, I.R. Water use by forests, limits and controls. Tree Physiol. 1998, 18, 625–631. [Google Scholar] [CrossRef] [Green Version]
  102. Zhang, L.; Dawes, W.R.; Walker, G.R. Response of mean annual evapotranspiration to vegetation changes at catchment scale. Water Resour. Res. 2001, 37, 701–708. [Google Scholar] [CrossRef]
  103. Huxman, T.E.; Wilcox, B.P.; Breshears, D.D.; Scott, R.L.; Snyder, K.A.; Small, E.E.; Hultin, K.; Pockman, W.T.; Jackson, R.B. Ecohydrological implications of woody plant encroachment. Ecology 2005, 86, 308–319. [Google Scholar] [CrossRef]
  104. Guo, F.; Jiang, G.; Polk, J.S.; Huang, X.; Huang, S. Resilience of groundwater impacted by land use and climate change in a karst aquifer, South China. Water Environ. Res. 2015, 87, 1990–1998. [Google Scholar] [CrossRef]
Figure 1. Location and main hydrogeological characteristics of the study areas: (A) catchment of the Unica springs, (B) catchment of the Rižana spring.
Water 12 03087 g001
Figure 2. Yearly discharge (Q) of the Unica River, precipitation (P) and ETP in the catchment in the period 1962–2018 with trend lines (t).
Water 12 03087 g002
Figure 3. Yearly discharge (Q) of the Rižana River, precipitation (P) and ETP in the catchment in the period 1962–2018 with trend lines (t).
Water 12 03087 g003
Figure 4. The ratio between monthly values of Pef calculated for the conditions with the large-scale forest disturbances in the catchment of the Unica River (Pef_d) and with the assumption that they would not appear (Pef_nd). To indicate the differences between the dry and wet periods, the monthly values of Pef_d are presented too.
Water 12 03087 g004
Figure 5. The ratio between monthly values of Pef calculated for the actual share of forest (67.6%) in the catchment of the Rižana River (Pef_nvo) and with the assumption that the natural vegetation overgrowth would not happen and the share of forest would remain the same as it was in 1957 (37.4%) (Pef_wo). To indicate the differences between the dry and wet periods the monthly values of Pef_nvo are presented too.
Water 12 03087 g005
Figure 6. Conceptual model of the impacts to the effective precipitation and spring discharge changes due to large-scale forest disturbances. The change of an arrow size illustrates the relative change of the respective parameter.
Water 12 03087 g006
Figure 7. Conceptual model of long-term changes in the annual values of water balance elements in the case of insignificant natural vegetation overgrowth, but only climate variability (sketch top right) and in the case of significant natural vegetation overgrowth in addition to climate variability (sketch bottom right). The change in an arrow size illustrates the relative change in the respective parameter.
Water 12 03087 g007
Table 1. Summarized main characteristics of the study areas.
The Unica Springs The Rižana Spring
Catchment size (km2)>800~250
Catchment elevation range (m asl)450–180070–1100
Discharge range (m3/s)1–900.07–63
Mean discharge (m3/s)213.5
Average annual precipitation (mm)15051484
Average annual ETP (mm)738892
Average annual runoff (mm)767592
Average annual runoff ratio0.510.4
Table 2. Values of Theil-Sen slope estimator (β) for selected meteorological and hydrological variables with labelled statistical significance. Units of precipitation (P) and ETP are in mm and of mean (Qmean), minimum (Qmin) and maximum (Qmax) discharge are in m3/s.
Postojna (P)Postojna (ETP)Unica (Qmean)Unica (Qmin)Unica (Qmax)Podgrad (P)Podgrad (ETP)Rižana (Qmean)Rižana (Qmin)Rižana (Qmax)
Yearly−2.841 *2.790 ***−0.082−0.017 *0.011−3.9603.512 ***−0.038 ***−0.003 ***−0.275 *
January−0.2850.096 **0.093−0.0240.163−0.3700.123 ***−0.018−0.005−0.119
February0.5860.111 *0.0350.0100.1370.2820.123 *−0.013−0.012 #−0.017
March−0.5220.304 ***−0.040−0.019−0.002−0.4190.260 **−0.013−0.009−0.097
April−0.942 #0.331 ***−0.192−0.218 **−0.142−0.857 #0.277 ***−0.057 **−0.012 *−0.347 **
May−0.4710.509 ***−0.212 **−0.140 ***−0.309 #−0.1810.419 **−0.037 *−0.014 ***−0.140
June−0.4310.427 ***−0.214 **−0.137 ***−0.308 #−0.3730.512 ***−0.034 *−0.010 ***−0.156 *
July−0.6980.468 ***−0.127 ***−0.049 ***−0.268 **−0.4770.585 ***−0.011 **−0.005 ***−0.027
August−0.9140.467 ***−0.078 **−0.029 **−0.189 *−0.8790.601 ***−0.012 **−0.003 ***−0.048 *
September0.2960.055−0.093−0.031 *−0.1330.1050.260 *−0.028 *−0.005 ***−0.177 #
October0.825−0.0080.016−0.0170.2240.7870.184−0.004−0.004 #0.012
November−0.5490.0310.0300.029−0.016−0.8680.115 #−0.035−0.001−0.241 #
December−0.0360.071 *0.022−0.038−0.0620.0700.137 **−0.036−0.005−0.294 #
p < 0.1 (#); p < 0.05 (*); p < 0.01 (**); p < 0.001 (***).
Publisher’s Note: MDPI stays neutral with regard to jurisdictional claims in published maps and institutional affiliations.

