Article

Statistical and Hydrological Evaluations of Multiple Satellite Precipitation Products in the Yellow River Source Region of China

1
State Key Laboratory of Hydrology-Water Resources and Hydraulic Engineering, Nanjing 210098, China
2
College of Hydrology and Water Resources, Hohai University, Nanjing 210098, China
3
Nanjing Hydraulic Research Institute (NHRI), Nanjing 210029, China
4
Technological Institute of Merida, Technological Avenue, Merida 97219, Mexico
*
Author to whom correspondence should be addressed.
Water 2020, 12(11), 3082; https://doi.org/10.3390/w12113082
Submission received: 21 September 2020 / Revised: 23 October 2020 / Accepted: 31 October 2020 / Published: 3 November 2020
(This article belongs to the Special Issue Hydrological Modeling in Water Cycle Processes)

Abstract

:
Comprehensively evaluating satellite precipitation products (SPPs) for hydrological simulations on watershed scales is necessary given that the quality of different SPPs varies remarkably in different regions. The Yellow River source region (YRSR) of China was chosen as the study area. Four SPPs were statistically evaluated, namely, the Tropical Rainfall Measurement Mission (TRMM) Multisatellite Precipitation Analysis (TMPA) 3B42V7, Precipitation Estimation from Remotely Sensed Information using Artificial Neural Networks Climate Data Record (PERSIANN-CDR), Integrated Multisatellite Retrievals for Global Precipitation Measurement final run (IMERG-F), and gauge-corrected Global Satellite Mapping of Precipitation (GSMaP-Gauge) products. Subsequently, the hydrological utility of these SPPs was assessed via the variable infiltration capacity hydrological model on a daily temporal scale. Results show that the four SPPs generally demonstrate similar spatial distribution pattern of precipitation to that of the ground observations. In the period of January 1998 to December 2016, 3B42V7 outperforms PERSIANN-CDR on basin scale. In the period of April 2014 to December 2016, GSMaP-Gauge demonstrates the highest precipitation monitoring capability and hydrological utility among all SPPs on grid and basin scales. In general, 3B42V7, IMERG-F, and GSMaP-Gauge show a satisfactory hydrological performance in streamflow simulations in YRSR. IMERG-F has an improved hydrological utility than 3B42V7 in YRSR.

1. Introduction

Precipitation is a basic component of the Earth’s water cycle, and as a water flux, it connects the atmosphere with land surface processes [1]. As a critical component of both hydrological processes and energy cycles, precipitation varies remarkably in space and time [2]. For a long time, rain-gauge-based ground observations has been an important way to estimate regional precipitation. However, rain gauges are usually distributed sparsely and unevenly, and they are always insufficient for areas in complex terrain. Meanwhile, ground rain gauges can only provide point-scale observations, thereby leading to high uncertainty for precipitation observations in regions with complex terrain [3,4]. Precipitation radars are another traditional tool for precipitation estimation. Despite the high resolution of radar datasets, the data quality is not stable due to the distorted electronic signals introduced by surrounding environment [5,6]. With the rapid development of satellite-based remote sensing technology on precipitation and cloud observations on global scale, satellite precipitation products (SPPs) provide an unprecedented opportunity to overcome the limitations of gauge- and radar-based precipitation estimations. Many SPPs have been developed for scientific research and hydrometeorological applications [7], including the Tropical Rainfall Measurement Mission (TRMM) Multisatellite Precipitation Analysis (TMPA) [8], the Global Satellite Mapping of Precipitation (GSMaP) [9], the Precipitation Estimation from Remotely Sensed Information using Artificial Neural Networks (PERSIANN) [10], and the Integrated Multisatellite Retrievals for Global Precipitation Measurement (IMERG) [11]. Given that SSPs can provide near real-time remotely-sensed precipitation data on global scale, they have been widely used in the field of hydrometeorology, especially in ungauged regions. However, these products often have higher errors in comparison with ground precipitation observations, owing to their different retrieving algorithms, indirect measurement, etc. Therefore, it is of great significance to evaluate the accuracy of SPPs before they are employed for hydrometeorological applications.
Many studies have been extensively carried out on statistical evaluations of SPPs in many regions. Sapiano et al. [12] found that TMPA and PERSIANN can reproduce the spatial distribution and diurnal variation of precipitation over the United States and the Pacific Ocean; and Climate Prediction Center (CPC) Morphing Technique (CMORPH) shows the highest correlation with the validation data at 3-h and 0.25° scales. Mou et al. [13] found that PERSIANN-Climate Data Record (PERSIANN-CDR) underestimates light rain and overestimates heavy rain in Malaysia. Ushio et al. [9] concluded that GSMaP outperforms CMORPH and 3B42RT in Japan. In the United States, Tian et al. [14] found that GSMaP underestimates winter precipitation but overestimates summer precipitation. Islam et al. [15] assessed IMERG, TMPA, CMORPH, PERSIANN, and PERSIANN-CDR over Australia using the Structural Similarity Index (SSI) and found that IMERG outperforms other four SP Ps. Chua et al. [16] evaluated the CMORPH and GSMaP products in Australia and found that the skill of SPPs was reduced in regions in elevated topography. In china, Jiang et al. [17] compared four SPPs, namely, TMPA 3B42RT, CMORPH, TMPA 3B42V7, and CMORPH_adj against rain gauge observations in the Yellow River basin from 2000 to 2012. They found that TMPA and CMORPH tend to overestimate precipitation in the high-latitude semi-arid regions in the Yellow River basin and underestimate precipitation in the low-latitude regions; the gauge adjustment significantly reduces the relative bias (BIAS) in 3B42V7 (BIAS = 7.83%) and CMORPH_adj (BIAS = 9.50%). Yang et al. [18] evaluated five SPPs namely Multi-Source Weighted-Ensemble Precipitation (MSWEP), CMORPH, GSMaP, TRMM Multi-Satellite Precipitation Analysis 3B42, and PERSIANN in Yellow River Basin of China. They found that CMORPH and GSMaP made overestimations compared to the observations and MSWEP was identified as more suitable for hydrological applications. Lu et al. [19] found that IMERG has satisfactory accuracy in the Tian Shan Mountain region in China. Some of the previous studies have evaluated the hydrological utility of SPPs in different areas. Behrangi et al. [20] concluded that the PERSIANN-based hydrological simulation satisfactorily captures the general streamflow pattern at 6-h and monthly time scales in the mid-size Illinois River basin. Thom et al. [21] found that 3B42V7 presents better accuracy and hydrological utility than PERSIANN and PERSIANN-CDR in the Han River basin in Korea. Jong et al. [22] found that the significant negative biases in GSMaP and CMORPH lead to large streamflow underestimation during wet summer seasons in the mountainous region of South Korea.
Although numerous efforts have been conducted to evaluate the applicability of SPPs, the research to date has tended to focus on the tropical and mid-latitude regions rather than high-latitude and high-altitude regions. The Yellow River source region (YRSR) provides a good example of high altitude region for this purpose. The area of YRSR is approximately 122,000 km2, which accounts for 15.4% of the total area of the Yellow River basin. It is an important water conservation area and the main water-producing area in the Yellow River basin [23]. The Yellow River is the “mother river” of the Chinese nation. Accurate and reliable streamflow simulation and prediction in its upstream region is of great significance for flood control and water resources management in the downstream region of the river. However, the local rain-gauging network is very sparse and has merely 11 national weather stations that are unevenly distributed within YRSR. There exist large challenges in hydrological simulations in this region due to the scarcity and uneven distribution of ground observation stations. Previous attempts have been made to investigate the quality of various SPPs in YRSR. Meng et al. [24] found that TMPA 3B42V6 can capture the spatiotemporal features of precipitation at daily scales. Hao et al. [25] concluded that 3B42V7 is prominently superior to the near real-time TMPA product (3B42RT). Su et al. [26] evaluated four SPPs over the Upper Yellow River basin during 2001–2012 and concluded that PERSINN-CDR and 3B42V7 overestimate extreme precipitation in comparison with the gauge-based precipitation data. Lu et al. [27] evaluated the uncalibrated and gauge-calibrated IMERG SPPs together with the GSMaP moving vector with Kalman filter (GSMaP-MVK) and gauge-adjusted (GSMaP-Gauge) SPPs on the Tibetan Plateau. They concluded that the gauge-calibrated IMERG Final run (IMERG-F) and GSMaP-Gauge are more consistent with the ground precipitation observations than the non-gauge-adjusted SPPs. Besides the statistical evaluation of SPPs, the evaluation of hydrological utility of different SPPs in YRSR is very important. Yuan et al. [28] assessed the quality and hydrological utility of 3B42V7 and IMERG final run In YRSR at daily and 3-h time scales from 1 April 2014 to 31 December 2016. They found that the IMERG- and 3B42V7-based streamflow was underestimated by −1.6% and −4.5%, respectively, which resulted from the precipitation underestimation of −3.6% and −1.8% respectively by IMERG and 3B42V7; in general, IMERG and 3B42V7 can be adopted as reliable precipitation sources for runoff simulations in the YRSR. Bai et al. [29] evaluated five quasi-global SPPs such as the climate hazards group infrared precipitation with stations, CMORPH, PERSIANN-CDR, 3B42, and multi-source weighted-ensemble precipitation (MSWEP) during the period of 1998–2012 on daily scale. They found MSWEP has the best consistency with the gauge observations. Su et al. [26] evaluated CMORPH-CRT, CMORPH-BLD, PERSIANN-CDR, and 3B42V7 in 2017 and found that PERSIANN-CDR overestimated precipitation with the relative bias (BIAS) of 12.22% in calibration period; this phenomenon resulted in higher streamflow overestimation (BIAS = 12.22% in calibration period). They also indicated that the four SPPs should be used with caution in simulating massive flood events over the upper Yellow River basin.
In fact, there are still very few studies on assessing the hydrological utility of different SPPs in high-altitude regions in complex terrain such as YRSR. These complex topographic conditions lead to large errors in precipitation estimates [30]. Therefore, more SPPs should be evaluated to solve the problem of insufficient ground observation capabilities in these regions like YRSR. Given that previous studies have not yet evaluated the feasibility of GSMaP-Gauge in streamflow simulation in YRSR, this study investigated the error characteristics and hydrological feasibility of four SSPs including GSMaP-Gauge in YRSR on daily scale. The findings are expected to clarify the error features of multiple SPPs and to provide the SPP-users with useful guidelines on the choices of SPPs for hydrological applications. These findings will provide the SPP developers with the feedback on the quality of multiple SPPs in YRSR, which helps to refine the precipitation retrieving algorithms in the future. We wish that this study may also provide reference for other regions with similar terrain and climate characteristics as YRSR.

2. Study Area and Data Preparation
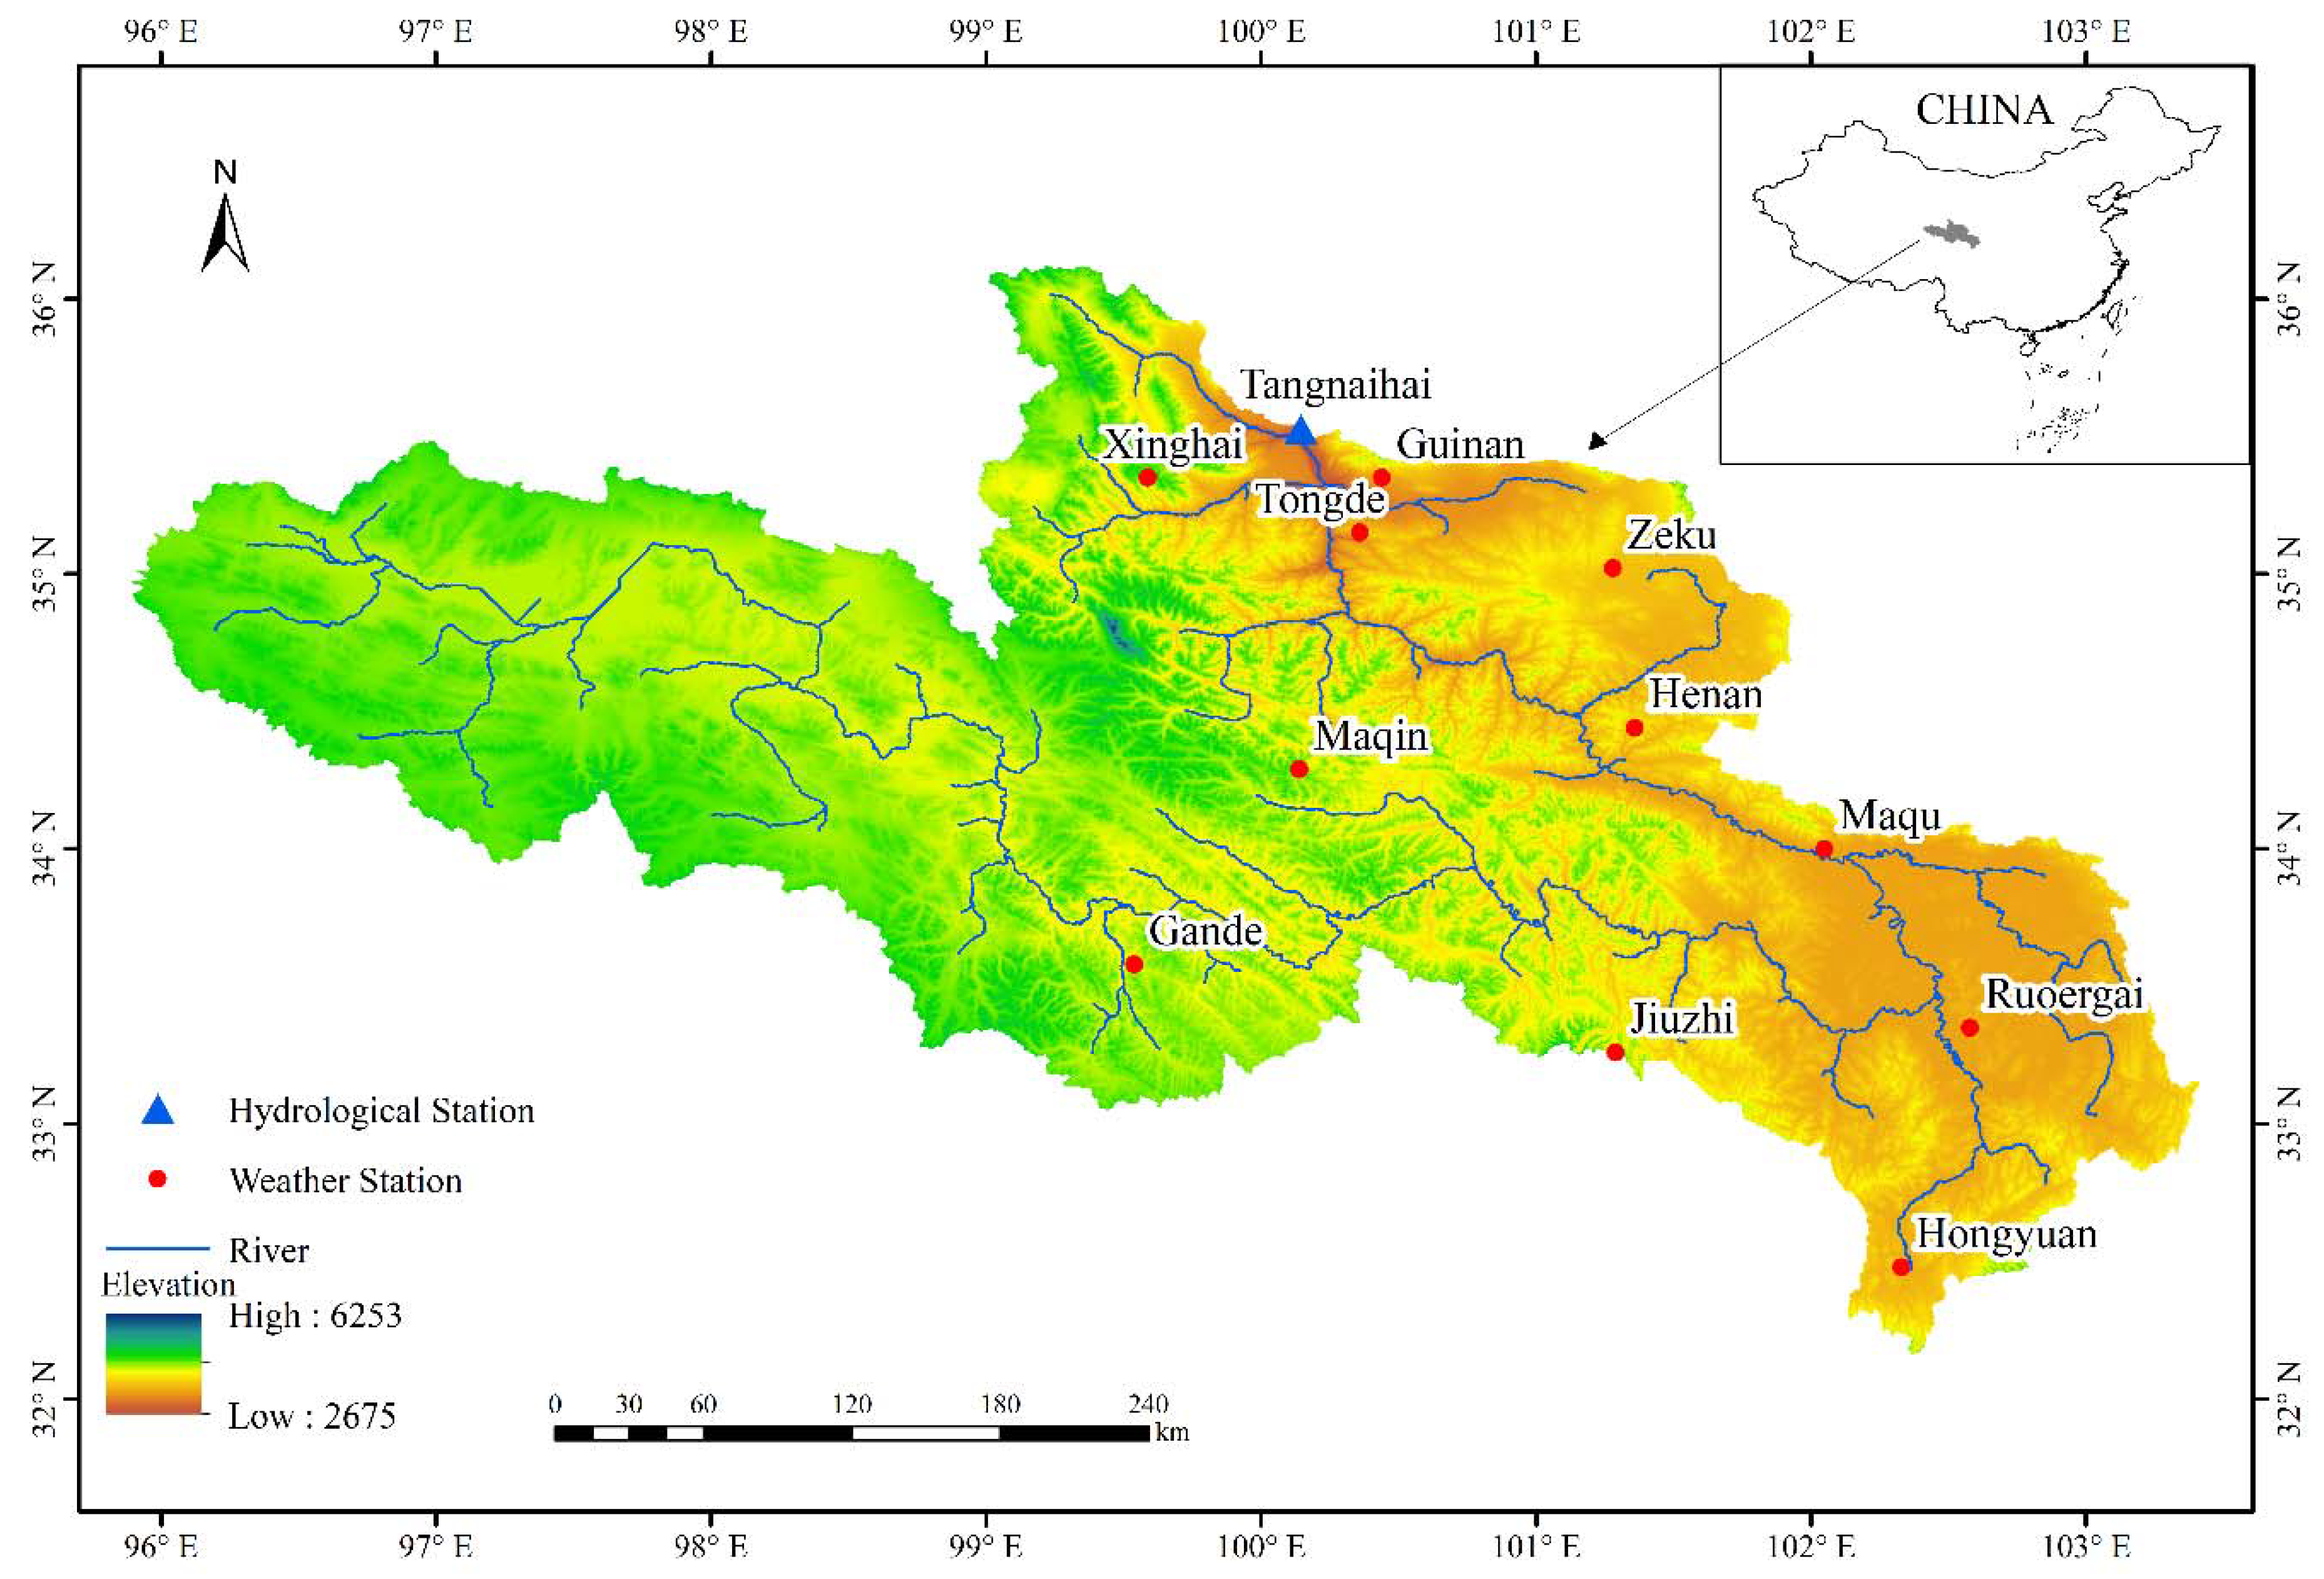
2.1. Study Area

YRSR is located on the northeast of the Qinghai-Tibet Plateau spanning 32°12′–35°48′ N in latitude and 95°50′–103°28′ E in longitude (Figure 1). It is controlled by the Tangnaihai hydrological station, with a drainage area of 1.22 × 10⁵ km2. YRSR is a typical alpine mountainous region, and the mean altitude is approximately 4000 m, with the highest altitude of 6253 m in the west and the lowest (2677 m) in the eastern region (Figure 1). This region belongs to the Qinghai–Tibet Plateau climate system [31], with a mean annual air temperature ranging from −4 °C to 2 °C. According to the statistics of local ground precipitation observations, the mean annual precipitation is highly spatially uneven, ranging from 250.0 mm in the northwest to 750.0 mm in the southeast. Precipitation is also highly non-uniform in time and is mainly concentrated in wet season. The dominant land cover is grassland, occupying 80% of YRSR. Other land cover types are swamps, steppes, and shrub meadows. In October–April, streamflow is dominated by base flow because precipitation usually falls as snow [32]. Streamflow in YRSR accounts for nearly 35% of the total runoff of the entire Yellow River basin [23]. Therefore, YRSR is very important, and it is called “water tower” of the Yellow River basin.

2.2. Data

2.2.1. Observed Meteorological and Streamflow Data

Meteorological data at 11 weather stations (Figure 1) were obtained from China Meteorological Administration. These data consist of daily precipitation and daily maximum and minimum air temperature records from 1 January 1998 to 31 December 2016. The daily streamflow data at the Tangnaihai hydrological station (Figure 1) from 1 January 1998 to 31 December 2016 were provided by the Yellow River Conservation Commission of China.

2.2.2. Satellite Precipitation Products

Four SPPs from different sources were collected for statistical and hydrological evaluations. Table 1 demonstrates the general information of the four SPPs adopted in this study.
The 3B42V7 is derived by the TRMM TMPA version 7 algorithm, using the microwave-infrared satellite precipitation estimates united with gauge adjustments. Moreover, 3B42V7 provides precipitation estimates between 50° S and 50° N on a 0.25° spatial resolution and a three-hour time interval. The TRMM 3B42V7 three-hour SPP with a latency of one month from 1 January 1998 to 31 December 2016, is downloaded from the Precipitation Measurement Mission website (https://gpm.nasa.gov/data-access/downloads/trmm).
PERSIANN-CDR is generated by the PERSIANN algorithm using the GridSat-B1 infrared data. It provides consistent, long-term, high-resolution (0.25°), and quasi-global (50° S–50° N) precipitation estimates. PERSIANN-CDR is particularly useful to investigate the trends and changes of regional precipitation. The PERSIANN-CDR daily SPP with a latency of six months in the period of 1 January 1998–31 December 2016, was obtained from the U.S. National Oceanic and Atmospheric Administration website (https://www.ncdc.noaa.gov/cdr/atmospheric/precipitation-persiann-cdr).
IMERG is a level three precipitation product derived by the algorithm of the Global Satellite Mapping of Precipitation (GPM) satellites that were launched on 28 February 2014. This algorithm is combined with precipitation gauge analyses, microwave-calibrated infrared satellite estimates, and other precipitation estimators. It aims at inter-calibrating and interpolating multiple satellite microwave precipitation estimates on a finer spatial resolution (0.1°) with a larger quasi-global coverage (60° S–60° N) and a shorter temporal interval (30 min) than the TMPA products. The IMERG-F product is the gauge-adjusted SPP with a latency of two months. The IMERG-F V06 half-hourly precipitation product in the period of 1 April 2014–31 December 2016, was obtained from the Precipitation Measurement Missions website (https://gpm.nasa.gov/data-access/downloads/gpm).
The GSMaP project provides high-quality global precipitation maps on fine spatiotemporal resolutions through satellite data by combining the infrared data with passive microwave data. GSMaP can offer hourly Global Rainfall Map in near real-time. It is available four hours after observation and provides precipitation estimates at the latitude band of 60° S–60° N on a 0.1° spatial resolution. GSMaP-Gauge is the gauge-calibrated product with a latency of three days that adjusts the microwave-infrared reanalyzed product (GSMaP-MVK) using the gauge-based analysis of global daily precipitation of the National Oceanic and Atmospheric Administration/Climate Prediction Center. The daily GSMaP-Gauge precipitation estimates from 1 April 2014 to 31 December 2016, were downloaded from the GSMaP website (https://sharaku.eorc.jaxa.jp/GSMaP).
The 3B42V7 and IMERG-F were accumulated as daily values, and IMERG-F and GSMaP-Gauge were aggregated from 0.1° resolution to 0.25° given that the obtained four SPPs are on different spatiotemporal resolutions.

2.2.3. Topological, Soil, and Land Cover Data

The topological, soil, and land cover data sets were required by the variable infiltration capacity (VIC) model for streamflow simulations. The digital elevation model data with a 90-m resolution was downloaded from http://srtm.csi.cgiar.org/, and it was used to delineate the watershed boundary and stream network using the ArcGIS software. The global one-km land cover version 2000 (GCL2000) data was collected from the University of Maryland [33] with resolution approximately 1 km. The five-min soil texture data was obtained from the United Nations Food and Agriculture Organization [34].

3. Methodology

3.1. Statistical Metrics

Seven statistical indices were adopted to quantify the statistical and hydrological performance of SPPs. These indices are correlation coefficient (CC), root mean squared error (RMSE), relative bias (BIAS), probability of detection (POD), false alarm ratio (FAR), equitable threat score (ETS), and the Nash–Sutcliffe model efficiency coefficient (NSE).
CC was used to quantify the correlation between SPPs and gauge-based precipitation. RMSE measures the average absolute error of SPPs. ME describes the accuracy of SPPs in estimating the magnitude of precipitation. BIAS represents the systematic errors of the SPP-based precipitation estimates or the simulated streamflow. In terms of the classification score indicators, POD measures the fraction of total precipitation events accurately detected by the satellites. FAR describes the fraction of the precipitation events that are falsely detected by the satellites. ETS measures the correlation between the SPP-detected precipitation events and the observations. Nash–Sutcliffe model efficiency coefficient (NSE) and BIAS were adopted to evaluate the accuracy of the SPP-based streamflow simulations. The basic information of these statistical indices is summarized in Table 2.

3.2. VIC Model

The VIC model is a macroscale hydrological model based on soil–vegetation–atmosphere transfer scheme [35]. The VIC model simulates snowmelt, freezing, and thawing of soil ice at each grid cell. At each time step, evapotranspiration, radiative fluxes, sensible heat, and turbulent fluxes of momentum are calculated. Base flow is simulated by the conceptual ARNO base flow model [36]. In terms of runoff calculation, the variable infiltration curve combining the infiltration excess runoff and saturation excess runoff mechanisms is used in the VIC model. An extra routing module in runoff concentration is added to the VIC model, which includes a gravitational water reservoir to divide the total runoff in surface, interflow, and groundwater runoffs. Three linear reservoirs are used to simulate the hillslope runoff concentration process for each runoff component, and the Muskingum routing method computes the channel effect connecting each grid cell.
The VIC model includes three parameter categories. The vegetation parameters include a priori estimate according to the Global Land Data Assimilation System (https://ldas.gsfc.nasa.gov/gldas/). The physical soil parameters were defined on the basis of the findings of Cosby et al. [37]. Few sensitive model parameters require calibration, including the depths of top, upper, and lower soil layers, variable infiltration curve index, maximum base flow velocity, ratio of nonlinear base flow, free water storage capacity, outflow constants of interflow and groundwater runoffs, recession constants of surface, interflow, and groundwater runoff, and the Muskingum parameters. These model parameters were automatically optimized by the shuffled complex evolution method [38], and the maximum NSE was chosen as the objective function for model optimization.

3.3. Streamflow Simulation Schemes

High uncertainty exists in streamflow simulation via hydrological models [39]. In this section describes the streamflow simulation schemes adopted in this study. To achieve distributed hydrological modeling, YRSR was separated into 250 grid cells at 0.25° resolution. The VIC model parameters were calibrated against the observed streamflow at the Tangnaihai station using the gauge-based precipitation as model precipitation input. The calibration period is January 1998 to December 2011, and the validation period is January 2012 to December 2016. After model calibration, the VIC model using the gauge-precipitation-based parameters was driven by the four SPPs to perform daily streamflow simulations at the Tangnaihai station, and the hydrological performance of the four SPPs was evaluated. Given that the obtained four SPPs have different time periods, two evaluation time periods were defined as follows: (1) Period I, from January 1998 to December 2016, to assess 3B42V7 and PERSINNA-CDR and (2) Period II, from April 2014 to December 2016, to evaluate 3B42V7, PERSINNA-CDR, IMERG-F, and GSMaP-Gauge.

4. Results

4.1. Statistical Evaluation of Multiple SPPs

To evaluate the accuracy of SPPs against gauge observations, all the gauge-based precipitation data were interpolated to the 0.25° spatial scale by the inverse distance squared weighting method. The four SPPs were statistically evaluated against the gauge-based observations at grid and basin scales. At grid scale, the SPP-based precipitation estimates at the grid cells, where the weather stations are located, were statistically compared with the ground observations. At basin scale, the SPP- and gauge-based precipitation data sets were spatially accumulated into the basin-averaged precipitation and compared with each other.

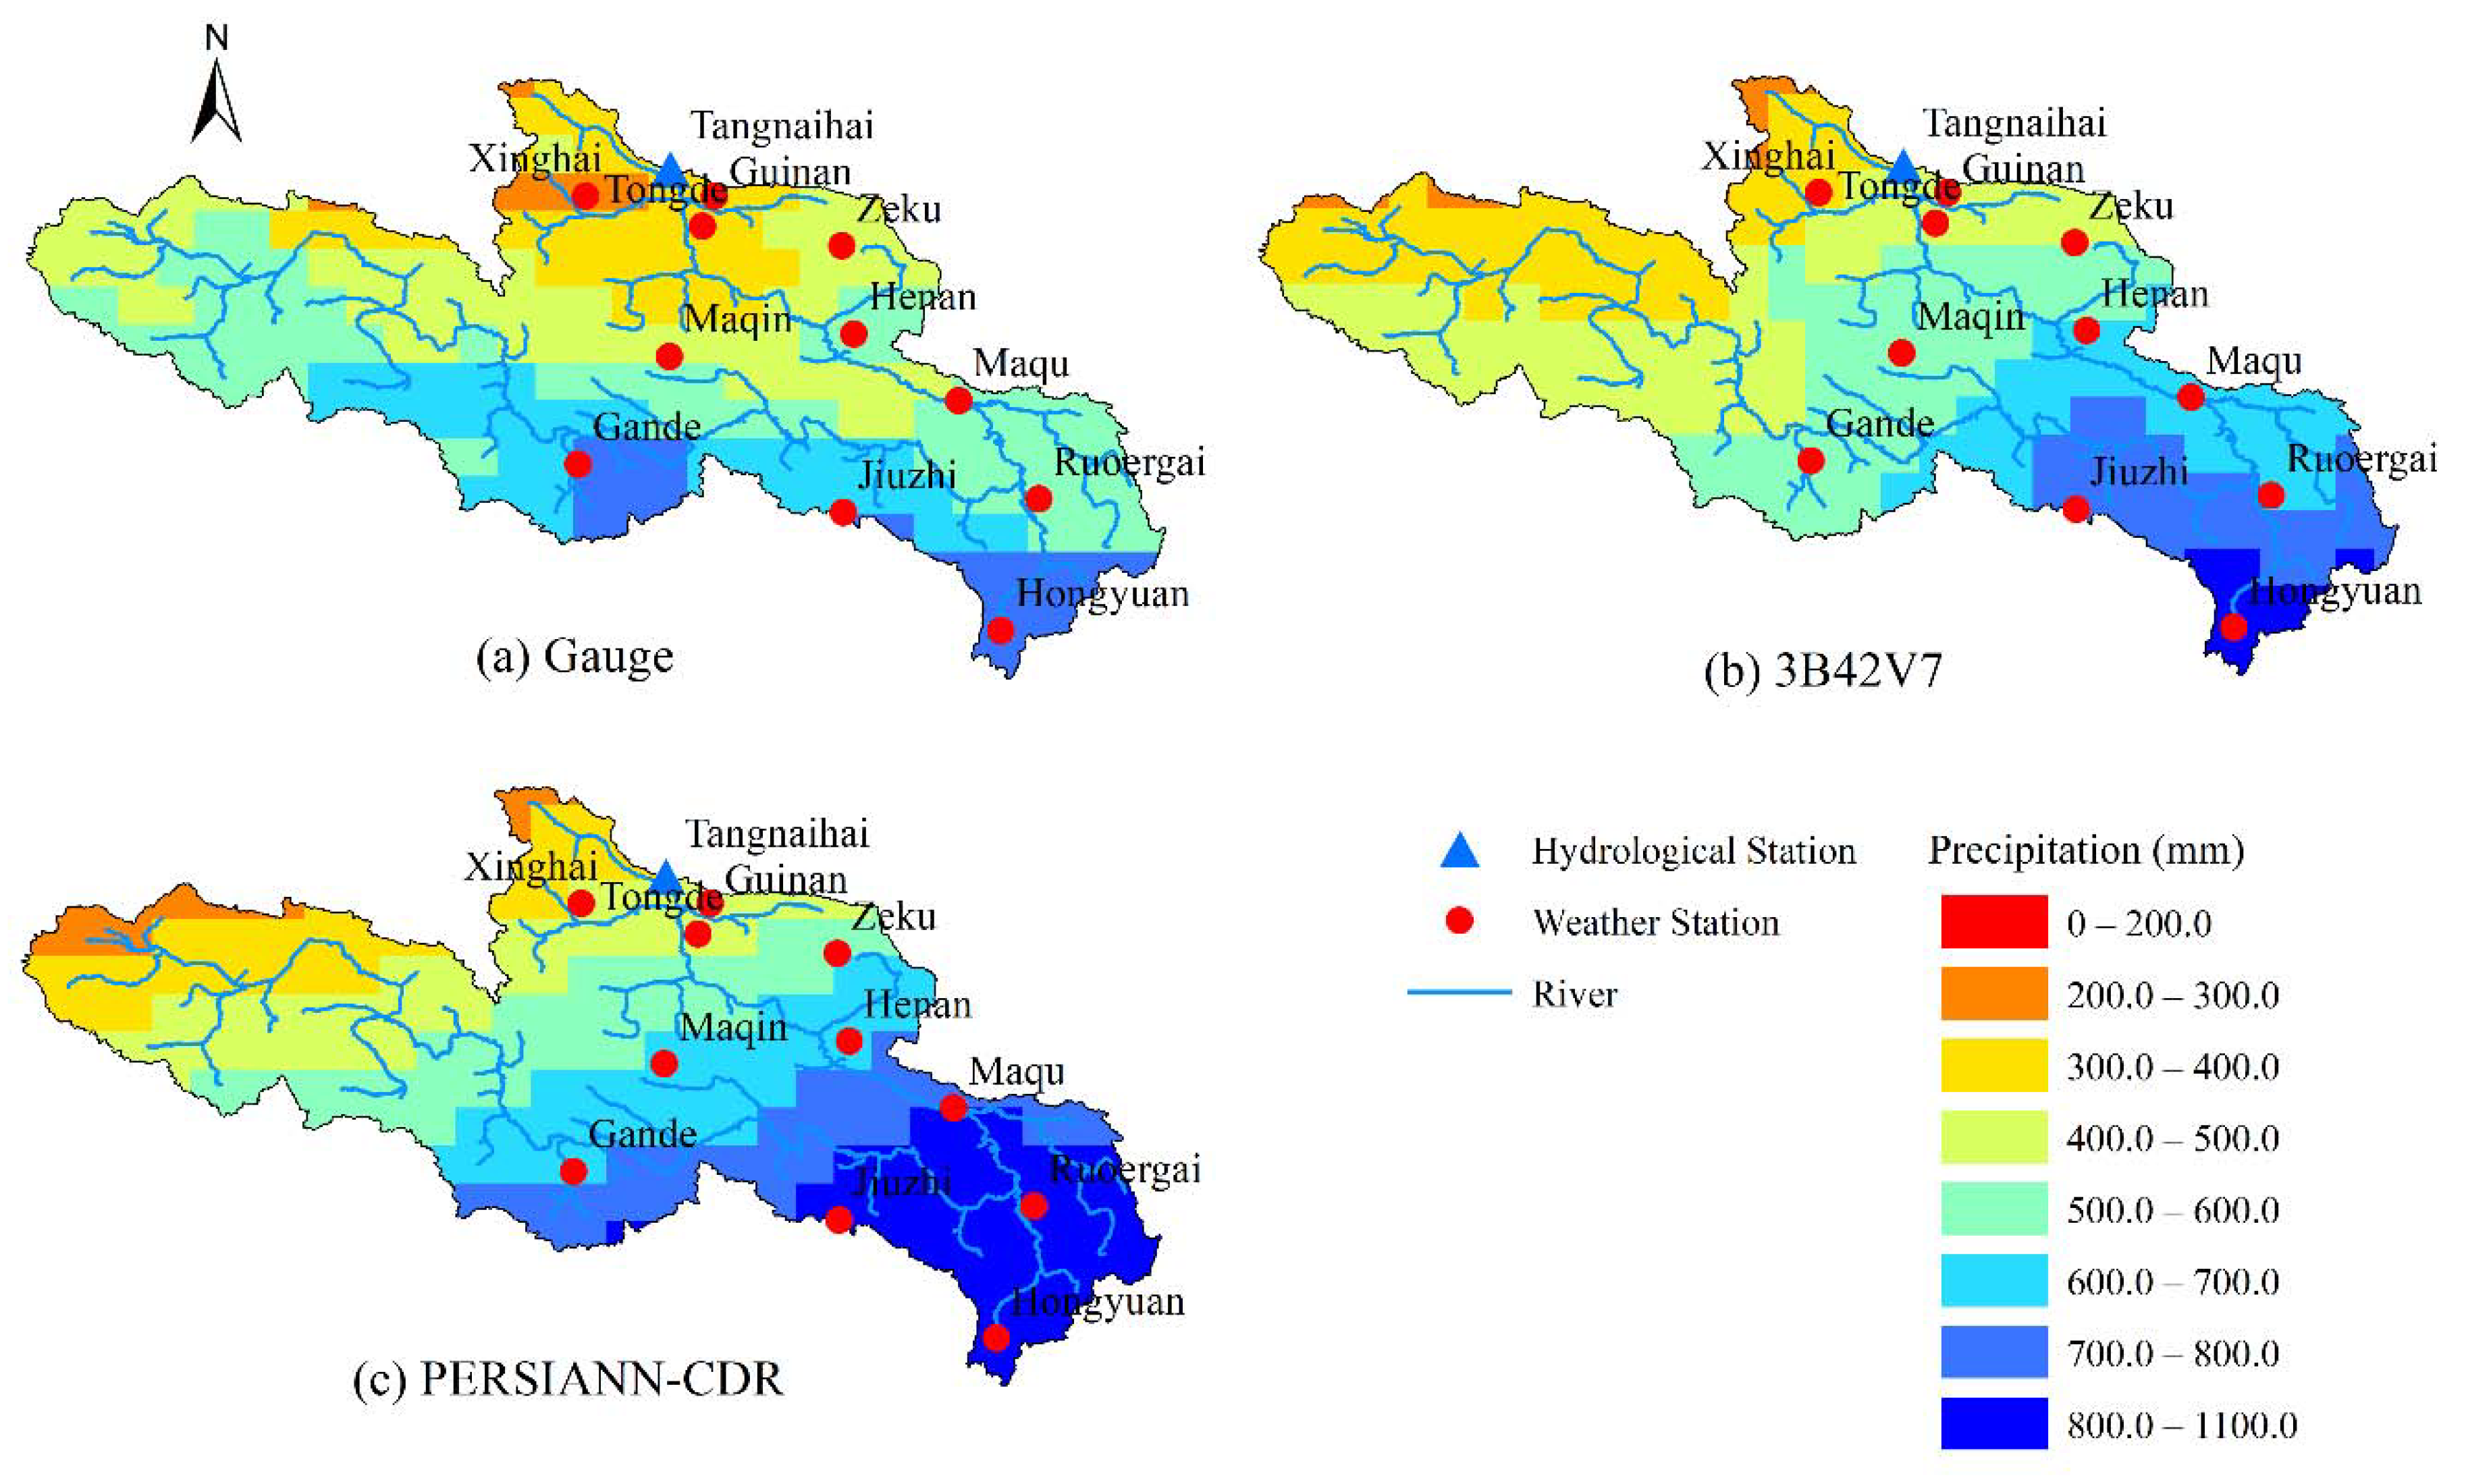
4.1.1. Evaluation for Period I

Figure 2 demonstrates the spatial distributions of mean annual precipitation estimates from 3B42V7, PERSIANN-CDR, and gauge-based precipitation data sets in Period I. In general, 3B42V7 and PERSIANN-CDR present similar spatial patterns of annual mean precipitation to those of the gauge-based data set, which shows a precipitation increase from the northwestern region to the southeast. However, 3B42V7 tends to overestimate precipitation in the southern region of YRSR, and PERSIANN-CDR provides a considerable overestimation in the southeastern region. In addition, both SPPs underestimate precipitation in the northwestern region, and PERSIANN-CDR provides higher magnitudes of underestimation than 3B42V7.
Table 3 shows the statistical indices of 3B42V7 and PERSIANN-CDR in Period I at grid and basin scales. At grid scale, 3B42V7 generally outperforms PERSIANN-CDR. 3B42V7 obtains higher values of CC (0.28), POD (0.54), and ETS (0.27) and lower FAR (0.40) than PERSIANN-CDR (CC = 0.24, POD = 0.50, ETS = 0.16, and FAR = 0.55). However, 3B42V7 presents a slightly higher RMSE (4.1 mm/d) than PERSIANN-CDR (3.6 mm/d). Both SPPs do not show evident systematic errors at grid scale with low BIAS values.
3B42V7 has better quality of SPPs at basin scale than PERSIANN-CDR in terms of all statistical indices. 3B42V7 obtains higher values of CC (0.51), POD (0.71), and ETS (0.40) and lower values of RMSE (2.4 mm/d) and FAR (0.27) than PERSIANN-CDR (CC = 0.46, RMSE = 2.8, POD = 0.66, ETS = 0.28, and FAR = 0.38). 3B42V7 overestimates the basin-averaged precipitation by 0.4%. On the contrary, PERSIANN-CDR shows an apparent overestimation at basin scale (BIAS = 16.5%).
In summary, 3B42V7 has higher precipitation detection capability than PERSIANN-CDR in Period I.

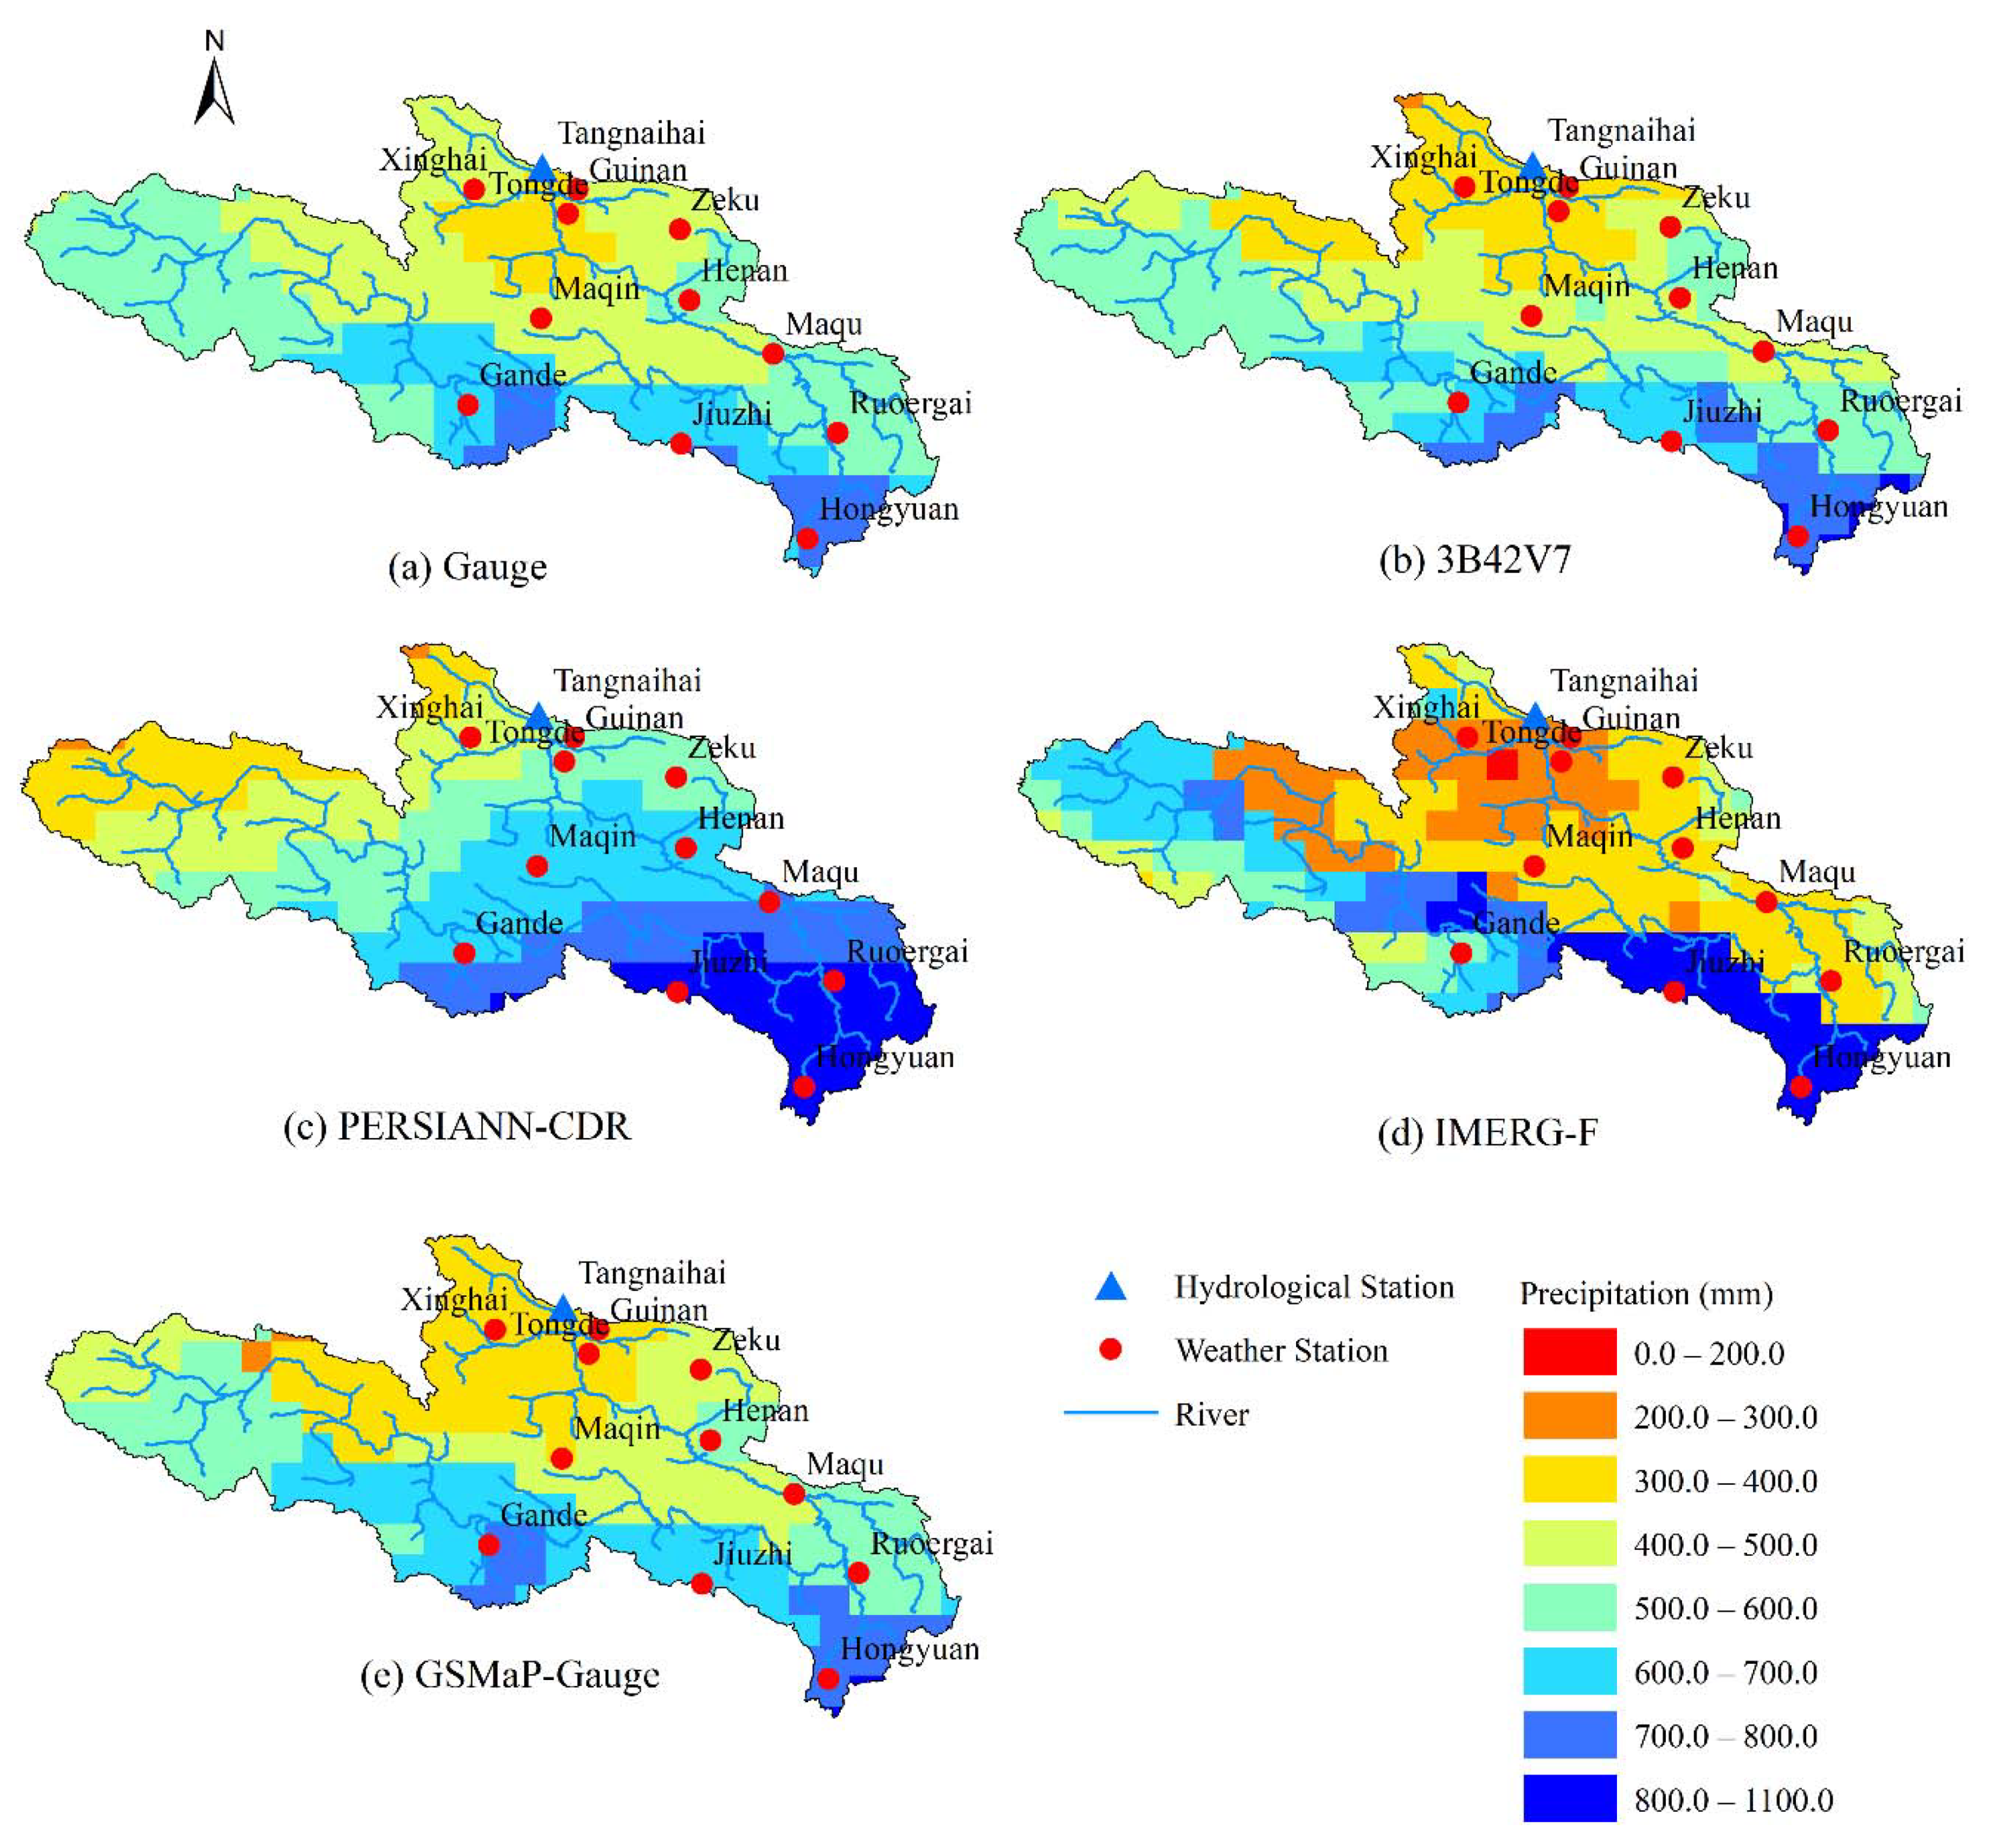
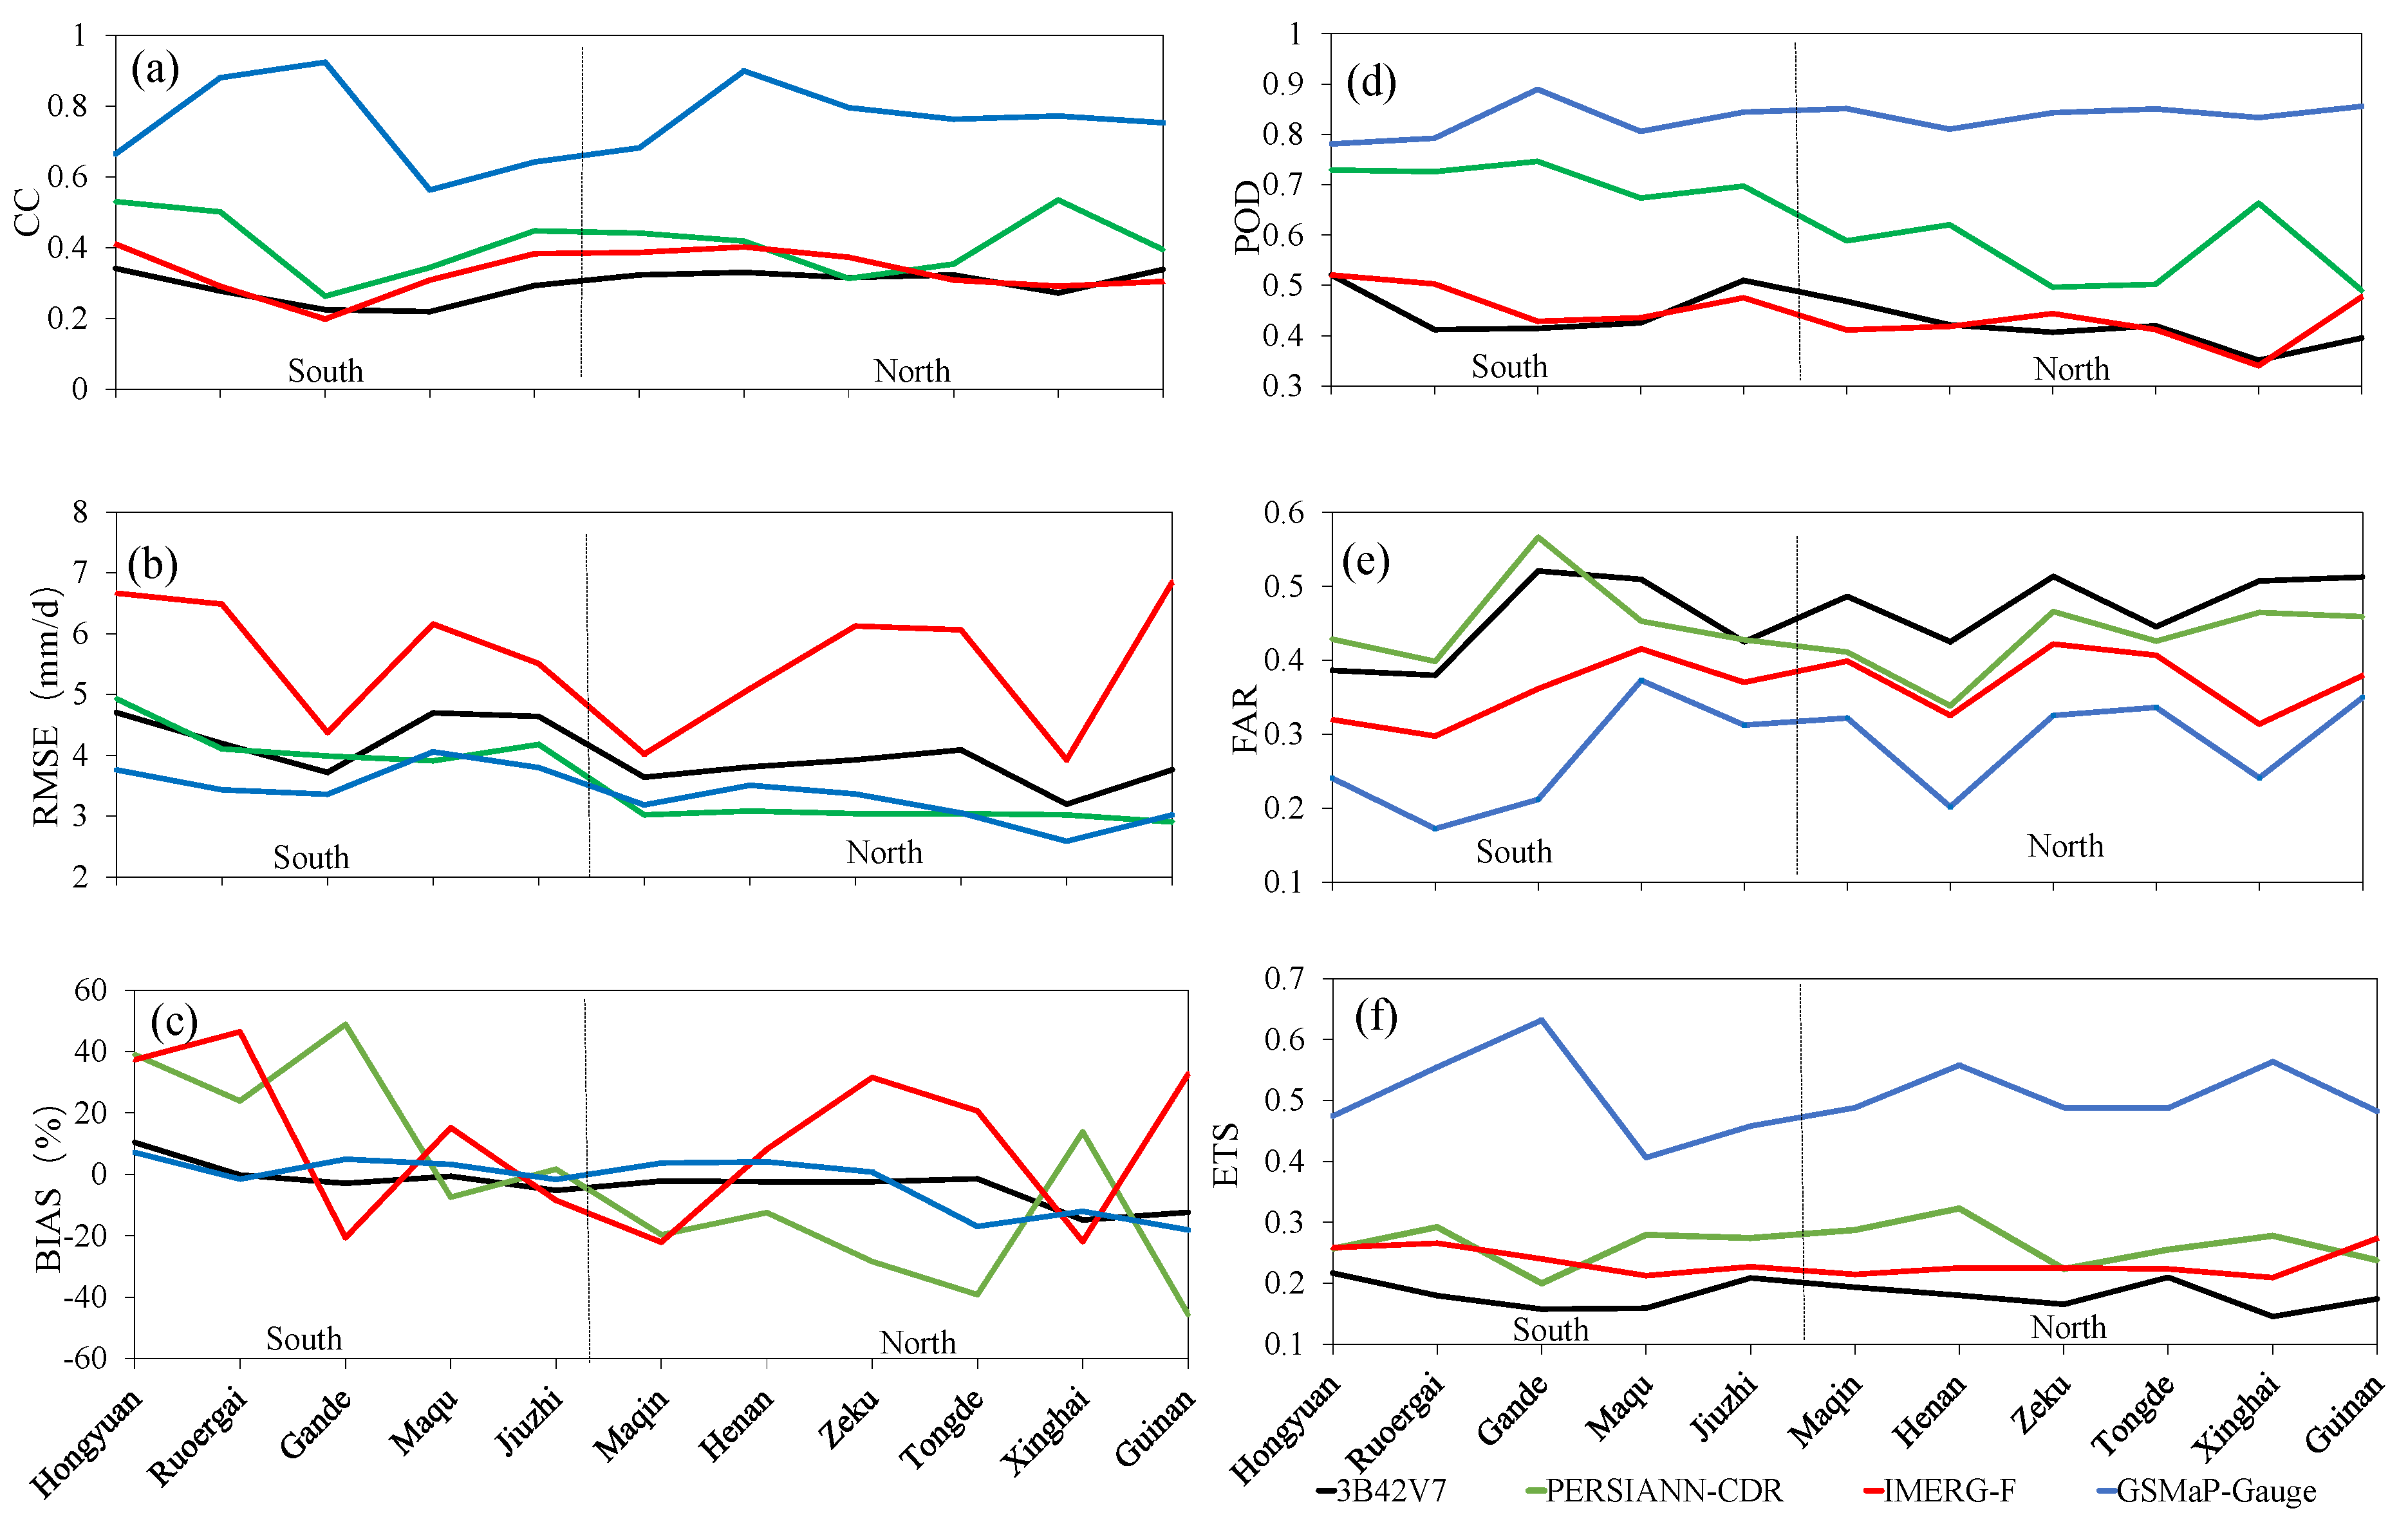
4.1.2. Evaluation for Period II

Figure 3 shows the spatial distributions of annual precipitation in 2016 derived from the four SPPs and the gauge-based precipitation data set. All SPP-based spatial distributions of annual precipitation present a decrease in precipitation from the southeast to the northwest, similar to that of the gauge-based precipitation data. Among the four SPPs, 3B42V7 and GSMaP-Gauge present spatial distributions of annual precipitation that are closest to that of the gauge-based precipitation. IMERG-F evidently underestimates precipitation in the northern and Middle Eastern regions, and PERSIANN-CDR largely overestimates precipitation in the eastern and southern regions.
To further investigate the quality of the four SPPs in relation to geographical locations, 11 local weather stations were divided into two geographical groups, as follows: (1) the stations in the southern region including the Hongyuan, Ruoergai, Gande, Maqu, and Jiuzhi stations; (2) the stations in the northern region consisting of the Maqin, Henan, Zeku, Tongde, Xinghai, and Guinan stations. For each SPP-based daily precipitation data set, the statistical indices were calculated at the locations of the weather stations in each geographical group for Period II (Figure 4). Meanwhile, the box plots were plotted for all the four SPPs in terms of the statistical metrics at the locations of the 11 weather stations (Figure 5). In comparison with other SPPs, GSMaP-Gauge has the highest correlation with the ground precipitation observations (Figure 4a and Figure 5a) and obtains the highest POD and ETS (Figure 4d,f and Figure 5b,f) as well. Meanwhile, the values of RMSE, BIAS, and FAR of GSMaP-Gauge are the lowest (Figure 4b,c,e). No clear trend of the statistical indices was found between the two geographical groups, except that 3B42V7, PERSIANN-CDR, and GSMaP-Gauge provide lower RMSE values in the northern group than in the southern group (Figure 4c). In addition, the IMERG-F-based POD at the southern stations is higher than that at the northern stations (Figure 4d).
On grid scale, GSMaP-Gauge demonstrates the best quality among the four SPPs (Table 4 and Figure 5). 3B42V7 is in the lowest correlation with the ground precipitation observations (CC = 0.30). IMERG-F significantly overestimates precipitation by 10.8% and has the highest RMSE (Figure 4b and Figure 5b). Although PERSIANN-CDR demonstrates the highest FAR values (Table 4), its quality ranks second after GSMaP-Gauge in terms of other statistical indices.
Table 4 demonstrates that as spatial scale becomes coarser, the accuracy of all SPPs slightly improves. Compared with the statistical indices on grid scale, all SPPs obtain slightly lower RMSE values and evidently higher CC values on basin scale. In addition, their systematic errors are reduced, except for that of GSMaP-Gauge with a slightly increased magnitude of precipitation underestimation. Among the four SPPs, PERSIANN-CDR obtains the highest RMSE values (2.8 mm/d) with a BIAS value of 13.8%. The three other SPPs mildly underestimate the basin-averaged precipitation, and IMERG-F has the highest magnitude of precipitation underestimation (BIAS = −3.9%). On basin scale, all SPPs obtain a POD score exceeding 0.60, and GSMaP-Gauge obtains the highest score (POD = 0.85). 3B42V7 provides inferior FAR and ETS scores (0.40 and 0.25, respectively), and GSMaP-Gauge presents the best scores (FAR = 0.20 and ETS = 0.58). In summary, GSMaP-Gauge has the best performance in retrieving the basin-averaged precipitation among the four SPPs.

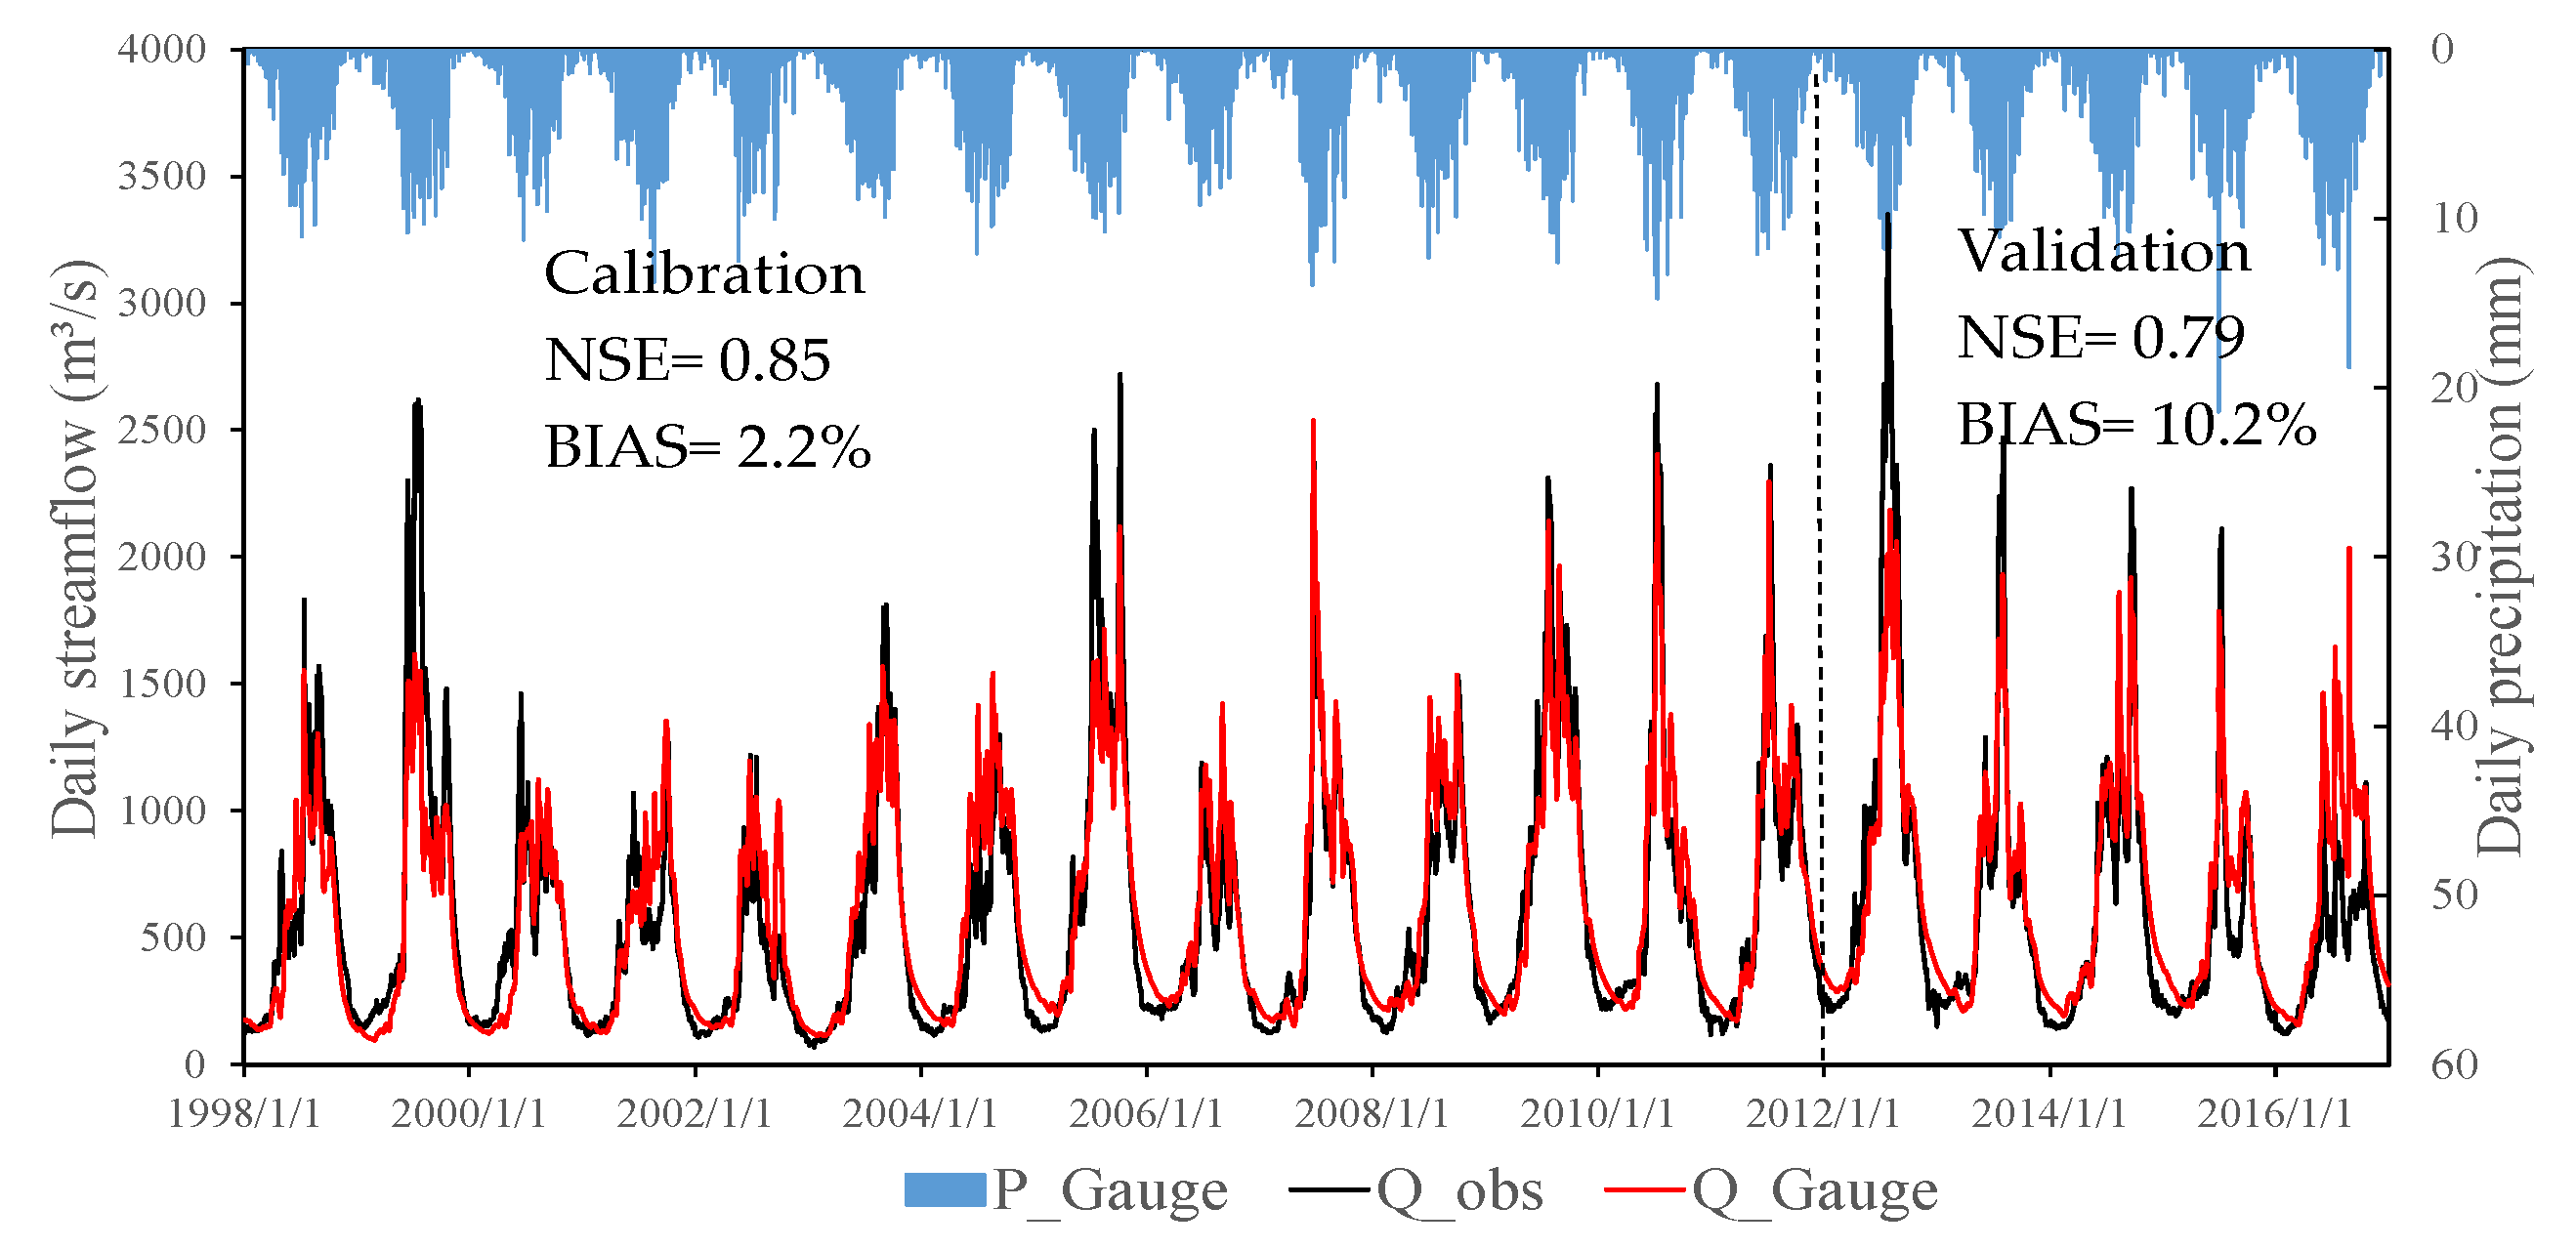
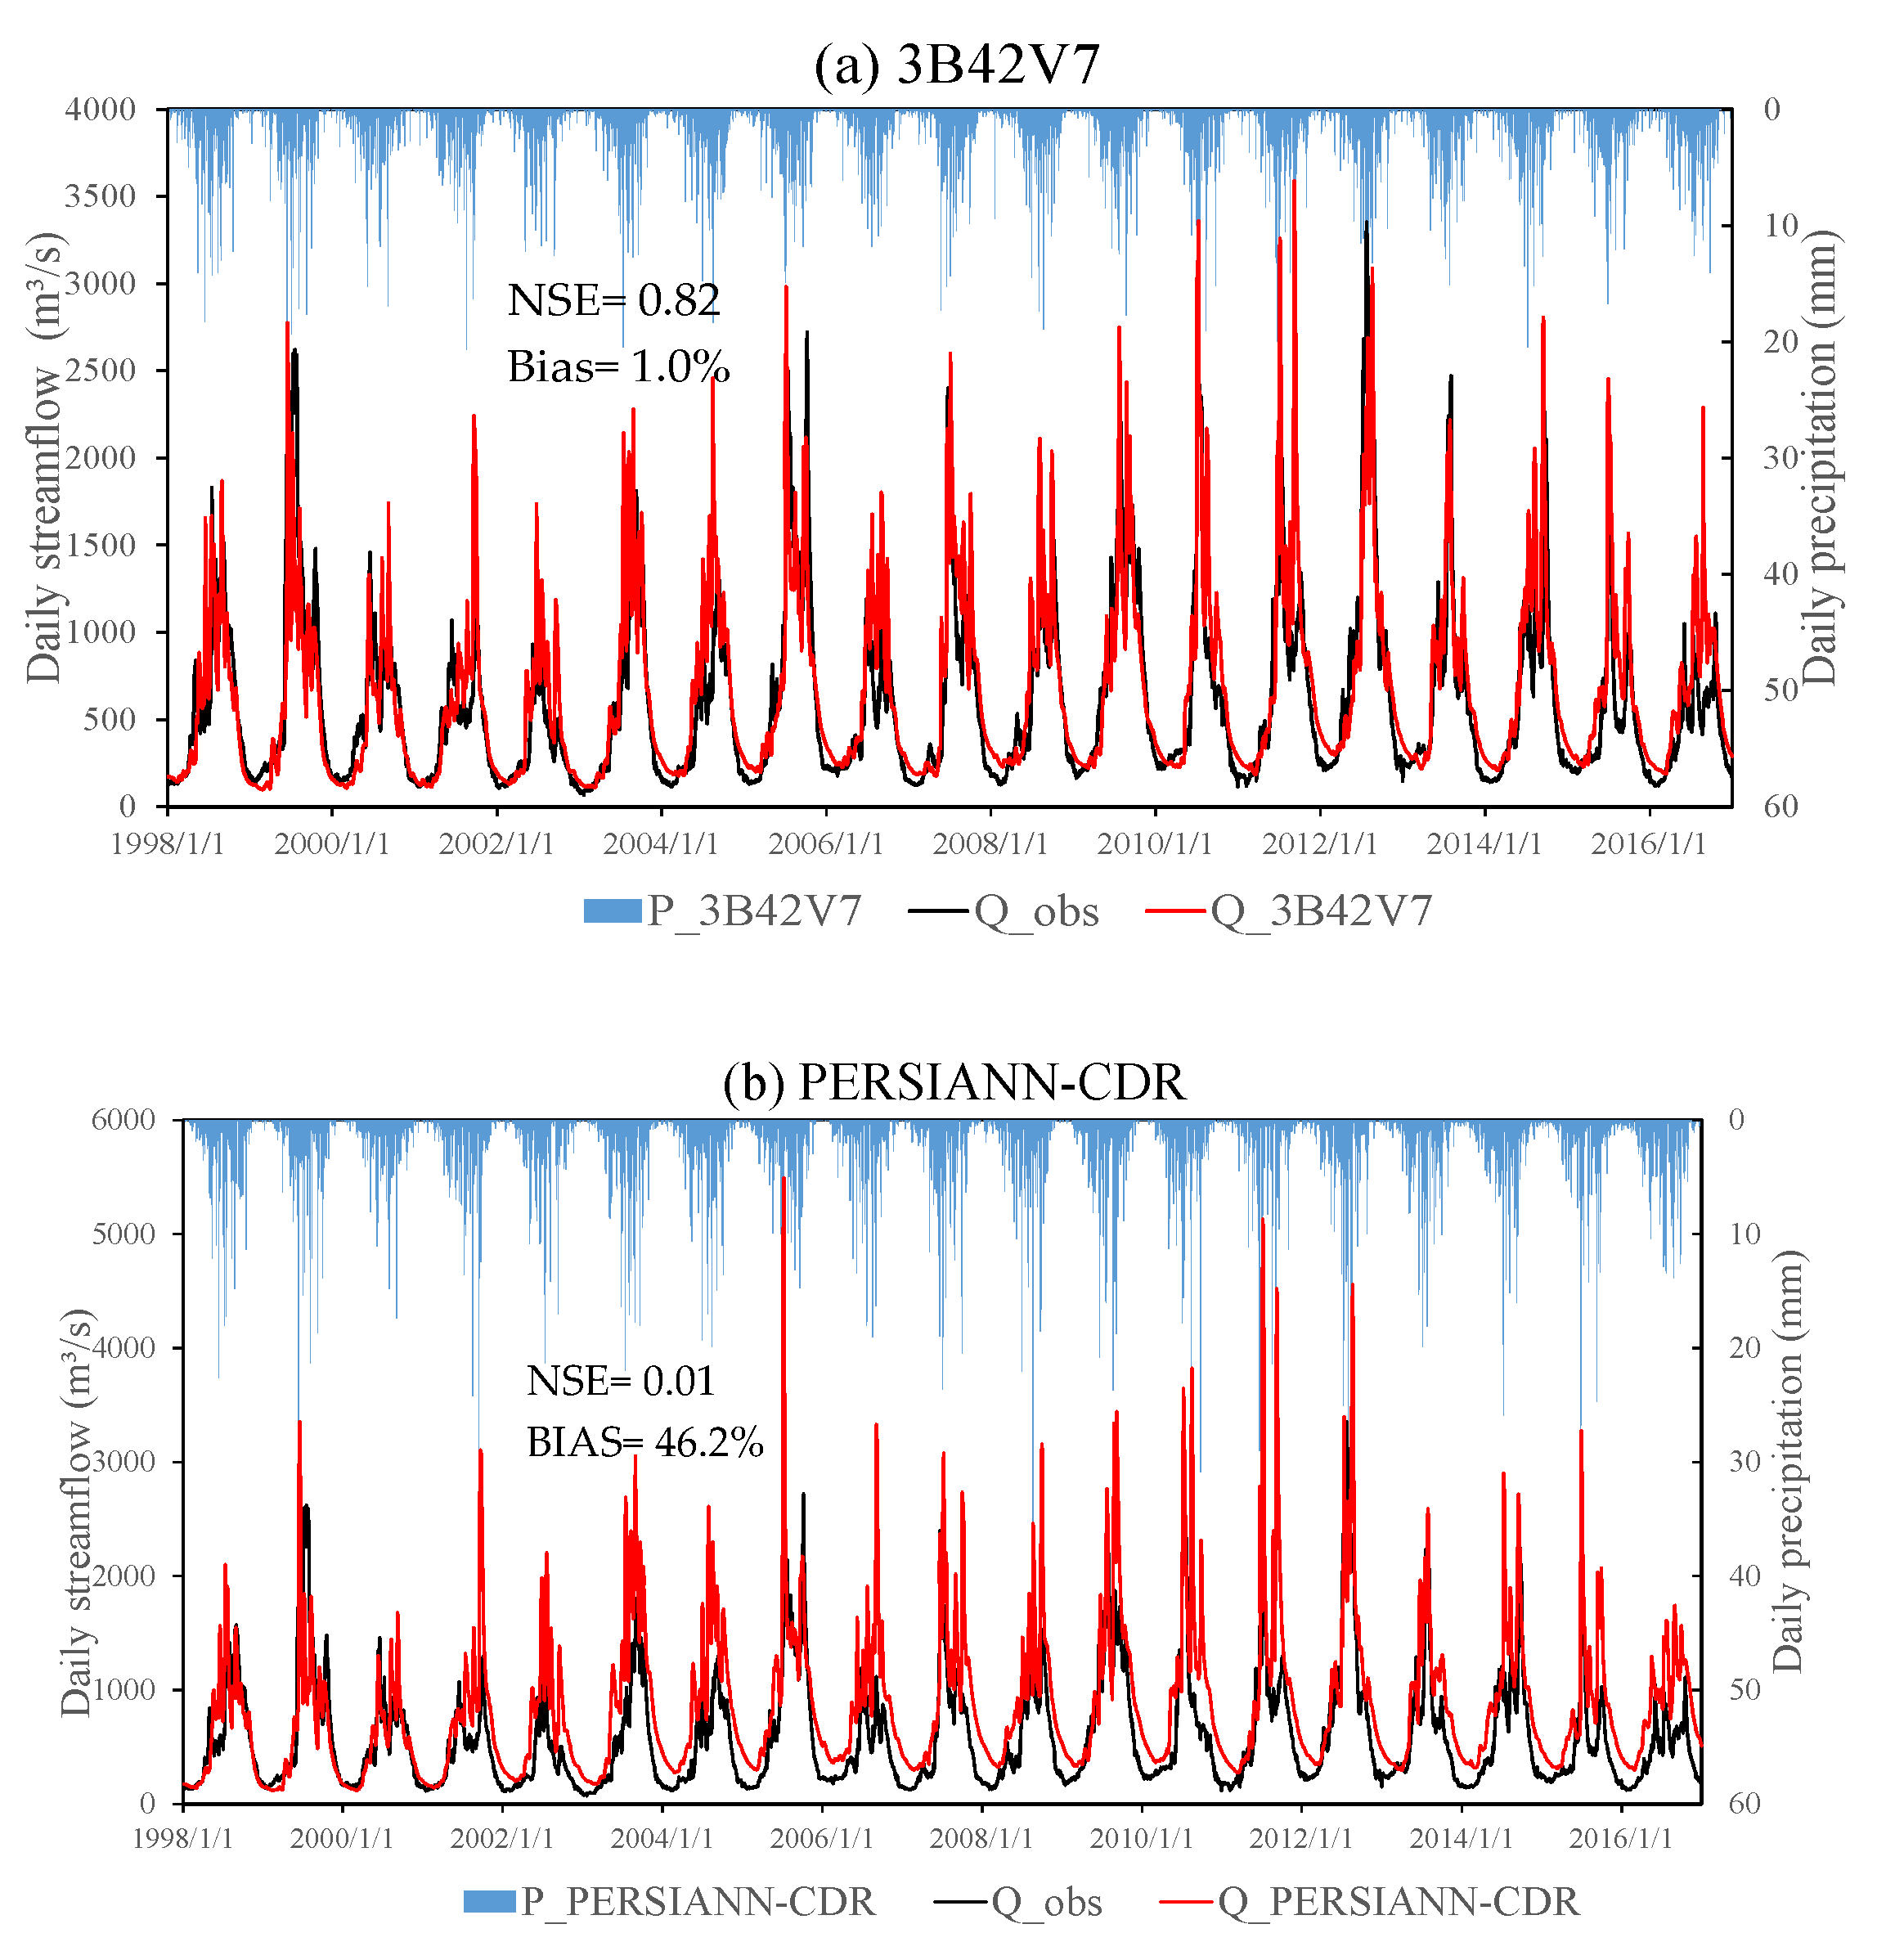
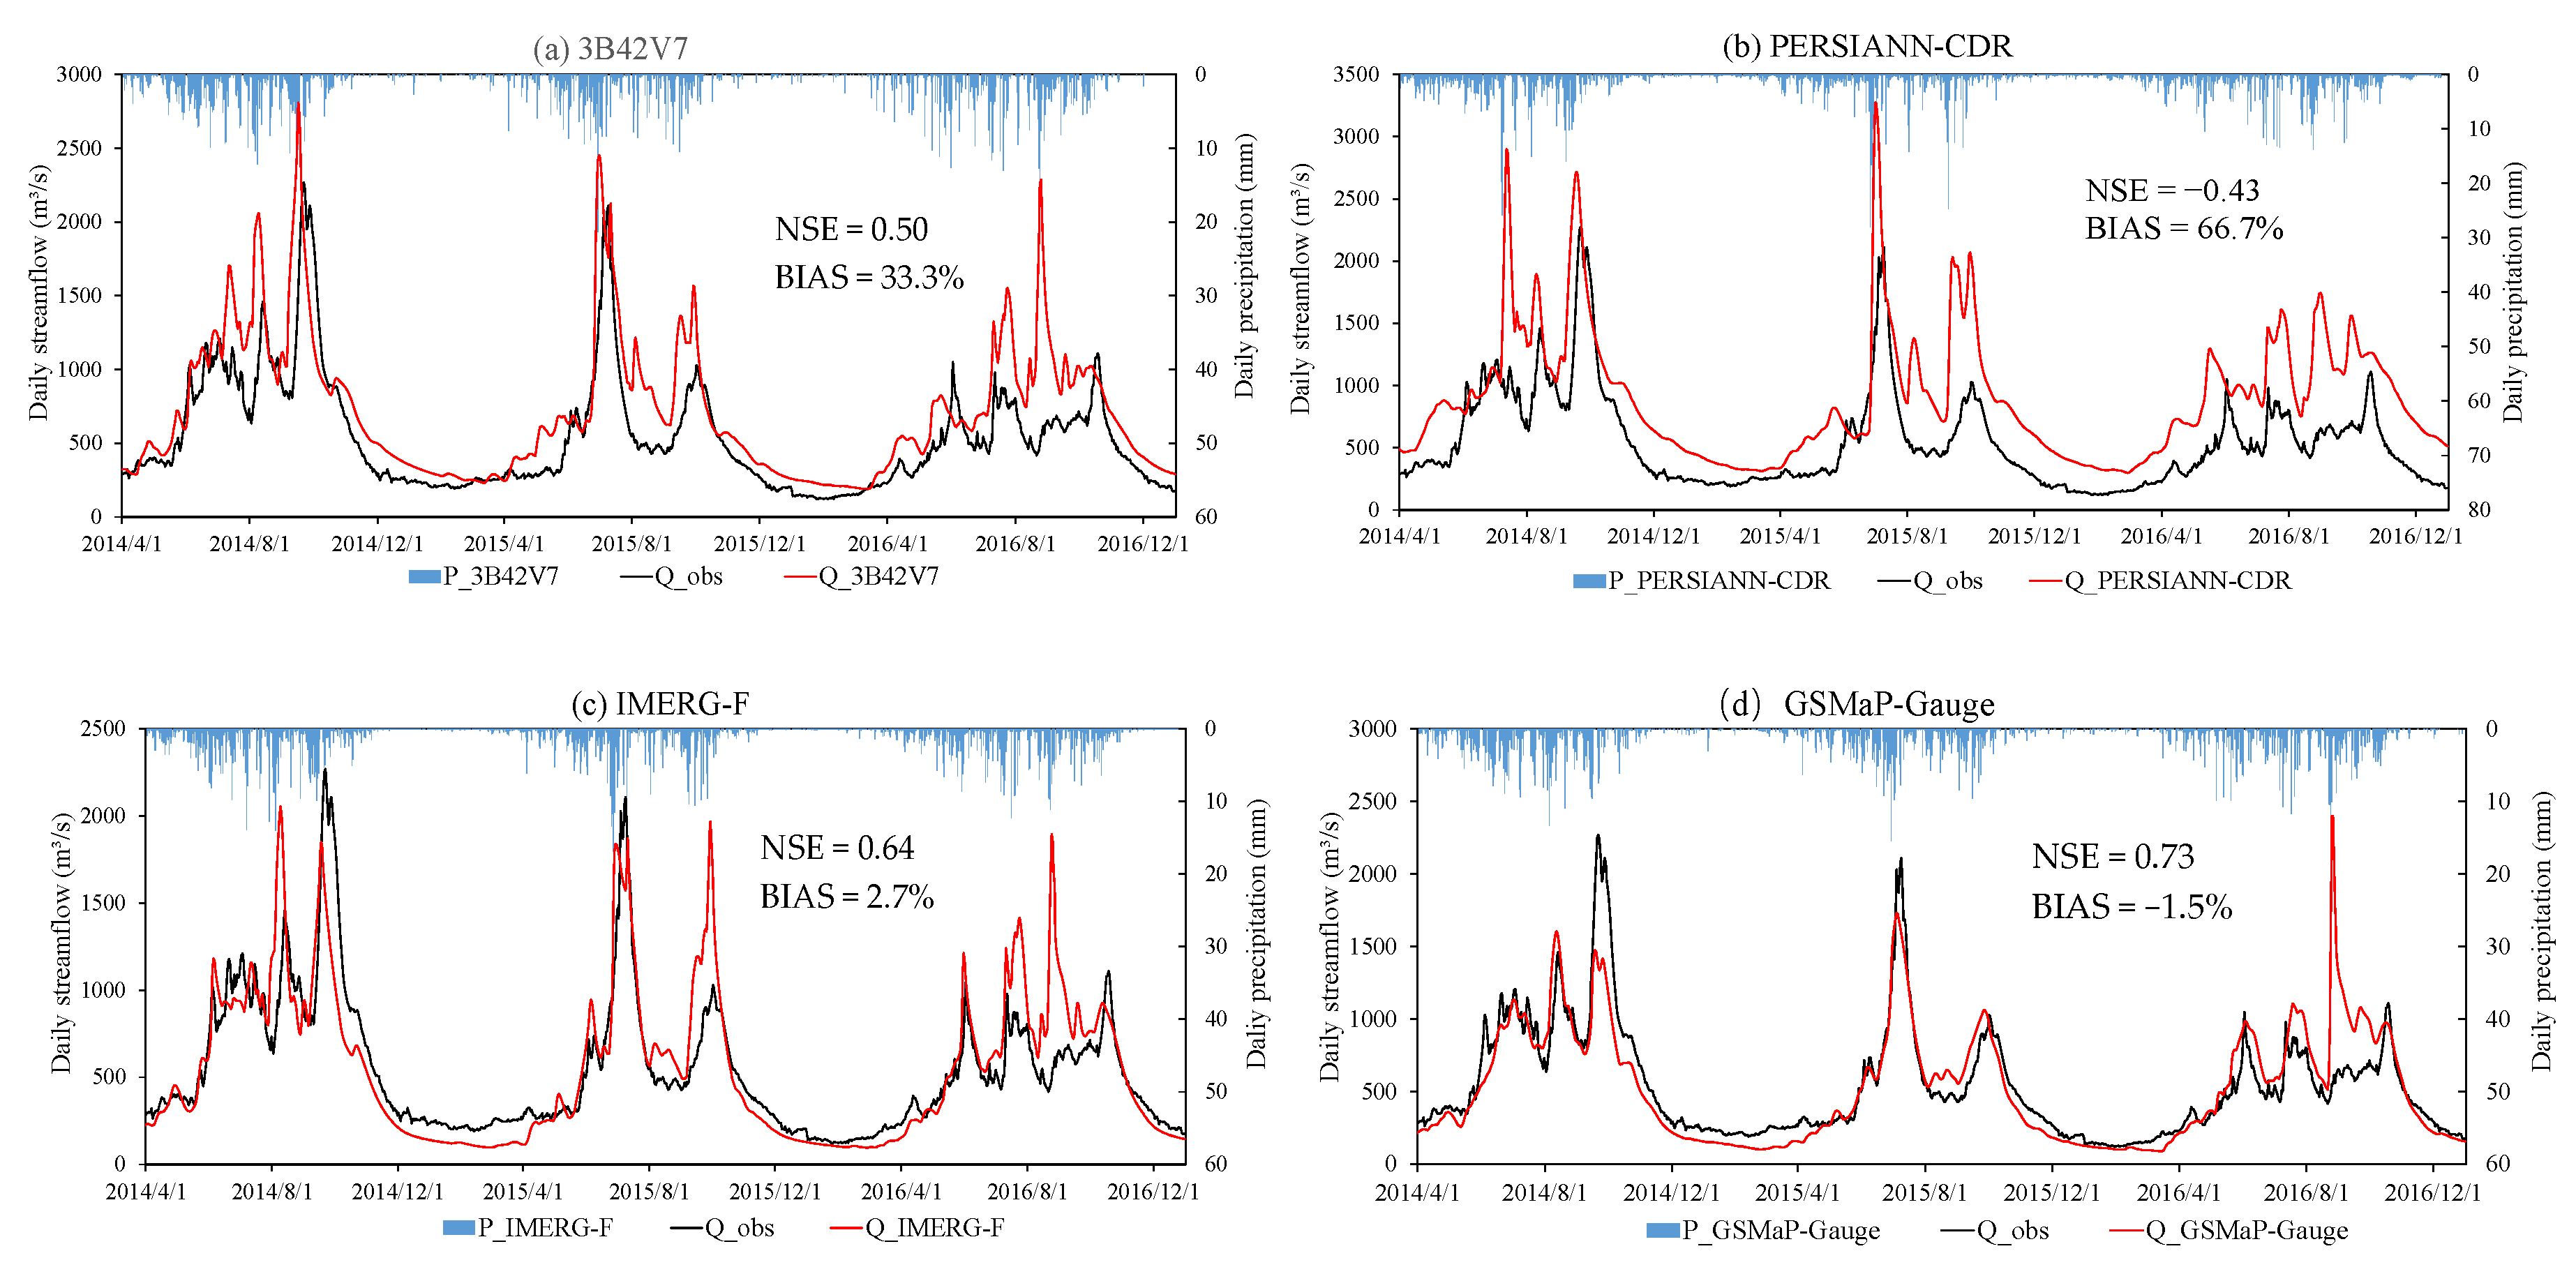
4.2. Daily Streamflow Simulations

Figure 6 compares the observed daily hydrograph at the Tangnaihai station with the simulated hydrograph using the gauge-based precipitation in the calibration and validation periods. In the calibration period, the VIC model using the rain gauge precipitation obtains satisfactory performance in daily streamflow simulation, with a high NSE value of 0.85 and a low BIAS value of 2.2%. In the validation period, the hydrological performance slightly worsens with NSE of 0.79 and BIAS of 10.2%. However, the VIC model generally underestimates few peak flows in both periods. The possible reason is that the local sparse rain-gauge network might not fully capture the precipitation storm centers, to a large extent, thereby leading to the underestimation of high flows.
After model calibration, the VIC model using the rain-gauge-benchmarked model parameters was driven by the 3B42V7 and PERSIANN-CDR SPPs to conduct daily streamflow simulations in Period I, and the hydrological utility of these SPPs was evaluated. Figure 7a displays that the 3B42V7-based simulated hydrograph is in good agreement with the observed streamflow and peak flows with NSE of 0.82 and BIAS of 1.0%. Although the PERSIANN-CDR-based model run captures the temporal variations of historical daily streamflow, it evidently overestimates total streamflow by 46.2% and shows an inferior hydrological performance with an NSE value of 0.01. The streamflow overestimation could be attributed to the fact that PERSIANN-CDR considerably overestimates precipitation at basin scale by 16.5%.
Meanwhile, the rain-gauge-benchmarked VIC model was forced by the four SPPs to simulate the daily streamflow at the Tangnaihai hydrological station in Period II (April 2014 to December 2016). As shown in Figure 8, the 3B42V7 and IMERG-F-based model runs slightly overestimate streamflow by 7.8% and 2.7%, respectively. The PERSIANN-CDR-forced VIC model presents a remarkable streamflow overestimation (BIAS = 66.7%), mainly arising from the considerable overestimation (13.8%) of the basin-averaged precipitation in PERSIANN-CDR. The GSMaP-Gauge-driven model run provides a slight streamflow underestimation of 1.5%. The GSMaP-Gauge-based simulation obtains the best NSE performance (NSE = 0.73), followed by the IMERG-F- and 3B42V7-forced model runs (NSE = 0.64 and 0.50, respectively), and the hydrological performance of PERSIANN-CDR is inferior with an NSE of −0.43.
Extreme flows are essential for water resources management [40]. This study assessed the performance of the four SPPs in reproducing daily streamflow at different levels. Here, the observed daily streamflow in Period II exceeding its 90% quantile and lower than its 10% quantile was defined as high and low flows, respectively, and normal flow was specified as the observed streamflow quantile between the 10% and 90% levels. Subsequently, the rain-gauge- and SPP-based daily streamflow data sets in Period II that correspond to the observed daily high, normal, and low flows were quantitatively evaluated in accordance with CC and BIAS.
Table 5 demonstrates the performance of the rain-gauge- and SPP-based model runs in simulating historical high, normal, and low flows. Forced by the rain-gauge-based precipitation data set, the VIC-model obtains high CC values (0.81 and 0.89) in the high- and low-flow simulations. However, in the case of low flow simulation, the model presents a relatively low CC (0.23) with a significant low flow overestimation (BIAS = 45.2%). Meanwhile, the rain-gauge-based model run overestimates normal flow by 41.9%. The main reason is that the maxima of NSE is adopted as the objective function for model optimization, thereby providing low weights to low flow. Furthermore, owing to the sparse rain gauge network, the rain-gauge-precipitation data might evidently overestimate the basin-averaged precipitation in 2016, to a large extent. Thus, remarkable streamflow overestimation is observed at almost all streamflow levels. Among the four SPPs, GSMaP-Gauge obtains the best performance in simulating streamflow at different levels. In high flow simulation, the performance of GSMaP-Gauge is comparable to that of the rain-gauge-based precipitation data set. Even in normal and low flow simulations, GSMaP-Gauge evidently outperforms the rain-gauge-based precipitation data. IMERG-F obtains satisfactory hydrological performance. In particular, IMERG-F presents better performance in low and normal flow simulations than the rain-gauge-based data. 3B42V7 demonstrates acceptable hydrological performance but with an evident streamflow overestimation at all the three levels, in particular, at the normal- and low-flow levels. Owing to the considerable precipitation overestimation, PERSIANN-CDR shows inferior hydrological performance to large streamflow overestimation at all levels, and the PERSIANN-CDR-based model run demonstrates a low-flow overestimation of 126.1%.

5. Discussion

Four widely used SPPs (3B42V7, PERSIANN-CDR, IMERG-F, and GSMaP-Gauge) were statistically evaluated against the ground precipitation observations in YRSR, and their hydrological utility were assessed via the VIC-model-based streamflow simulations.
At basin scale, the CC values of the SPPs are higher than 0.4 but less than 0.6, except for GSMaP-Gauge (CC = 0.87). However, different SPPs demonstrate large disparity in BIAS. 3B42V7 and PERSIANN-CDR overestimate precipitation in Period I. This finding agrees with that of Su et al. [26]. They found that PERSIANN-CDR overestimates extreme precipitation in the upper Yellow River region, which results in an obvious streamflow overestimation. Despite the complicated topography in YRSR, GSMaP-Gauge shows the best precipitation retrieving capability among the four SPPs. Shi et al. [41] compared three IMERG SPPs and three GSMaP SPPs in YRSR. They found that GSMaP-Gauge presents the highest capability at the daily scale. Similar findings were found in many other Asian regions. Yoshimoto et al. [42] concluded that GSMaP-Gauge performs better than the PERSIANN and TMPA SPPs in the eastern Sri Lanka. Ning et al. [43] also found that GSMaP-Gauge outperforms IMERG-F, in particular, in the Haihe, Huaihe, Liaohe, and Yellow River basins of China. This study found that the GSMaP-Gauge-based streamflow simulation obtained the highest NSE of 0.73 and the lowest BIAS of −1.5% in comparison with other SPP-based simulations. This indicates that GSMaP-Gauge has the best hydrological utility among the four SPPs in this study. This finding reveal that the state-of-the-art GSMaP-Gauge is feasible for hydrological applications in YRSR. It is suggested that hydrological evaluation of GSMaP-Gauge in other regions with similar topographic and climatic characteristics to YRSR should be conducted in the future.
IMERG-F demonstrates slightly better statistical and hydrological performance than 3B42V7. This finding reveals that as a substitute of 3B42V7, IMERG-F has improved precipitation detection capability and hydrological feasibility in YRSR. Ma et al. [44] also found that IMERG-F shows appreciably better correlations with ground observations and contains lower errors than 3B42V7 on three-hour scale in the warm season of 2014 on the Tibetan Plateau, where YRSR is located. Tang et al. [45] found that IMERG-F better captures the diurnal cycle of precipitation than 3B42V7 on Tibetan Plateau. Furthermore, few previous studies confirmed this finding in other regions, such as the USA [46], the Mekong River basin [47], Japan [48], West and East Africa [49], and the Beijing River basin [50].
The rain-gauge-based streamflow simulation underestimates most peak discharges in Period I. By contrast, the 3B42V7- and PERSIANN-CDR-based streamflow simulations overestimate peak discharges in Period I using the rain-gauge-benchmarked model parameters. The possible reason is that the local rain-gauging network is very sparse with merely 11 national weather stations that are unevenly distributed in YRSR. The sparse rain-gauging network may not sufficiently capture the storm centers, which might lead to underestimated peak flows. The peak flow overestimation in the SPP-driven model runs is mainly caused by the systematic precipitation overestimation in SPPs. Another explanation is that the SPP-driven model runs adopted the rain-gauge-based model parameters that might be biased from the actual hydrological features. In the future, model parameters will be recalibrated using the SPP estimates as model inputs, and the simulated streamflow using different parameter calibration schemes will be compared to select the suitable parameter sets for the SPP-driven streamflow simulations. This finding also reveals that a denser rain gauge network in YRSR should be urgently established to improve the reliability of ground precipitation observations at basin scale and to provide more reliable ground precipitation data for SPP evaluations. In addition, the density and distribution pattern of rain gauges should be considered when ground precipitation data are used as the benchmark to evaluate the statistical and hydrological performance of SPPs.
This study mainly focused on evaluating SPPs on a daily scale, but did not assess the accuracy of SPPs in detecting precipitation at different intensity levels. As a matter of fact, the detection capability of SPPs highly depends on rainfall intensity. Chua et al. [16] evaluated CMORPH and GSMaP in Australia and concluded that satellites tend to overestimate low-precipitation events and underestimate high-precipitation in terms of frequency and amount. They also indicated that SPPs have the highest skill to detect moderate rainfall events. Precipitation on daily scale provide important data for the studies of water resources management and climate-change. Meanwhile, reliable and timely precipitation data on sub-daily scales are urgently needed for effective flood simulation and prediction. Only a few previous studies conducted the evaluation of SPPs on sub-daily scales in different areas. Islam et al. [51] evaluated six SPPs on 3-, 6-, 12-, and 24-h temporal scales and concluded that as the temporal window increases, the detection capability of SPPs considerably improves. Lu et al. [52] conducted the assessment of four SPPs in Xinjiang of China and found that GSMaP preforms better on daily scale than on sub-daily scales. Previous studies clearly showed that the SPP-based precipitation estimates become more uncertain when time scale becomes finer. Investigating the performance of SPPs in retrieving sub-daily precipitation processes is of great importance. Future work will focus on quantifying the capability of SPPs in detecting precipitation events at different intensity levels on sub-daily scales.
In this study, four SPPs were directly analyzed without further bias-correction or merging with other precipitation data sources. Gowan et al. [53] assessed the IMERG near-real-time daily precipitation estimates against 322 ground gauges across four Alaskan regions and found bias-correction could effectively improve satellite precipitation estimates. Manh-Hung et al. [54] indicated that the gauge-corrected SPPs exhibited slightly better over the uncorrected datasets in comparison with rain gauges and demonstrated improved hydrological performance in Vietnam. Future work should also focus on applying bias-correction and merging SPPs with ground and radar precipitation data to further improve the retrieving capability of satellites.

6. Conclusions

SPPs are important precipitation data alternatives for streamflow simulations and forecasting in ungauged basins. Feasibility analysis should be carried out prior to conducting streamflow simulations given that the quality of different SPPs significantly varies in different regions. In this study, the accuracy and hydrological feasibility of four SPPs were evaluated for two assessment periods using a few statistical metrics and a hydrological model in YRSR. The main conclusions are summarized as follows:
The statistical evaluation of 3B42V7 and PERSIANN-CDR in the period of January 1998 to December 2016 shows that 3B42V7 outperforms PRESIANN-CDR on basin scale. Moreover, 3B42V7 obtains a CC value of 0.51 and a BIAS value of 0.4%, whereas those for PRESIANN-CDR are 0.46 and 16.5%.
The statistical assessment of the four SPPs in the period of April 2014 to December 2016 indicates that GSMaP-Gauge demonstrates the highest accuracy with CC of 0.76 and 0.87 and BIAS of −2.4% and −3.4% on grid and basin scales, respectively.
The VIC-model-based daily streamflow simulations using the four SPPs demonstrate that 3B42V7, IMERG-F, and GSMaP-Gauge show a satisfactory hydrological performance in YRSR, whereas PERSIANN-CDR demonstrates inferior hydrological utility, owing to the considerable precipitation overestimation.
These findings reveal that as a substitute for 3B42V7, IMERG-F has an enhanced hydrological utility in YRSR. GSMaP-Gauge obtains excellent precipitation detection capability and hydrological feasibility. PERSIANN-CDR is not recommended for streamflow simulations in the study area.

Author Contributions

Conceptualization, F.Y.; methodology, F.Y.; writing—original draft preparation, C.Z.; funding acquisition, L.R., F.Y., S.J., X.Y., Y.L.; investigation, F.Y., C.Z., and L.Z.; data curation, F.Y., S.J., C.Z., and J.S.; visualization, C.Z. and L.Z.; writing—review and editing, L.R., F.Y., Y.L., C.Z., S.L., T.C., and E.F.-R. All authors have read and agreed to the published version of the manuscript.

Funding

This study was sponsored by the National Key Research and Development Program (under Grant No. 2016YFA0601500 and 2109YFC1510601) approved by the Ministry of Science and Technology of China; the National Natural Science Foundation of China (Grant Nos. 51779070, 51979069, 41807165, 51579066, and 52079036); supported by the Fundamental Research Funds for the Central Universities (Grant Nos. B200204029 and 2017B10214); the Special Fund of State Key Laboratory of Hydrology-Water Resources and Hydraulic Engineering (Grand Grant No. 20145031112); the National Natural Science Foundation of Jiangsu Province, China (Grant No. BK20180512).

Acknowledgments

Our gratitude is extended to the TRMM, PERSINNA-CDR, GPM, and GSMaP research communities for making the satellite rainfall data available for this work. We also extend our appreciation to the reviewers for their thoughtful comments and valuable advice.

Conflicts of Interest

The authors declare no conflict of interest.

References

  1. Huntington, T.G.; Weiskel, P.K.; Wolock, D.M.; McCabe, G.J. A new indicator framework for quantifying the intensity of the terrestrial water cycle. J. Hydrol. 2018, 559, 361–372. [Google Scholar] [CrossRef]
  2. Tong, K.; Su, F.; Yang, D.; Hao, Z. Evaluation of satellite precipitation retrievals and their potential utilities in hydrologic modeling over the Tibetan Plateau. J. Hydrol. 2014, 519, 423–437. [Google Scholar] [CrossRef]
  3. Mroz, K.; Battaglia, A.; Lang, T.J.; Tanelli, S.; Sacco, G.F. Global Precipitation Measuring Dual-Frequency Precipitation Radar Observations of Hailstorm Vertical Structure: Current Capabilities and Drawbacks. J. Appl. Meteorol. Clim. 2018, 57, 2161–2178. [Google Scholar] [CrossRef]
  4. Stauffer, R.; Mayr, G.J.; Messner, J.W.; Umlauf, N.; Zeileis, A. Spatio-temporal precipitation climatology over complex terrain using a censored additive regression model. Int. J. Climatol. 2017, 37, 3264–3275. [Google Scholar] [CrossRef] [PubMed] [Green Version]
  5. Chen, T.; Ren, L.; Yuan, F.; Yang, X.; Jiang, S.; Tang, T.; Liu, Y.; Zhao, C.; Zhang, L. Comparison of Spatial Interpolation Schemes for Rainfall Data and Application in Hydrological Modeling. Water 2017, 9, 342. [Google Scholar] [CrossRef] [Green Version]
  6. Yu, H.; Wang, L.; Yang, R.; Yang, M.; Gao, R. Temporal and spatial variation of precipitation in the Hengduan Mountains region in China and its relationship with elevation and latitude. Atmos. Res. 2018, 213, 1–16. [Google Scholar] [CrossRef]
  7. Olson, W.S.; Kummerow, C.D.; Heymsfield, G.M.; Giglio, L. A method for combined passive-active microwave retrievals of cloud and precipitation profiles. J. Appl. Meteorol. 1996, 35, 1763–1789. [Google Scholar] [CrossRef]
  8. Kummerow, C.; Barnes, W.; Kozu, T.; Shiue, J.; Simpson, J. The Tropical Rainfall Measuring Mission (TRMM) sensor package. J. Atmos. Ocean. Technol. 1998, 15, 809–817. [Google Scholar] [CrossRef]
  9. Ushio, T.; Sasashige, K.; Kubota, T.; Shige, S.; Okamoto, K.; Aonashi, K.; Inoue, T.; Takahashi, N.; Iguchi, T.; Kachi, M.; et al. A Kalman Filter Approach to the Global Satellite Mapping of Precipitation (GSMaP) from Combined Passive Microwave and Infrared Radiometric Data. J. Meteorol. Soc. Jpn. 2009, 87, 137–151. [Google Scholar] [CrossRef] [Green Version]
  10. Ashouri, H.; Phu, N.; Thorstensen, A.; Hsu, K.; Sorooshian, S.; Braithwaite, D. Assessing the Efficacy of High-Resolution Satellite-Based PERSIANN-CDR Precipitation Product in Simulating Streamflow. J. Hydrometeorol. 2016, 17, 2061–2076. [Google Scholar] [CrossRef]
  11. Grecu, M.; Olson, W.S.; Munchak, S.J.; Ringerud, S.; Liao, L.; Haddad, Z.; Kelley, B.L.; McLaughlin, S.F. The GPM Combined Algorithm. J. Atmos. Ocean. Technol. 2016, 33, 2225–2245. [Google Scholar] [CrossRef]
  12. Sapiano, M.R.P.; Arkin, P.A. An Intercomparison and Validation of High-Resolution Satellite Precipitation Estimates with 3-Hourly Gauge Data. J. Hydrometeorol. 2009, 10, 149–166. [Google Scholar] [CrossRef]
  13. Mou, L.T.; Santo, H. Comparison of GPM IMERG, TMPA 3B42 and PERSIANN-CDR satellite precipitation products over Malaysia. Atmos. Res. 2018, 202, 63–76. [Google Scholar]
  14. Tian, Y.; Peters-Lidard, C.D.; Adler, R.F.; Kubota, T.; Ushio, T. Evaluation of GSMaP Precipitation Estimates over the Contiguous United States. J. Hydrometeorol. 2010, 11, 566–574. [Google Scholar] [CrossRef]
  15. Islam, M.A.; Yu, B.; Cartwright, N. Assessment and comparison of five satellite precipitation products in Australia. J. Hydrol. 2020, 590, 125474. [Google Scholar] [CrossRef]
  16. Chua, Z.; Kuleshov, Y.; Watkins, A. Evaluation of Satellite Precipitation Estimates over Australia. Remote Sens. 2020, 12, 678. [Google Scholar] [CrossRef] [Green Version]
  17. Jiang, S.; Zhou, M.; Ren, L.; Cheng, X.; Zhang, P. Evaluation of latest TMPA and CMORPH satellite precipitation products over Yellow River Basin. Water Sci. Eng. 2016, 9, 87–96. [Google Scholar] [CrossRef] [Green Version]
  18. Yang, Y.; Wu, J.; Bai, L.; Wang, B. Reliability of Gridded Precipitation Products in the Yellow River Basin, China. Remote Sens. 2020, 12, 374. [Google Scholar] [CrossRef] [Green Version]
  19. Lu, X.; Tang, G.; Wang, X.; Liu, Y.; Jia, L.; Xie, G.; Li, S.; Zhang, Y. Correcting GPM IMERG precipitation data over the Tianshan Mountains in China. J. Hydrol. 2019, 575, 1239–1252. [Google Scholar] [CrossRef]
  20. Behrangi, A.; Khakbaz, B.; Jaw, T.C.; AghaKouchak, A.; Hsu, K.; Sorooshian, S. Hydrologic evaluation of satellite precipitation products over a mid-size basin. J. Hydrol. 2011, 397, 225–237. [Google Scholar] [CrossRef] [Green Version]
  21. Thom, T.V.; Li, L.; Jun, K.S. Evaluation of Multi-Satellite Precipitation Products for Streamflow Simulations: A Case Study for the Han River Basin in the Korean Peninsula, East Asia. Water 2018, 10, 642. [Google Scholar] [CrossRef] [Green Version]
  22. Kim, J.P.; Jung, I.W.; Park, K.W.; Yoon, S.K.; Lee, D. Hydrological Utility and Uncertainty of Multi-Satellite Precipitation Products in the Mountainous Region of South Korea. Remote Sens. 2016, 8, 608. [Google Scholar] [CrossRef] [Green Version]
  23. Zheng, H.; Zhang, L.; Zhu, R.; Liu, C.; Sato, Y.; Fukushima, Y. Responses of streamflow to climate and land surface change in the headwaters of the Yellow River Basin. Water Resour. Res. 2009, 45. [Google Scholar] [CrossRef]
  24. Meng, J.; Li, L.; Hao, Z.; Wang, J.; Shao, Q. Suitability of TRMM satellite rainfall in driving a distributed hydrological model in the source region of Yellow River. J. Hydrol. 2014, 509, 320–332. [Google Scholar] [CrossRef]
  25. Hao, Z.C.; Tong, K.; Liu, X.L.; Zhang, L.L. Capability of TMPA products to simulate streamflow in upper Yellow and Yangtze River basins on Tibetan Plateau. Water Sci. Eng. 2014, 7, 237–249. [Google Scholar]
  26. Su, J.; Lü, H.; Wang, J.; Sadeghi, A.; Zhu, Y. Evaluating the Applicability of Four Latest Satellite–Gauge Combined Precipitation Estimates for Extreme Precipitation and Streamflow Predictions over the Upper Yellow River Basins in China. Remote Sens. 2017, 9, 1176. [Google Scholar] [CrossRef] [Green Version]
  27. Lu, D.; Yong, B. Evaluation and Hydrological Utility of the Latest GPM IMERG V5 and GSMaP V7 Precipitation Products over the Tibetan Plateau. Remote Sens. 2018, 10, 2022. [Google Scholar] [CrossRef] [Green Version]
  28. Yuan, F.; Wang, B.; Shi, C.; Cui, W.; Zhao, C.; Liu, Y.; Ren, L.; Zhang, L.; Zhu, Y.; Chen, T.; et al. Evaluation of hydrological utility of IMERG Final run V05 and TMPA 3B42V7 satellite precipitation products in the Yellow River source region, China. J. Hydrol. 2018, 567, 696–711. [Google Scholar] [CrossRef]
  29. Bai, P.; Liu, X. Evaluation of Five Satellite-Based Precipitation Products in Two Gauge-Scarce Basins on the Tibetan Plateau. Remote Sens. 2018, 10, 1316. [Google Scholar] [CrossRef] [Green Version]
  30. Yong, B.; Liu, D.; Gourley, J.J.; Tian, Y.; Huffman, G.J.; Ren, L.; Hong, Y. Global view of real-time TRMM multisatellite precipitation analysis: Implications for its successor global precipitation measurement mission. Bull. Am. Meteorol. Soc. 2015, 96, 283–296. [Google Scholar] [CrossRef]
  31. Gao, C.; Liu, L.; Ma, D.; He, K.; Xu, Y. Assessing responses of hydrological processes to climate change over the southeastern Tibetan Plateau based on resampling of future climate scenarios. Sci. Total Environ. 2019, 664, 737–752. [Google Scholar] [CrossRef]
  32. Cuo, L.; Zhang, Y.; Gao, Y.; Hao, Z.; Cairang, L. The impacts of climate change and land cover/use transition on the hydrology in the upper Yellow River Basin, China. J. Hydrol. 2013, 502, 37–52. [Google Scholar] [CrossRef]
  33. Hansen, M.C.; Defries, R.S.; Townshend, J.; Sohlberg, R. Global land cover classification at 1km spatial resolution using a classification tree approach. Int. J. Remote Sens. 2000, 21, 1331–1364. [Google Scholar] [CrossRef]
  34. FAO. Digital Soil Map of the World and Derived Soil Properties. Land and Water Digital Media Series; Food and Agriculture Organization: Rome, Italy, 2003. [Google Scholar]
  35. Hamman, J.J.; Nijssen, B.; Bohn, T.J.; Gergel, D.R.; Mao, Y. The Variable Infiltration Capacity model version 5 (VIC-5): Infrastructure improvements for new applications and reproducibility. Geosci. Model Dev. 2018, 11, 3481–3496. [Google Scholar] [CrossRef] [Green Version]
  36. Todini, E. The ARNO rainfall—Runoff model. J. Hydrol. 1996, 175, 339–382. [Google Scholar] [CrossRef]
  37. Cosby, B.J.; Hornberger, G.M.; Clapp, R.B.; Ginn, T.R. A Statistical Exploration of the Relationships of Soil Moisture Characteristics to the Physical Properties of Soils. Water Resour. Res. 1984, 20, 682–690. [Google Scholar] [CrossRef] [Green Version]
  38. Duan, Q.Y.; Gupta, V.K.; Sorooshian, S. A Shuffled complex evolution approach for effective and efficient global minimization. J. Optimiz. Theory Appl. 1993, 76, 501–521. [Google Scholar] [CrossRef]
  39. Tang, X.; Zhang, J.; Gao, C.; Ruben, G.B.; Wang, G. Assessing the Uncertainties of Four Precipitation Products for Swat Modeling in Mekong River Basin. Remote Sens. 2019, 11, 304. [Google Scholar] [CrossRef] [Green Version]
  40. Gao, C.; Booij, M.J.; Xu, Y. Assessment of extreme flows and uncertainty under climate change: Disentangling the uncertainty contribution of representative concentration pathways, global climate models and internal climate variability. Hydrol. Earth Syst. Sci. 2020, 24, 3251–3269. [Google Scholar] [CrossRef]
  41. Shi, J.; Yuan, F.; Shi, C.; Zhao, C.; Zhang, L.; Ren, L.; Zhu, Y.; Jiang, S.; Liu, Y. Statistical Evaluation of the Latest GPM-Era IMERG and GSMaP Satellite Precipitation Products in the Yellow River Source Region. Water 2020, 12, 1006. [Google Scholar] [CrossRef] [Green Version]
  42. Yoshimoto, S.; Amarnath, G. Applications of Satellite-Based Rainfall Estimates in Flood Inundation Modeling-A Case Study in Mundeni Aru River Basin, Sri Lanka. Remote Sens. 2017, 9, 998. [Google Scholar] [CrossRef] [Green Version]
  43. Ning, S.; Song, F.; Udmale, P.; Jin, J.; Thapa, B.R.; Ishidaira, H. Error Analysis and Evaluation of the Latest GSMap and IMERG Precipitation Products over Eastern China. Adv. Meteorol. 2017. [Google Scholar] [CrossRef] [Green Version]
  44. Ma, Y.; Tang, G.; Long, D.; Yong, B.; Zhong, L.; Wan, W.; Hong, Y. Similarity and Error Intercomparison of the GPM and Its Predecessor-TRMM Multisatellite Precipitation Analysis Using the Best Available Hourly Gauge Network over the Tibetan Plateau. Remote Sens. 2016, 8, 569. [Google Scholar] [CrossRef] [Green Version]
  45. Tang, G.; Ma, Y.; Long, D.; Zhong, L.; Hong, Y. Evaluation of GPM Day-1 IMERG and TMPA Version-7 legacy products over Mainland China at multiple spatiotemporal scales. J. Hydrol. 2016, 533, 152–167. [Google Scholar] [CrossRef]
  46. Tan, J.; Petersen, W.A.; Kirstetter, P.; Tian, Y. Performance of IMERG as a Function of Spatiotemporal Scale. J. Hydrometeorol. 2017, 18, 307–319. [Google Scholar] [CrossRef]
  47. Wang, W.; Lu, H.; Zhao, T.; Jiang, L.; Shi, J. Evaluation and Comparison of Daily Rainfall From Latest GPM and TRMM Products Over the Mekong River Basin. IEEE J. Sel. Top. Appl. Earth Obs. Remote Sens. 2017, 10, 2540–2549. [Google Scholar] [CrossRef]
  48. Kim, K.; Park, J.; Baik, J.; Choi, M. Evaluation of topographical and seasonal feature using GPM IMERG and TRMM 3B42 over Far-East Asia. Atmos. Res. 2017, 187, 95–105. [Google Scholar] [CrossRef]
  49. Dezfuli, A.K.; Ichoku, C.M.; Mohr, K.I.; Huffman, G.J. Precipitation Characteristics in West and East Africa from Satellite and in Situ Observations. J. Hydrometeorol. 2017, 18, 1799–1805. [Google Scholar] [CrossRef]
  50. Wang, Z.; Zhong, R.; Lai, C.; Chen, J. Evaluation of the GPM IMERG satellite-based precipitation products and the hydrological utility. Atmos. Res. 2017, 196, 151–163. [Google Scholar] [CrossRef]
  51. Islam, M.A. Statistical comparison of satellite-retrieved precipitation products with rain gauge observations over Bangladesh. Int. J. Remote Sens. 2018, 39, 2906–2936. [Google Scholar] [CrossRef] [Green Version]
  52. Lu, X.; Tang, G.; Wei, M.; Yang, L.; Zhang, Y. Evaluation of multi-satellite precipitation products in Xinjiang, China. Int. J. Remote Sens. 2018, 39, 7437–7462. [Google Scholar] [CrossRef]
  53. Gowan, T.A.; Horel, J.D. Evaluation of IMERG-E Precipitation Estimates for Fire Weather Applications in Alaska. Weather Forecast. 2020, 35, 1831–1843. [Google Scholar] [CrossRef]
  54. Manh-Hung, L.; Lakshmi, V.; Bolten, J.; Duong, D.B. Adequacy of Satellite-derived Precipitation Estimate for Hydrological Modeling in Vietnam Basins. J. Hydrol. 2020, 586, 124820. [Google Scholar]
Figure 1. Location and topography of Yellow River source region (YRSR) and streamflow and weather stations.
Water 12 03082 g001
Figure 2. Spatial distributions of mean annual precipitation in Period I (January 1998 to December 2016) in Yellow River source region (YRSR): (a) Gauge, (b) 3B42V7, and (c) PERSIANN-CDR.
Water 12 03082 g002
Figure 3. Spatial distribution of annual precipitation in 2016 in YRSR: (a) Gauge, (b) 3B42V7, (c) PERSIANN-CDR, (d) IMERG-F, and (e) GSMaP-Gauge.
Water 12 03082 g003
Figure 4. Comparison of the statistical indices of the four SPP-based daily precipitation data sets in Period II (April 2014–December 2016) at the locations of the 11 weather stations: (a) CC, (b) RMSE, (c) BIAS, (d) POD, (e) FAR, and (f) ETS.
Water 12 03082 g004
Figure 5. Box plots of the statistical indices of the four SPP-derived daily precipitation estimates at the locations of the 11 rain gauges in Period II (April 2014 to December 2016).
Water 12 03082 g005
Figure 6. Comparison of the observed daily hydrograph at the Tangnaihai station with the simulated hydrograph using the gauge-based precipitation in the calibration (January 1998 to December 2011) and validation (January 2012 to December 2016) periods. In the figure, P_Gauge denotes the gauge-based daily precipitation, Q_obs represents the observed daily streamflow, and Q_Gauge is the simulated daily streamflow using the ground precipitation observations.
Water 12 03082 g006
Figure 7. Observed and SPP-based simulated daily hydrographs at the Tangnaihai hydrological station in Period I (January 1998 to December 2016): (a) 3B42V7 and (b) PERSINNA-CDR. P_3B42V7 and P_PERSIANN-CDR denote the daily precipitation estimates from 3B42V7 and PERSIANN-CDR, respectively; Q_obs represents the observed daily streamflow, and Q_3B42V7 and Q_ PERSIANN-CDR refer to the simulated daily streamflow using 3B42V7 and PERSIANN-CDR, respectively.
Water 12 03082 g007
Figure 8. Observed and SPP-based simulated daily hydrographs at the Tangnaihai hydrological station in Period II (April 2014 to December 2016): (a) 3B42V7, (b) PERSIANN-CDR, (c) IMERG-F, and (d) GSMaP-Gauge. In the figure, P_3B42V7, P_PERSIANN-CDR, P_IMERG-F, and P_GSMaP-Gauge denote the daily precipitation estimates from 3B42V7, PERSIANN-CDR, IMERG-F, and GSMaP-Gauge, respectively. Q_obs represents the observed daily streamflow, and Q_3B42V7, Q_PERSIANN-CDR, Q_IMERG-F, and Q_GSMaP-Gauge refer to the simulated daily streamflow using 3B42V7, PERSIANN-CDR, IMERG-F, and GSMaP-Gauge, respectively.
Water 12 03082 g008
Table 1. General information of the four satellite precipitation products (SPPs) used in this study.
SPPsResolutionLatitude CoverageLatencyStudy PeriodWebsites
Tropical Rainfall Measurement Mission (TRMM) Multisatellite Precipitation Analysis (TMPA) 3B42 version 7 (3B42V7)0.25°/3 h50° S–50° NOne month1998.01–2016.12https://gpm.nasa.gov/data-access/downloads/trmm
Precipitation Estimation from Remotely Sensed Information using Artificial Neural Networks Climate Data Record (PERSIANN-CDR)0.25°/1 d60° S–60° NApproximately six months1998.01–2016.12https://www.ncdc.noaa.gov/cdr/atmospheric/precipitation-persiann-cdr
Integrated Multisatellite Retrievals for Global Precipitation Measurement final run (IMERG-F) 0.1°/0.5 h60° S–60° NTwo months2014.04–2016.12https://gpm.nasa.gov/data-access/downloads/gpm
gauge-corrected Global Satellite Mapping of Precipitation (GSMaP-Gauge)0.1°/1 h60° S–60° NThree days2014.04–2016.12https://sharaku.eorc.jaxa.jp/GSMaP
Table 2. Statistical metrics adopted in this study for statistical and hydrological evaluations of SPPs.
Statistic IndexFormulaUnitPerfect Value
Correlation coefficient (CC) C C = i = 1 n ( P i o P ¯ o ) ( P i s P ¯ s ) i = 1 n ( P i o P ¯ o ) 2 i = 1 n ( P i s P ¯ s ) 2 -1
Root mean squared error (RMSE) R M S E = i = 1 n ( P i s P i o ) 2 n mm/d0
Relative bias (BIAS) B I A S = i = 1 n ( P i s P i o ) i = 1 n P i o × 100 % %0
Probability of detection (POD) P O D = N a N a + N c -1
False alarm ratio (FAR) F A R = N b N a + N b -0
Equitable threat score (ETS) E T S = N a N r N a + N c + N c N r
N r = ( N a + N c ) ( N a + N b ) N a + N c + N c + N d
-1
Nash–Sutcliffe model efficiency coefficient (NSE) N S E = 1 i = 1 n [ Q i s Q i o ] 2 i = 1 n [ Q i o Q o ¯ ] 2 -1
Notes: n is the sample size; P i s and P i o are the evaluated data and the reference data, respectively; P ¯ o and P ¯ s are the mean value of P i o and P i s , respectively; N a is the hit number, referring to the number of days when SPP- and gauge-based precipitation data are higher than a predefined precipitation threshold (1 mm/d in this study); N b is the number of days when the SPP-based precipitation estimate is higher than 1 mm/d and the gauge-based precipitation is lower than 1 mm/d; N c is the number of days when the SPP-based precipitation estimate is less than 1 mm/d and the gauge precipitation is higher than 1 mm/d; N d denotes the number of days when SPP- and gauge-based precipitation values are less than 1 mm/d; N r is the intermediate variable for ETS calculation; Q i s and Q i o are the simulated and observed discharge, respectively; Q o ¯ represents the average value of Q i o .
Table 3. Statistical indices of 3B42V7 and PERSIANN-CDR in Period I (January 1998−December 2016).
Spatial ScaleSPPsCCRMSE (mm/d)BIAS
(%)
PODFARETS
Grid scale 3B42V70.384.13.70.540.400.27
PERSIANN-CDR0.243.6−1.50.50.550.16
Basin scale 3B42V70.512.40.40.710.270.4
PERSIANN-CDR0.462.816.50.660.380.28
Table 4. Statistical indices of the four SPPs in Period II (April 2014 to December 2016).
Spatial ScaleSPPsCCRMSE (mm/d)BIAS (%)PODFARETS
Grid scale 3B42V70.304.0−3.10.430.460.18
PERSIANN-CDR0.413.6−2.30.630.440.26
IMERG-F0.335.610.80.440.360.23
GSMaP-Gauge0.763.4−2.40.830.280.51
Basin scale 3B42V70.402.5−2.40.620.400.25
PERSIANN-CDR0.582.813.80.630.370.28
IMERG-F0.472.4−3.90.660.370.30
GSMaP-Gauge0.872.4−3.40.850.200.58
Table 5. Performance of the rain-gauge- and SPP-based model runs in simulating historical high, normal, and low flows at the Tangnaihai streamflow station in Period II.
Precipitation InputsHigh FlowNormal FlowLow Flow
CCBIAS (%)CCBIAS (%)CCBIAS (%)
Rain gauge0.815.30.8941.90.2345.2
3B42V70.5217.10.81450.1859.6
PERSIANN-CDR0.5333.40.8291.20.26126.1
IMERG-F0.470.30.865.50.54−9.9
GSMaP-Gauge0.75−8.70.844.90.54−8.9
Publisher’s Note: MDPI stays neutral with regard to jurisdictional claims in published maps and institutional affiliations.

