Article

Comprehensive Understanding of Groundwater Geochemistry and Suitability for Sustainable Drinking Purposes in Confined Aquifers of the Wuyi Region, Central North China Plain

1
Institute of Hydrogeology and Environmental Geology, Chinese Academy of Geological Science, Shijiazhuang 050061, China
2
Faculty of Geosciences and Environmental Engineering, Southwest Jiaotong University, Chengdu 611756, China
3
School of Water Resources and Environment, Hebei GEO University, Shijiazhuang 050031, China
*
Author to whom correspondence should be addressed.
Water 2020, 12(11), 3052; https://doi.org/10.3390/w12113052
Submission received: 12 October 2020 / Revised: 28 October 2020 / Accepted: 28 October 2020 / Published: 30 October 2020
(This article belongs to the Section Water Quality and Contamination)

Abstract

:
Confined groundwater is important for the domestic water supply in arid and semiarid regions that have salty phreatic water. A systematic investigation was conducted in the Wuyi region, a typical central area of the North China Plain (NCP), regarding the confined groundwater geochemistry. A total of 59 samples were collected from confined aquifers across the region for in situ parameter determination and laboratory analysis. The results showed the confined groundwater was neutral to slightly alkaline, and dominantly soft fresh. The moderately hard brackish water and very hard brackish water accounted for 1.69% and 6.78% of the total samples, respectively. The hydro-chemical faces are mainly SO4·Cl–Na type with a few of the HCO3–Na type. The entropy-weighted water quality index assessment demonstrated that 21.3% of the groundwater samples came under the medium to extremely poor quality, and were unsuitable for drinking purposes due to the high content of major ions. Various populations are at a chronic health risk at some local sites by high levels of F- and Fe in groundwater, with susceptibility in the order of adult females < adult males < children < infants. The poor groundwater quality and health threats result from the natural water–rock interactions (including mineral dissolution and cation exchange) rather than anthropogenic inputs. This research can provide references for groundwater resource development and management in the NCP and other similar regions worldwide.

1. Introduction

Groundwater serves as the dominant or even only source of water for potable usage in many regions all over the world, especially in semiarid and arid regions, due to the scarcity of precipitation and surface water [1,2]. The availability of groundwater has been recognized to have profound impacts on approximately one third of the world’s population [3,4,5,6]. As a consequence of global environmental change and rapid population growth, the dependence on groundwater is expected to increase in the near future [7,8]. The element enrichments in groundwater result from human society, and natural circumstances have depleted groundwater quality, which greatly hampers the availability of groundwater for domestic usage [9]. Thus, it is urgent to conduct a comprehensive study on groundwater chemistry and exploitation to ensure the quality and safety of groundwater for anthropogenic usage [10,11].
The North China Plain (NCP) is one of the most typical regions where groundwater plays a significant role in domestic usage, and in industrial and agricultural practices [6,12,13]. Groundwater of the NCP provides approximately 70% of the supplying water resource for various purposes [14,15]. There is no doubt that groundwater has greatly supported the regional developments in the past decades [16], and will continue to play an essential role in human society in the foreseeable future. Meanwhile, the groundwater system has experienced unprecedented changes (for example, tremendous decline of groundwater level and significant change of groundwater chemistry) with the intense intervention of human society [12,17]. Attention from not only China but also the international community has been focused on the availability and sustainability of the groundwater resource in the NCP [6,13,18,19,20], because it is one of the most extensively altered regions of groundwater depletion by human activities in the world [16,21]. The research and management practices of the groundwater resource in the NCP can provide significant experiences and references to other regions worldwide that greatly rely upon groundwater resources in their developments.
Much research has been carried out to reveal the behaviors of the groundwater system under both natural and anthropogenic driving in the NCP [22,23,24,25,26]. For example, Matsumoto et al. [27] introduced radio-krypton in groundwater dating of basin scale aquifers of the NCP, and firstly reported that the age of groundwater can reach 0.5–1 million years in the NCP aquifers. Zhan et al. [28] emphasized the evolution of groundwater major components between 1975 and 2005, and demonstrated the major components of groundwater in the NCP increased since the 1970s. Su et al. [22] used the tool of isotope tracers to reveal the responses of the aquifer system in the NCP to intensive exploitation, and indicated the fraction of the “old” water of pumping groundwater becoming larger and larger over time and the whole aquifer system being depleted. These studies greatly promoted the understanding of regional groundwater flow pattern [27], hydro-chemical characteristics, and sustainability [22,29,30,31,32,33].
For groundwater quality, previous research mainly focused on the origin and formation of some specific chemical elements, like fluoride, iodine, arsenic, etc., at both local and regional scales [30,34,35,36], and overall hydro-chemical features and suitability of groundwater at the local scale, especially in the shallow aquifers of the upper stream areas [6,31,32,37,38,39,40]. For instance, Li et al. [9], Zhang et al. [34], Liu et al. [35], and Yin et al. [41] emphasized the occurrence and origin of specific contaminants, such as iodine, fluoride, and nitrate, of groundwater in the NCP aquifers. Li et al. [6] focused on the heavy metals in groundwater and assessed their potential health risk along two typical transects, from the piedmont to coastal areas of the NCP. Lu et al. [42] and Li et al. [31] investigated the quality and pollution characteristics of groundwater in the piedmont alluvial plain of the NCP. Zhou et al. [39] and Zhou et al. [43] stated the local scale hydro-chemical characteristics and evaluated the overall water quality and suitability of shallow groundwater in upper and lower reaches at the local scale for various purposes. Totally speaking, although the understanding of groundwater chemistry in the NCP has been greatly gained, few studies focused on the hydrogeochemical quality and formation mechanisms of confined groundwater in middle-lower stream areas. Confined groundwater is important because shallow groundwater is salty and not suitable for domestic usage in this area [21,44]. Thus, more attention should be paid to the confined groundwater regarding its hydro-chemical features, quality, and potential health risks, and to the mechanism that oversees the origin of poor water quality.
The present study was conducted to further promote the comprehensive understanding of the overall hydro-chemical status of confined groundwater in middle-lower stream areas of the NCP, where phreatic water is unsuitable for human usage. The specific aims are to: (1) illustrate the geochemical signatures and distribution of groundwater; (2) determine the overall water quality for potable usage and the potential human health risk; (3) distinguish the hydro-chemical elements resulting in poor water quality and health threats; and (4) reveal the sources of these actors and governing mechanisms. This research can provide a better understanding of the hydrogeochemical characteristics and water quality in confined aquifers of the middle-lower reaches of large sedimentary plains like the NCP, and benefit the water resource management not only in the NCP but also in other similar regions worldwide.

2. Materials and Methods
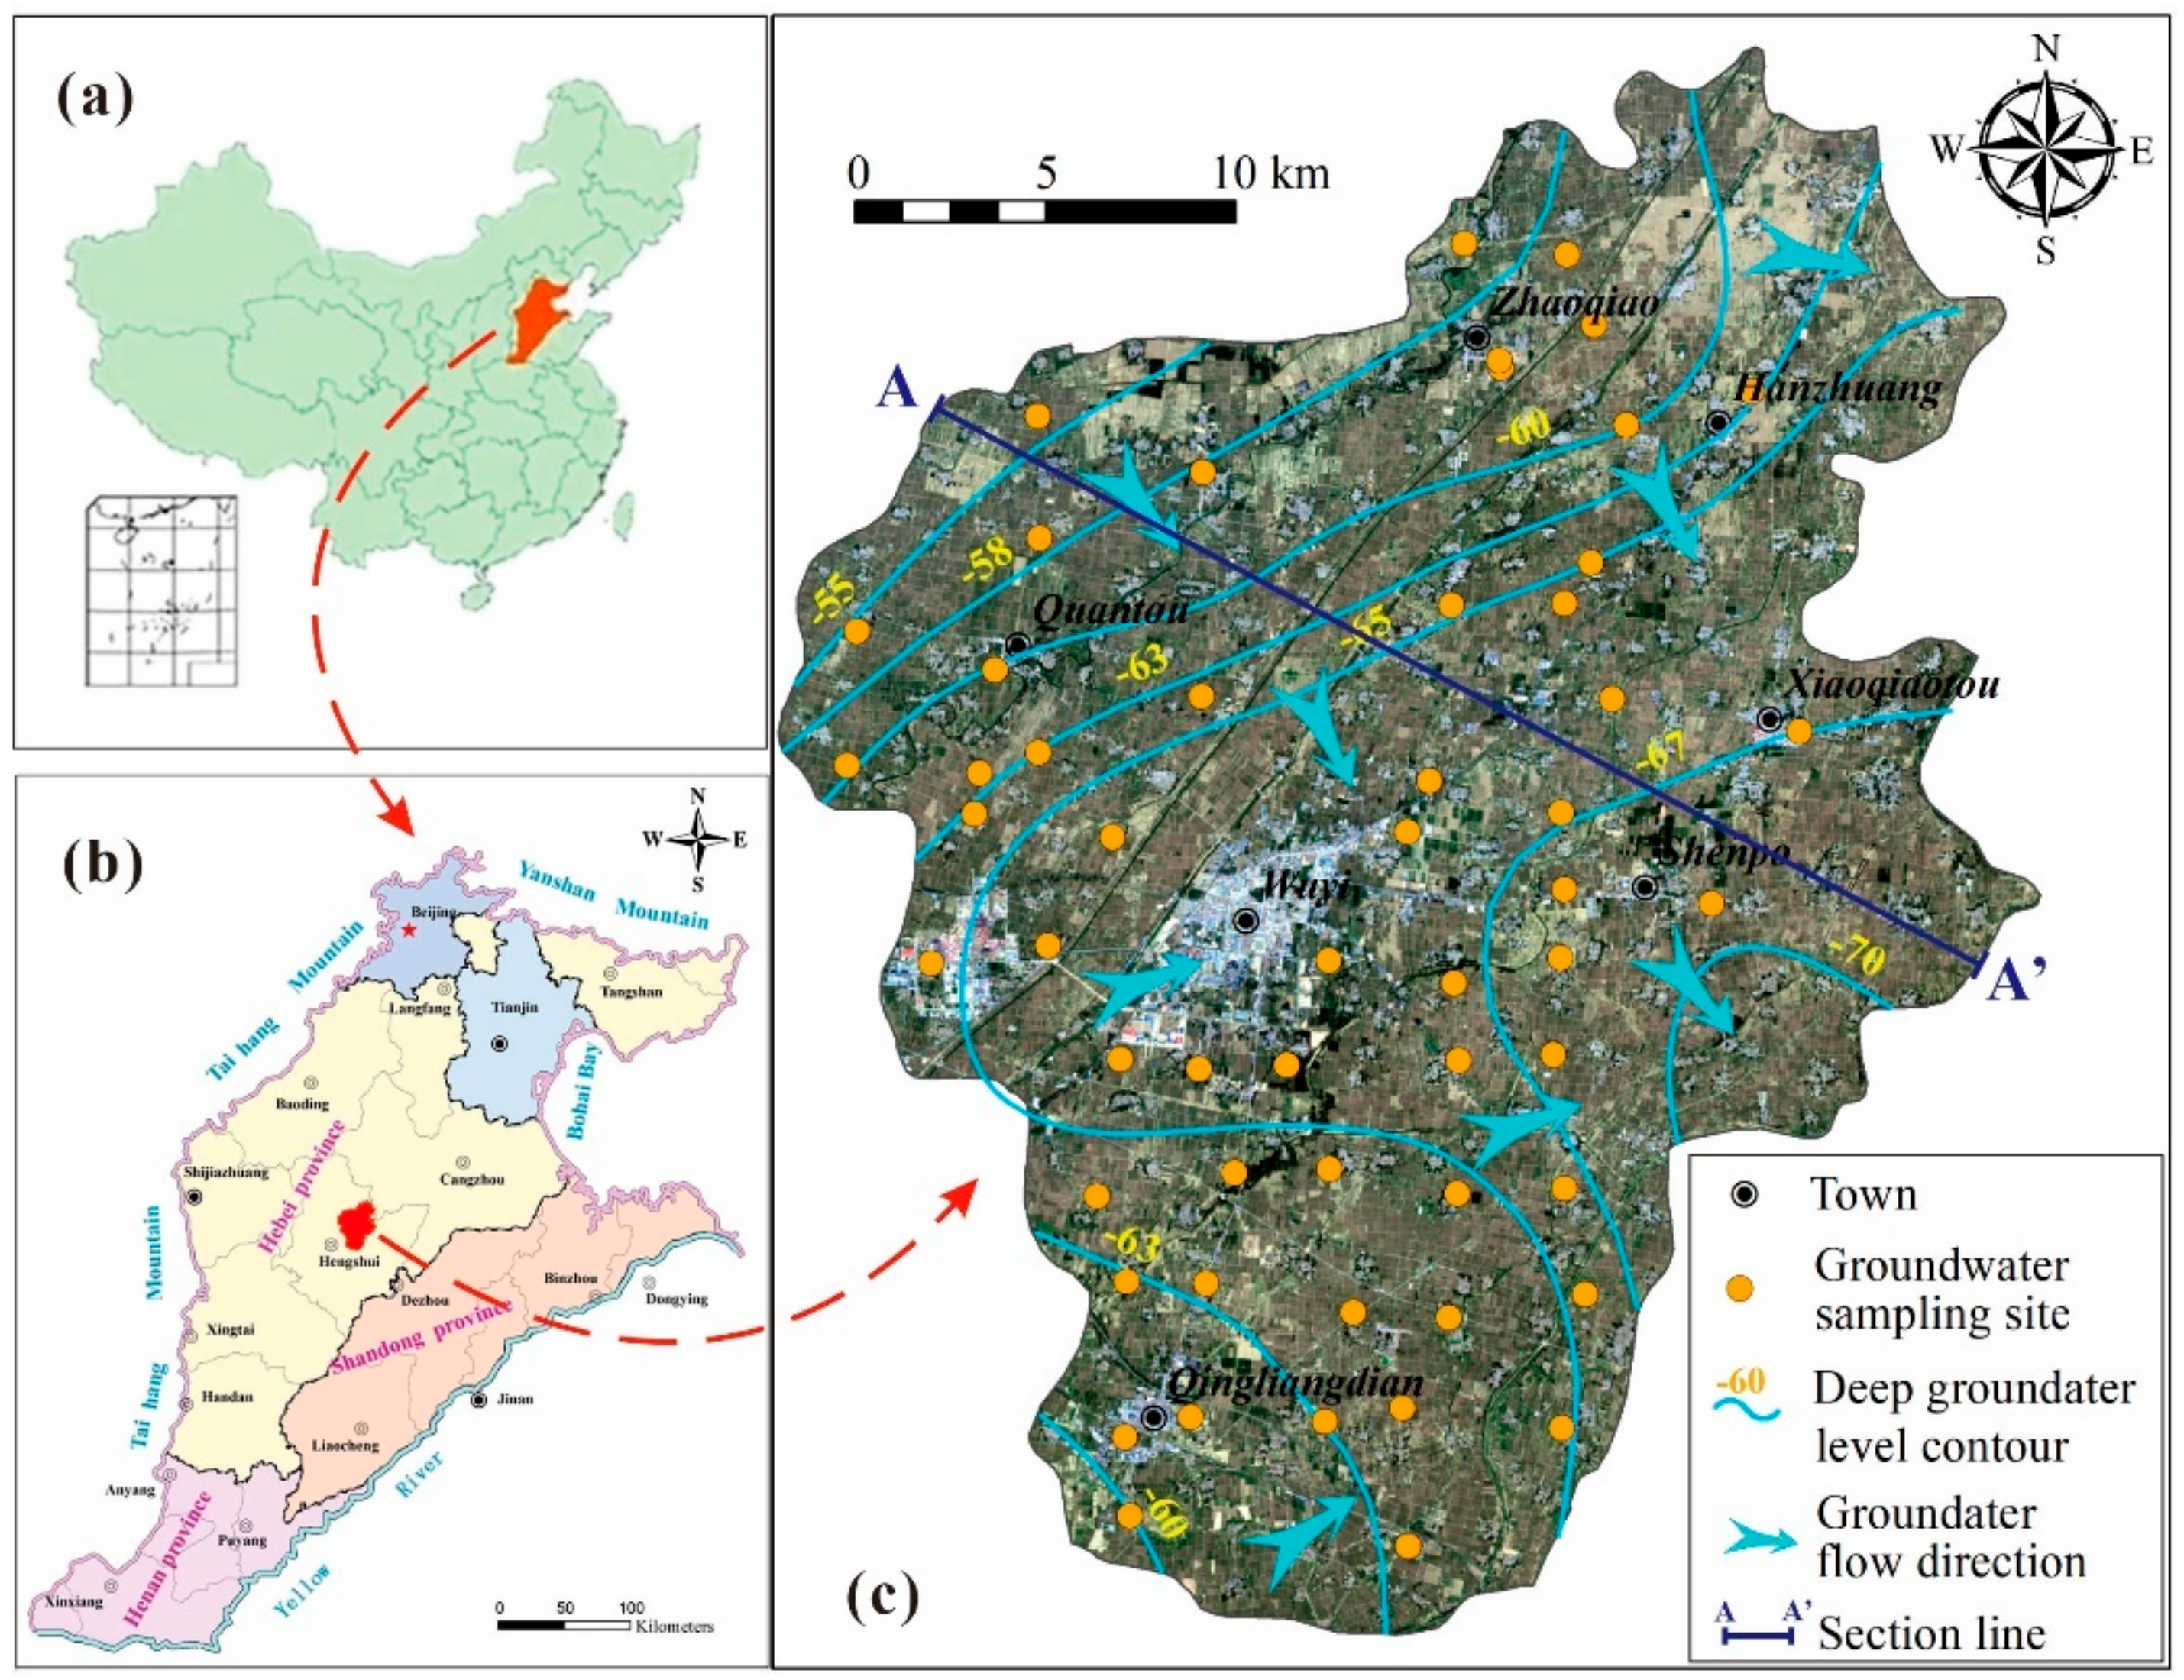
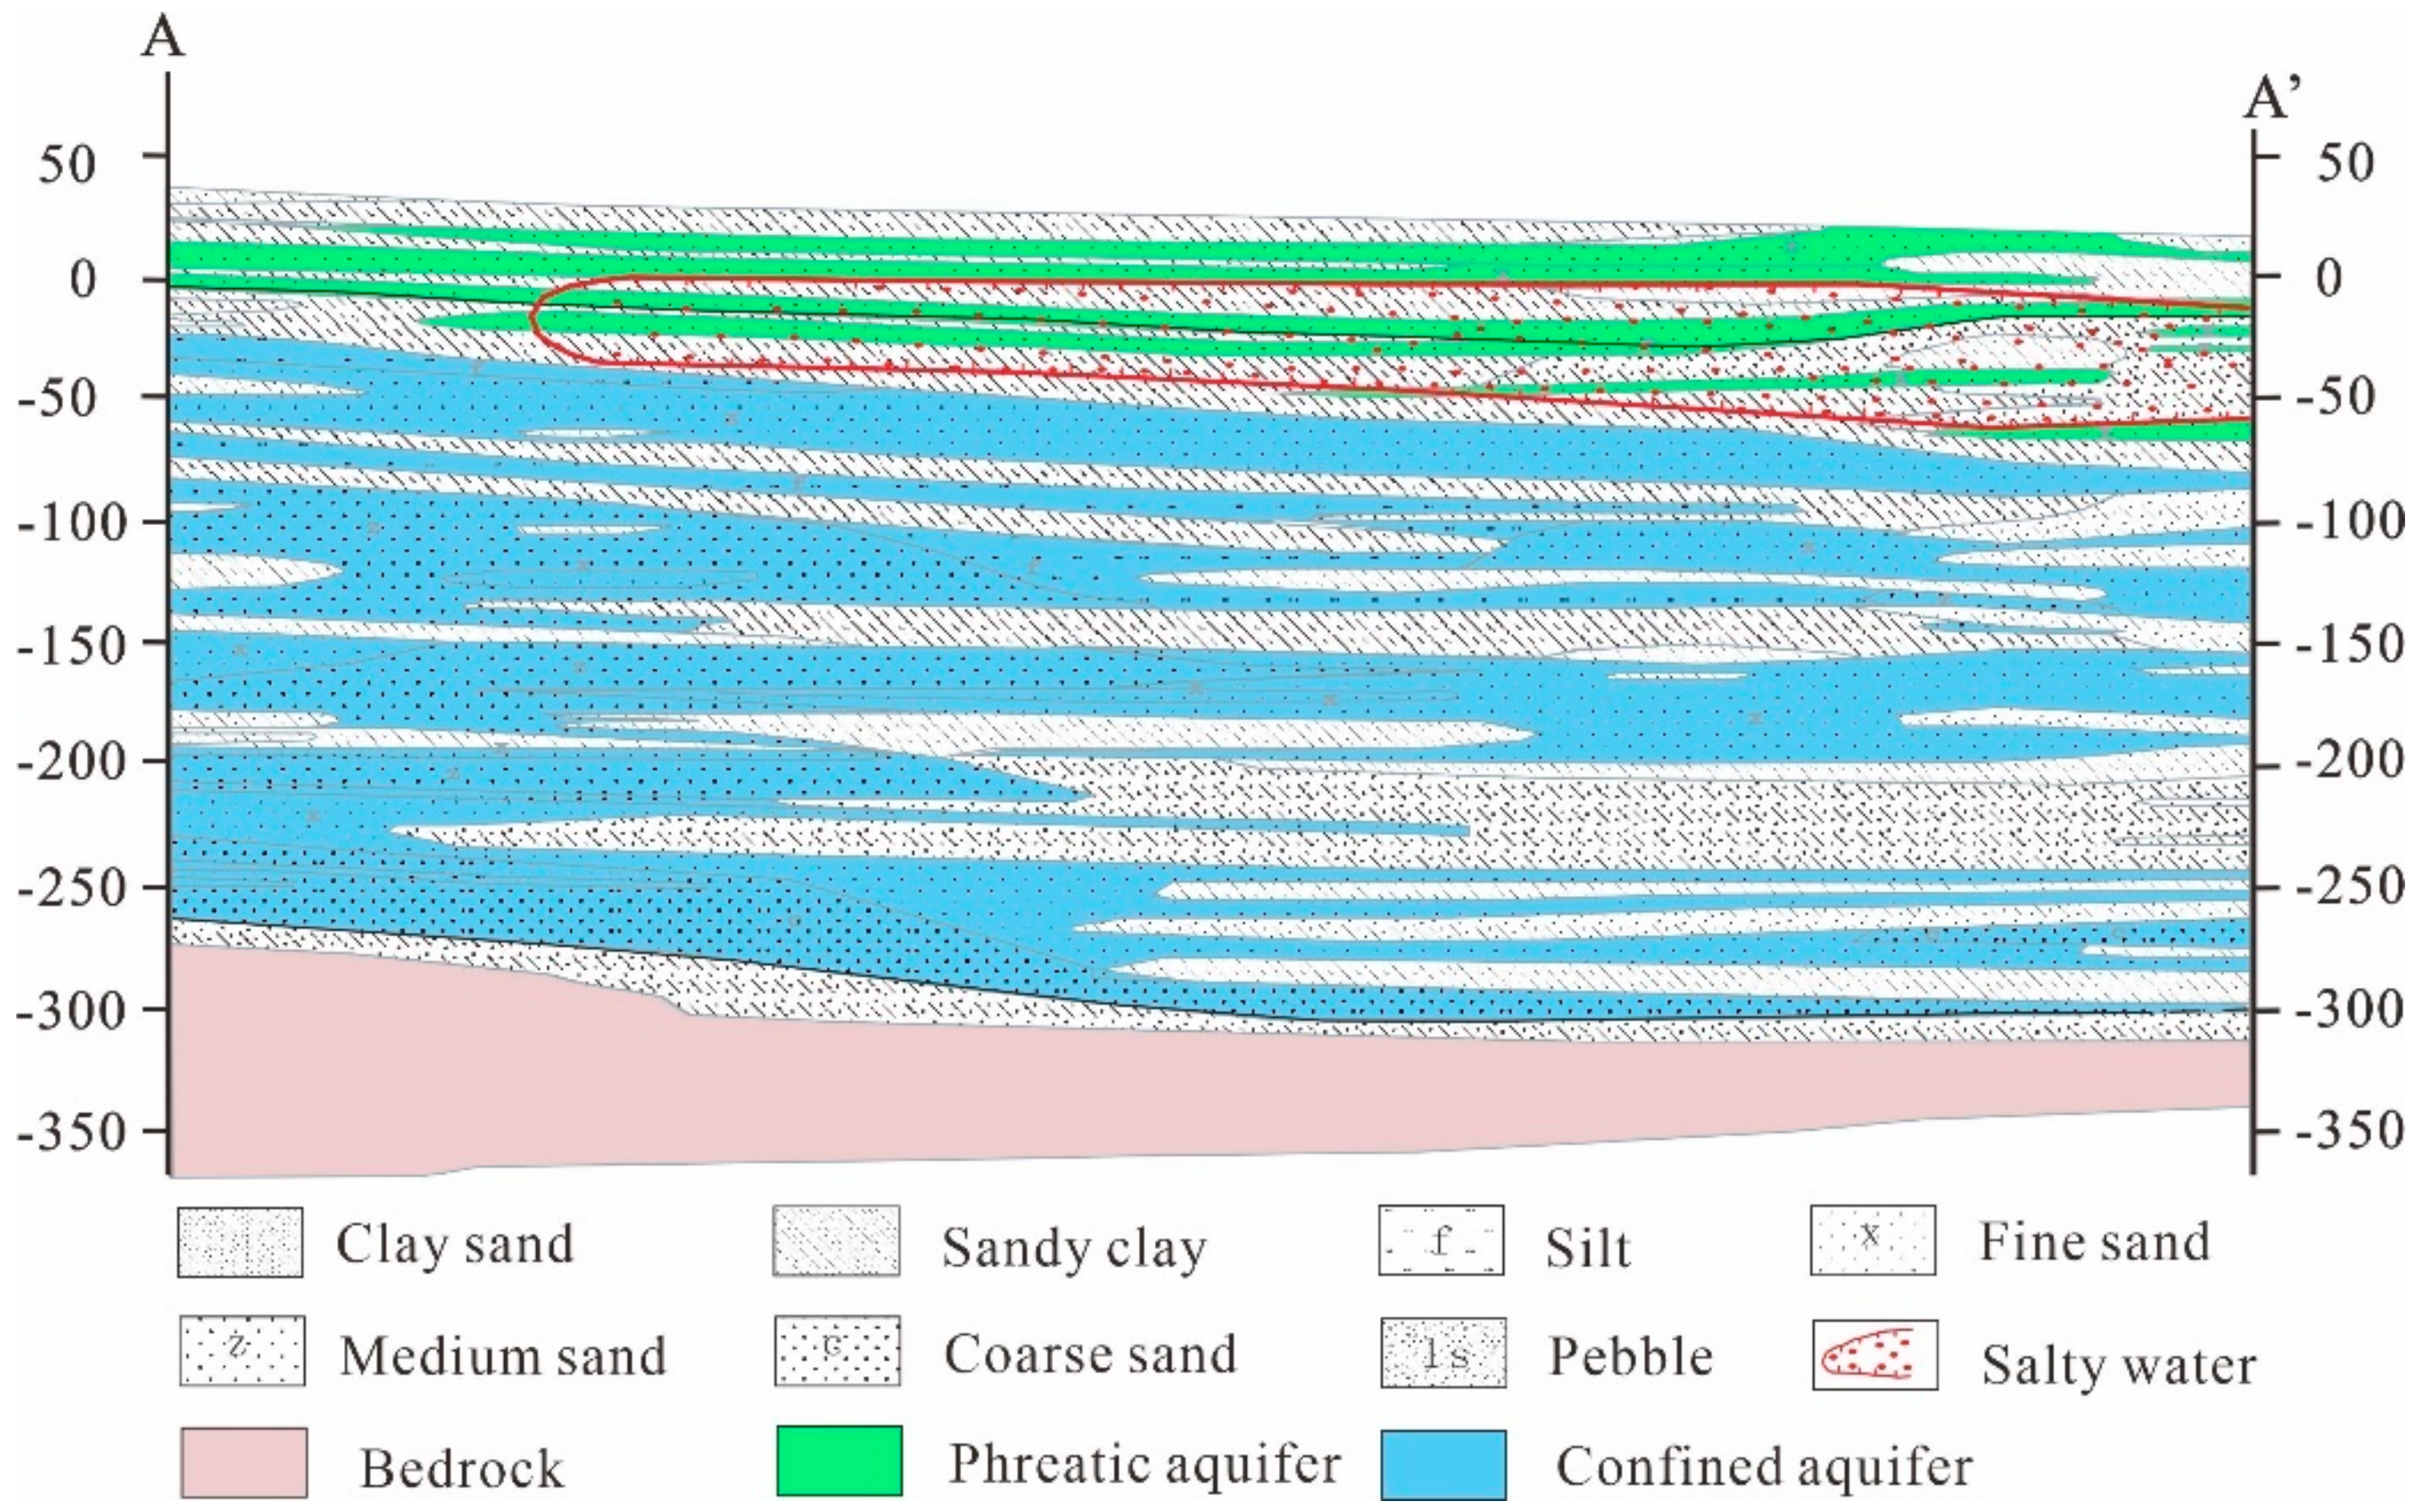
2.1. Study Area

The study area, Wuyi County, lies in the central area of the NCP (Figure 1), with the latitude extending from 37°37′48″N to 38°0′25″N and the longitude ranging between 115°44′52″E and 116°7′34.23″E. This region covers an area of approximately 822 km2. It is characterized by a continental semi-arid monsoon climate. The average annual precipitation is about 520 mm, with ~75% of precipitation occurring during the raining season between June and September [9]. The annual evaporation is in the range of 1000–2000 mm [45], which is approximately 2–4 times the mean annual rainfall.
The Wuyi region is relatively flat, with the terrain slightly declining from the southwest to northeast. The elevation of this region is in the range of 15–23 m above sea level (ASL). This region belongs to the alluvial lacustrine plain of the NCP, which is a large sedimentary basin formed during the Cenozoic and Mesozoic era. The Quaternary strata are widely distributed in the study area, with the thickness varying from 300 to 500 m. Quaternary deposits construct an alternating lithological structure, with the lithology varying from pebble to clay and silt (Figure 2). These thick sediments provide a large space for forming Quaternary groundwater systems. The first thick and continual clay layer is found in the depth of 50–70 m. Generally, aquifers above this layer are regarded as phreatic aquifers, and below this layer are defined as confined aquifers. Phreatic aquifers dominantly receive water from lateral and vertical flow, as well as the infiltration of precipitation, irrigation water, and surface water (rivers and lakes), while confined aquifers are only recharged by lateral and vertical flow. Groundwater leaves phreatic aquifers in the forms of evaporation and lateral and vertical flow. Confined groundwater discharges mainly through lateral flow and exploitation. Regionally, groundwater in both phreatic and confined aquifers flows from the northwest to east (Figure 1c) [35]. There is a large area of salty groundwater distributing in the upper parts of Quaternary system and mainly in the phreatic aquifers (Figure 2) [21,44]. The concentration of total dissolved solids (TDSs) of these salty waters is greater than 2 g/L and not suitable for daily usage. Thus, the confined groundwater, which is relatively fresh, is the most available potential water resource for various purposes.

2.2. Sample Collection and Analysis

In the present work, a total of 59 groundwater samples were collected from boreholes of confined aquifers across the study area during the raining season of 2018. The sampling locations were determined with the aid of a potable GPS device and presented in Figure 1c. All boreholes had been pumped for three borehole volumes to remove the stagnant water. Parameters like water temperature (T), electrical conductivity (EC), and pH were monitored in situ, and groundwater was only collected after these parameters were stable. Groundwater was filtered using 0.45 µm filter membranes before sampled in 2.5 L high-density polyethylene bottles, which were pre-washed thoroughly using the target sampling water. All samples were stored and transported in a low temperature (4 °C) environment with the aid of portable incubators, and sent to laboratory for analysis within 48 h.
In situ parameters like T, EC, and pH were measured at the field using a portable multi-parameter instrument (Multi 350i/SET, Munich, Germany). Hydro-chemical analysis was performed at the Laboratory of Groundwater Sciences and Engineering in the Institute of Hydrogeology and Environmental Geology, Chinese Academy of Geological Sciences (Shijiazhuang, Hebei Province, China). TDS was determined using the gravimetric method. HCO3 was determined using acid-base titration. Other major cations (SO42− and Cl), NO3−, NO2−, and F- were analyzed with the aid of ion chromatography (Shimadzu LC-10ADvp, Japan). NH4+, major cations (K+, Na+, Ca2+, Mg2+), and trace elements (Zn, Mn, Fe, As) were measured using inductively coupled plasma mass spectrometry (Agilent 7500ce ICP-MS, Tokyo, Japan). Ionic charge balance was checked for all samples to ensure the accuracy of hydro-chemical analysis in laboratory. All groundwater samples were observed with the ionic balance error percentage within the acceptable limit of ± 5%, suggesting reasonably good accuracy of laboratory analysis.

2.3. Entropy-Weighted Water Quality Index

The water quality index (WQI) is an effective approach to integrate large numbers of hydro-chemical components into a single score, which can reflect the overall water quality. Accurate results rely on the reasonable weights of each parameter in the WQI assessment. In the traditional WQI method, weights are subjectively assigned based on the experience of experts or practical conditions [46]. The entropy-weighted water quality index (EWQI) is one of the improved WQIs. It determines the weights of hydro-chemical parameters according to the information entropy of provided data. The EWQI approach can avoid the potential errors of subjectivity in the weight assignment of conventional WQI [47,48].
Five steps should be followed in the procedure of EWQI assessment. Prior of the procedure, hydro-chemical indices involved in EWQI assessment should be selected based on the understanding of overall water chemistry of the target water and standardized with the aid of the following equation:
y i j = x i j ( x i j ) min ( x i j ) max ( x i j ) min
where xij is the value of the jth hydro-chemical index of sample I, and (xij)max and (xij)min signify the maximum and minimum values of the selected hydro-chemical indices of all samples, respectively.
The first step is to construct the eigenvalue matrix “Y” of all water samples and selected hydro-chemical indices. The matrix “Y” can be obtained using the following equation:
Y = y 11 y 12 y 1 n y 21 y 22 y 2 n y m 1 y m 2 y m n
where m represents the water samples number and n signifies the hydro-chemical indices number of each sample.
The second step is to determine the entropy weight “wj” of each hydro-chemical index following the procedure below:
w j = 1 e j i = 1 n ( 1 e j )
where ej is the information entropy, which can be calculated by Equation (4) below:
e j = 1 ln m i = 1 m ( P i j × ln P i j )
where Pij signifies the index value ratio of the jth index of sample i, and can be obtained with the aid of the following Equation:
P i j = y i j i m y i j
The third step is to compute the quality rating scale “qj” of each hydro-chemical index by the following equation:
q j = C j S j × 100
where Cj is the value of the jth hydro-chemical index, and Sj represents the permissible limit of the standard for drinking purposes from the World Health Organization or Chinese General Administration of Quality Supervision for hydro-chemical index j.
The fourth step is to calculate the EWQI value with the aid of Equation (7) below:
E W Q I = j = 1 m ( w j × q j )
The last step is to determine the water quality classification according to the EWQI criteria presented in Table 1.
Water with EWQI < 50 is regarded as excellent quality, EWQI in the range of 50–100 as good quality, EWQI between 100–150 as medium quality, EWQI from 150 to 200 as poor quality, and EWQI > 200 as extremely poor quality.

2.4. Human Health Risks Assessment

Human health risks assessment is a quantitative methodology proposed by the US Environmental Protection Agency (USEPA) to reveal the potential health threats by contaminants in water [49]. Previous research noted that populations with different age and gender have different sensitivity to contaminants in water [50]. The main exposure pathways of humans to contaminants in water mainly include oral ingestion, dermal contact, and inhalation. Generally, the risk of contaminants in water through oral and inhalation pathways is negligible [51]. Thus, non-carcinogenic risk via oral ingestion for various populations (infant, children, adult females, and males) should be assessed.
The chronic daily intake (CDI) dose of contaminants in drinking water can be computed by Equation (8), suggested by USEPA [52]:
CDIi = (Ci × IR × EF × ED) / (BW × AT)
where Ci is the concentration of the ith contaminant in water, and IR refers to the rate of water oral ingestion. EF and ED indicate exposure frequency and duration, respectively. BW represents the average body weight. AT signifies the average exposure time, which can be calculated using Equation (9) as follows:
AT = ED × 365
The hazard quotient (HQi) denotes the potential non-carcinogenic risk from contaminant i. It can be obtained using the following equation:
HQi = CDIi/RfDi
where RfDi expresses the reference dose of contaminant i via an oral ingestion pathway.
The hazard index (HI) is defined as the overall potential non-carcinogenic risk from multiple contaminants and expressed as the following equation:
HI = HQ1 + HQ2 + … + HQi
Parameters involved in the non-carcinogenic risk assessment in this study are demonstrated in Table 2.

3. Results and Discussion

3.1. General Hydrogeochemistry

The statistics of groundwater chemical parameters are presented in Table 3. Groundwater in the confined aquifers of the study area had water temperature varying from 11.30 to 28.30, with an average of 21.27. The value of the pH ranged from 6.9 to 9.5, with an average of 8.3, indicating a nearly neutral to slightly alkaline nature. Most of the sampled groundwater was within the pH limits of 6.5–8.5, and 33.90% of groundwater samples were found slightly beyond the permissible limit of 8.5. Groundwater had a wide range of EC values, which varied from 718 μS/cm to 3750 μS/cm, averaging at 1274 μS/cm. The value of the TDS varied from 522 mg/L to 2796 mg/L, with an average of 786 mg/L. The standard deviation was 590 μS/cm for the EC and 450 mg/L for the TDS. Groundwater in the confined aquifers was predominantly fresh, with the TDS within the permissible limit of 1,000 mg/L, and about 10.17% of the sampled groundwater was brackish water, with the TDS in the range of 1000–10,000 mg/L. The value of total hardness (TH) was observed in a wide range, from 22.52 mg/L to 880.20 mg/L, with an average of 120.04 mg/L. More than 96% of groundwater samples were found with TH values within the guideline of 450 mg/L. Groundwater samples were demonstrated in the integrated water quality diagram composed by TDS and TH (Figure 3). It can be seen that groundwater in the confined aquifers of the study area was predominantly soft-fresh water. One groundwater sample (1.69%) belonged to the moderately hard brackish category, and four samples (6.78%) were classified in the very hard brackish category.
Na+ was found to be the dominate cation in the confined groundwater. The concentration of Na+ varied from 173.40 mg/L to 598.90 mg/L, with an average of 242.03 mg/L, and more than 72% of sampled groundwater was found with the Na+ exceeding the guideline of 200 mg/L. Ca2+ and Mg2+ were the secondary cations of the groundwater, with the concentration in the range of 4.00–159.00 mg/L and 2.44–142.00 mg/L, respectively, with an average of 21.89 mg/L and 15.87 mg/L. Almost all sampled groundwater was within the guideline of Ca2+ and Mg2+. The K+ was found in a relatively low concentration when compared with other major cations, and ranged from 0.06 mg/L to 66.48 mg/L, with an average of 1.89 mg/L. There was no dominant anion in the confined groundwater. The major anions, i.e., SO42−, HCO3, and Cl, have similar contents based on the mean value (197.91 mg/L for SO42−, 196.09 mg/L for HCO3, and 185.34 mg/L for Cl) (Table 3). The SO42− and Cl had a relatively wide range of 98.70–928.70 mg/L and 97.13–746.50 mg/L, respectively, with a standard deviation of 153.68 mg/L and 142.10 mg/L. While HCO3 had a relatively narrow range of 106.40–458.90 mg/L, with a standard deviation of 71.05 mg/L. Overall, groundwater was dominantly an SO4·ClNa type with a few of the HCO3−Na type (Figure 4).
Other major contaminants, like nitrogen, fluoride, iodine, arsenic, and toxic metals, were determined. Groundwater was observed with the NO3, NO2, and NH4+ in the range of 0.10–5.43 mg/L, 0.001–0.036 mg/L, and 0.02–2.50 mg/L, respectively, averaging at 1.44 mg/L, 0.002 mg/L, and 0.07 mg/L. All groundwater had an NO3 concentration far less than the permissible limit of 50.0 mg/L. The majority of the sampled groundwater had NO2 and NH4+ concentrations within the Chinese guideline, and only one groundwater sample (1.69%) was found beyond the permissible limit of NO2 (0.02 mg/L), and one sample (1.69%) had an NH4+ concentration exceeding the guideline of 0.2 mg/L. The F- in groundwater varied from 0.57 mg/L to 2.59 mg/L, with an average of 1.29 mg/L. Fluoride is a wide distribution contaminant in groundwater, and 77.97% of the sampled groundwater was found with F- exceeding the permissible limit of 1.0 mg/L. The concentration of As in groundwater ranged from 0.0005 mg/L to 0.0070 mg/L, and averaged at 0.0012 mg/L. All groundwater had an As concentration within the permissible limit of 0.01 mg/L [55]. For the toxic metals, the concentrations were in the range of 0.001–0.470 mg/L for Zn, 0.0005–0.6090 mg/L for Mn, and 0.00–11.80 mg/L for Fe, averaging at 0.032 mg/L, 0.0537 mg/L, and 1.04 mg/L, respectively. All groundwater had a Zn concentration within the Chinese Guideline of 1.0 mg/L. Groundwater with an Mn and Fe concentration exceeding the permissible limit of 0.1 mg/L and 0.3 mg/L accounted 10.17% and 45.76% of the whole sampled groundwater.

3.2. Assessment of Groundwater Quality for Drinking Purposes

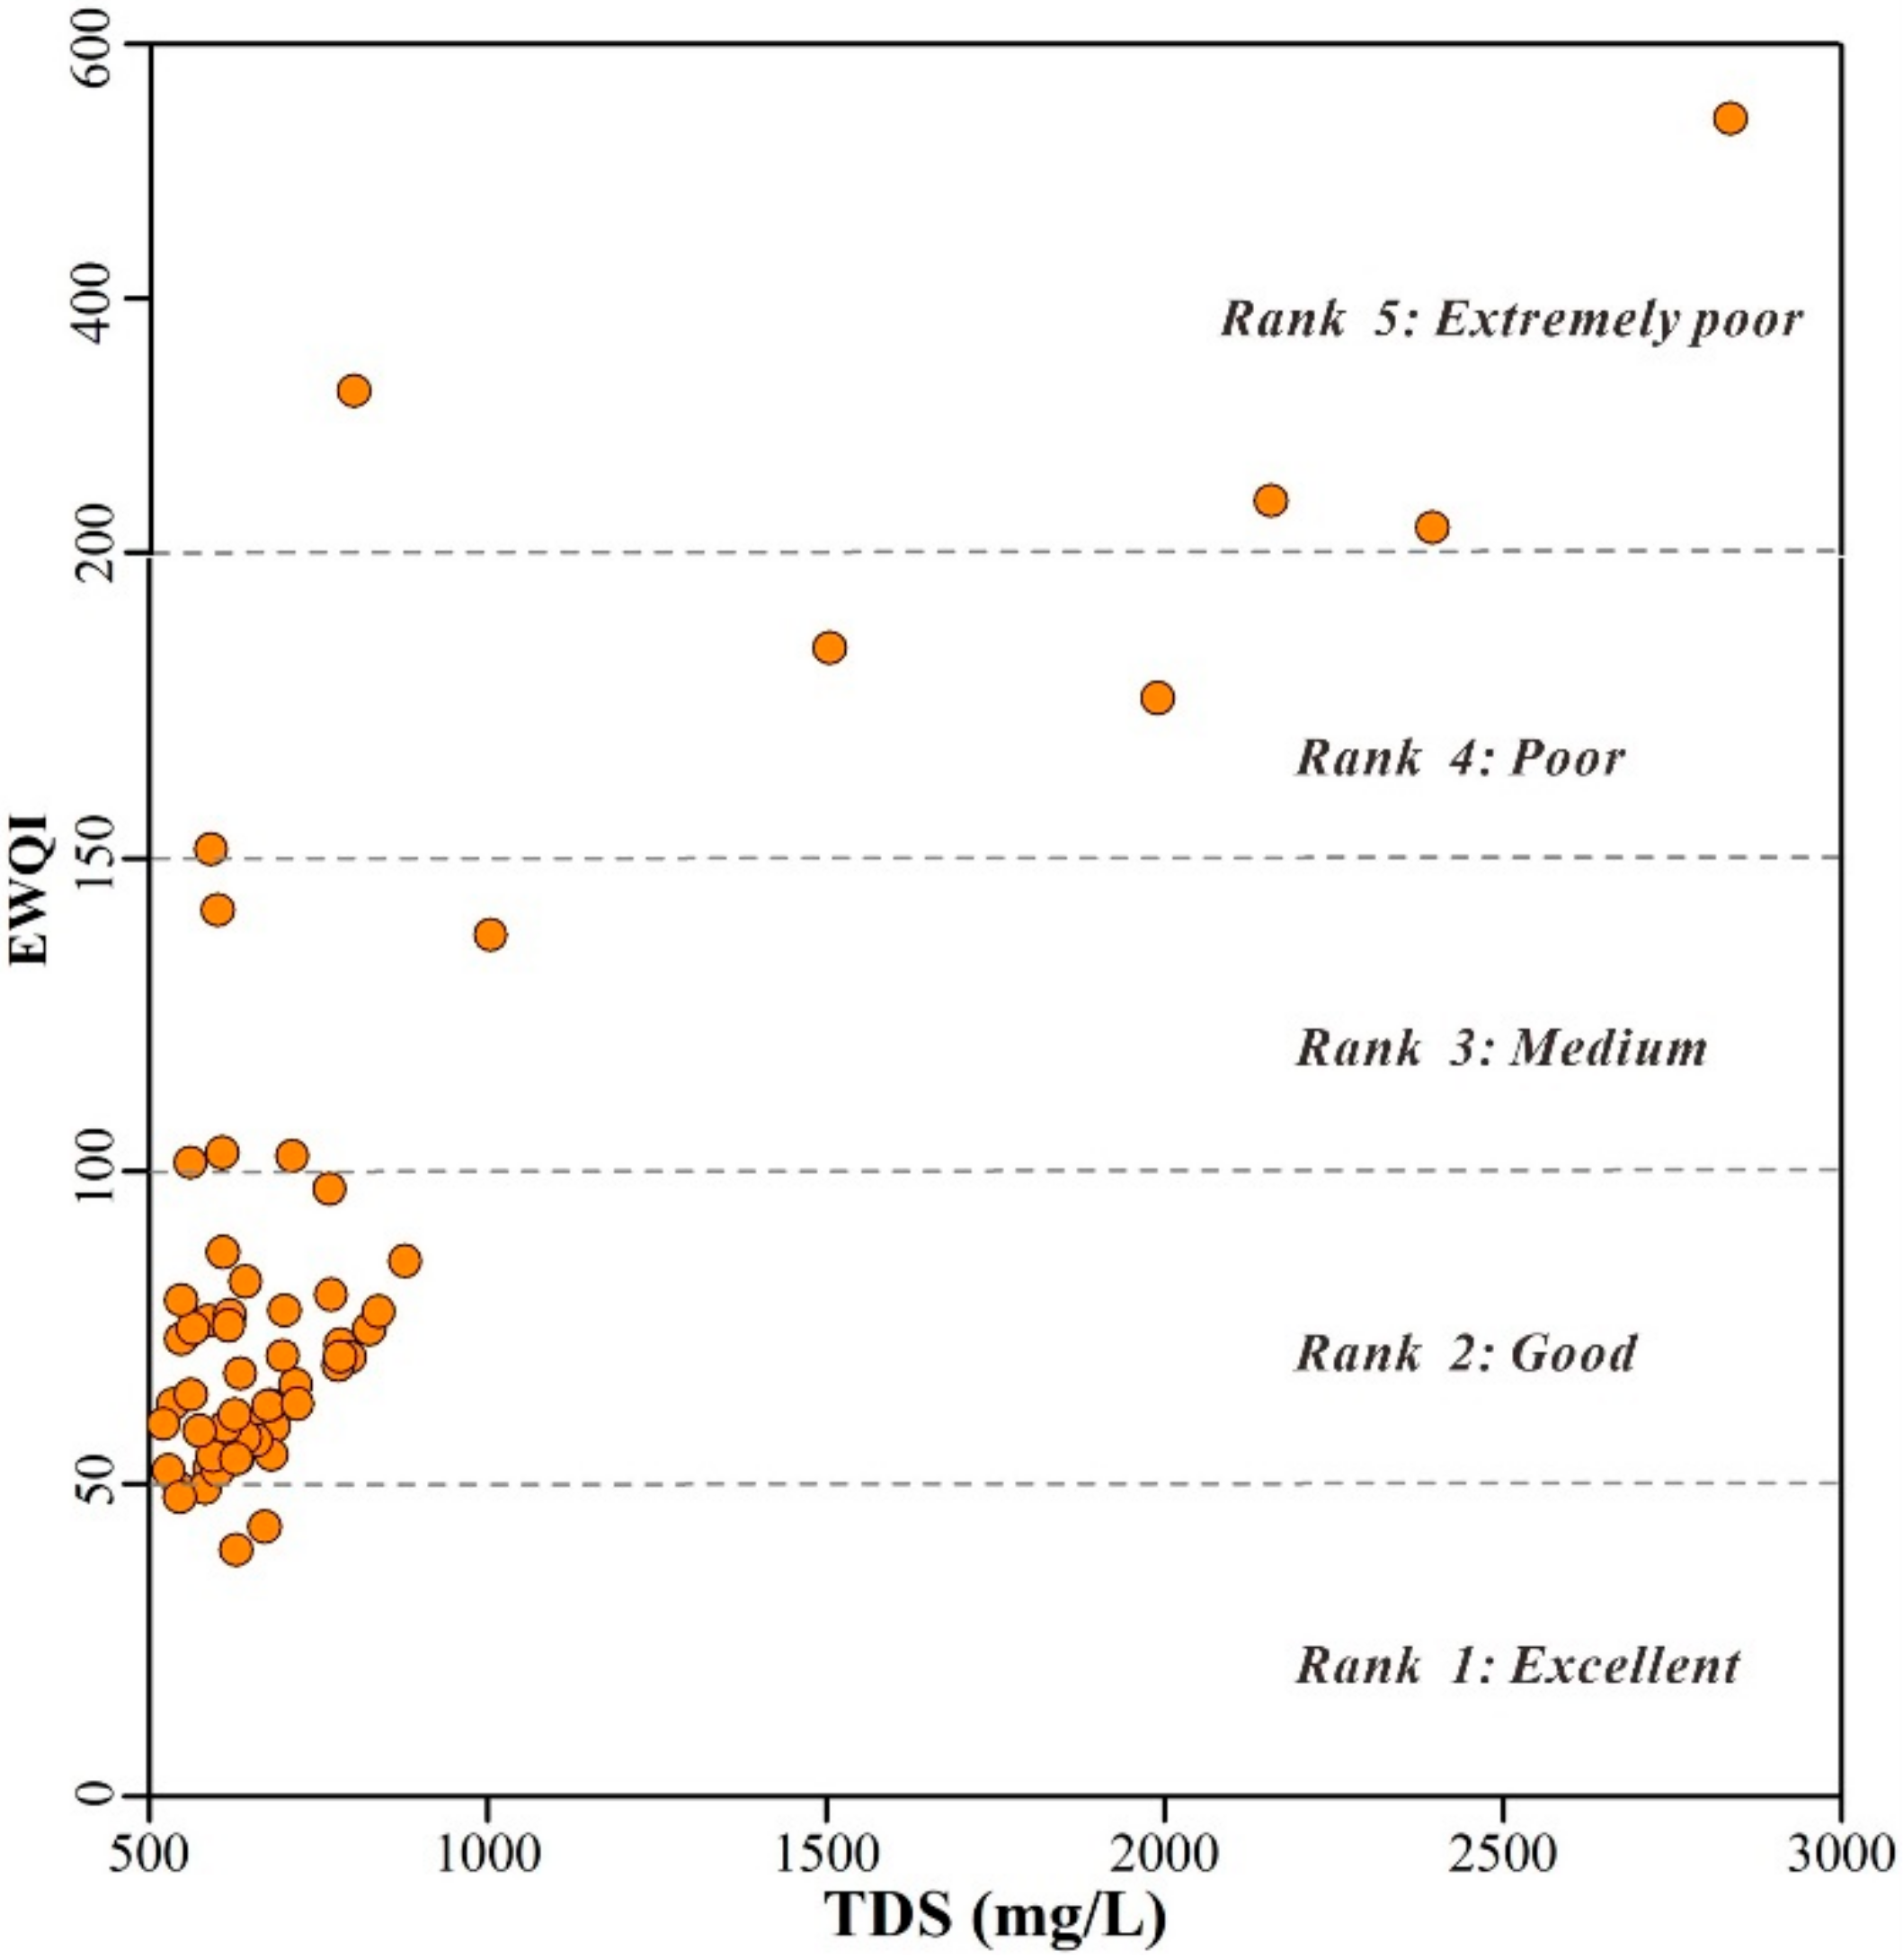
3.2.1. Groundwater Quality Assessment Based on EWQI

The overall groundwater quality was determined with the aid of the EWQI approach. A total of 19 hydro-chemical parameters, including pH, EC, TH, TDS, nitrogen (NO3−, NO2−, NH4+), toxic metals (Zn, Mn, Fe), F, As, major anions (Cl, SO42−, HCO3−), and cations (Ca2+, Mg2+, Na+, K+), were involved in the EWQI assessment.
The results suggested that the EWQI value of sampled groundwater had a wide range from 39.4 to 541.6, suggesting excellent (rank 1) to extremely poor (rank 5) quality for confined groundwater in the study area. As demonstrated in Figure 5, most of the sampled groundwater (approximately 79.7% of the total samples) had an EWQI value less than 100, implying excellent (rank 1) and good (rank 2) water quality. This groundwater was suitable for drinking purposes. About 8.5% of the groundwater samples (five samples) had an EWQI value ranging from 100 to 150, indicating medium water quality (rank 3). Approximately 5.1% of the sampled groundwater (three samples) was found with an EWQI value in the range of 150–200, demonstrating poor water quality (rank 4). Other sampled groundwater (four samples, accounting for 6.8% of the total samples) was observed with an EWQI value exceeding 200, and even reached approximately 541.6. This groundwater was identified as having extremely poor quality and should be avoided to use for drinking purpose.
The spatial distribution of the EWQI rank for confined groundwater in the study area is demonstrated in Figure 6. It can be seen that confined groundwater had a water quality of rank 1 and rank 2 in most of the study area, implying excellent and good water quality. Groundwater that had relatively poor quality was found mainly distributed in the west, east, and central-south part of the study area. This relatively poor groundwater was dominantly identified as rank 3 (medium) quality, while groundwater that belonged to rank 4 (poor) and rank 5 (extremely poor) quality was spatially limited. Thus, groundwater in confined aquifers is safe and suitable for drinking purposes in most of the study area. However, attention should be paid to the relatively poor groundwater quality area if the confined groundwater is considered for a local drinking water supply.

3.2.2. Potential Health Risk Assessment

As described before, there were five contaminants, including NO2−, NH4+, F, Mn, and Fe, in the groundwater of the study area that were found to exceed the permissible limits for drinking purposes. Generally, these contaminants in drinking water may pose potential threats to various populations. Thus, a human health risk assessment was conducted to figure out the potential overall health risks of these contaminants to human beings and the responsibility of each contaminant.
The results of the human health risk assessment for infants, children, adult females, and adult males were expressed like HQ and HI [57], and are statistically listed in Table 4 and presented Figure 7. It can be seen that there existed potential noncarcinogenic health risks to all populations, including infants, children, adult females, and adult males, based on the overall assessment results, i.e., HI of multiple elements (NO2−, NH4+, F, Mn, and Fe). For the minors, the HI value varied from 9.62 × 10⁻¹ to 4.11 × 100, with an average of 2.19 × 100 for infants, and between 5.95 × 10⁻¹ and 2.54 × 100 with an average of 1.35 × 100 for children. For the adult females and males, the HI value ranged from 4.27 × 10⁻¹ to 1.82 × 100 and between 5.09 × 10⁻¹ to 2.17 × 100, respectively, and averaged at 2.93 × 10⁻¹ and 1.16 × 100. The younger ages seemed more prone to be threatened by contaminants in groundwater than the older [50,51]. Additionally, males are more sensitive to the harmful chemical substances in drinking water than females. Overall, the total chronic non-carcinogenic health risk was in the order of adult females < adult males < children < infants.
Generally, if water has an HI value less than 1, the potential non-carcinogenic risk is very low and can be ignored. If the HI value is in the range of 1–4, medium chronic risk is implied, and a value beyond 4 is regarded as high chronic risk. In the present study, about 98.3% of sampled groundwater had an HI value exceeding 1 for infants, suggesting the chronic risks to infants cannot be ignored, while most of the samples (approximately 96.6%) had HI values falling in the range of 1−4, implying medium chronic risk. Only one sample (accounting for ~1.7% of the total samples) had an HI value beyond 4, demonstrating high chronic risk. For children, about 18.6% of the sampled groundwater was found with an HI value within 1, implying negligible risk. The other 81.4% of groundwater had an HI value in the range of 1–4, suggesting medium chronic risk, while for the adult females and males, approximately 55.9% and 35.6% of the sampled groundwater was observed with an HI value less than 1. Thus, their potential non-carcinogenic risks can be ignored. The maximum value of HI for adult females and males were all within 4, indicating only medium chronic risk and no high chronic risk for adults.
The spatial distribution of potential non-carcinogenic risk for infants, children, adult females, and adult males are presented in Figure 7. It can be clearly seen that the areas of potential health risk for different populations are in the order infants > children > adults (females and males), indicating the young ages are more at risk than the older in the study area. This confirmed the aforementioned conclusion that young populations are more prone to the harmful substances in groundwater. Spatially, confined groundwater in the northwestern region had better water quality and low health risk for all populations based on the HI values. The high potential chronic risk by groundwater ingestion was sporadically distributed in the study area and only for infants.

3.3. Responsibility of Hydrochemical Indices for Poor Water Quality

The EWQI assessment suggested that confined groundwater with relatively poor quality was mainly distributed in the west, east, and central−south part of the study area. In order to determine the responsibility of hydrogeochemical indices for poor water quality, various chemical indices were examined by comparing with the EWQI results.
As demonstrated in Table 3, a total of 13 chemical indices, including pH, TDS, TH, Ca, Mg, Na, Cl, SO42−, NO2, NH4+, F, Fe, and Mn were found beyond the guidelines for drinking purposes at some local sites. These exceeding parameters potentially led to the poor quality of groundwater. As all groundwater was illustrated as neutral to slightly alkaline nature water, with the pH in the range of 6.9−9.8 with an average of 8.3, pH should not be the dominant factor contributing to poor groundwater quality in the study area. Thus, the other 12 exceeding indices were examined, and their spatial distribution is presented in Figure 8. It can be clearly seen that the distribution of groundwater with high TDS, TH, Ca, Mg, Na, Cl, and SO42− was almost the same in the study area. This indicated that the high concentration of major ions, including Ca, Mg, Na, Cl, and SO42−, were responsible for the high TDS and TH of confined groundwater in the study area. Additionally, some of these aforementioned areas were found to have high NO2, NH4+, F, Fe, and Mn, while the distribution of high F groundwater was widespread, and mainly in the eastern study area. The high Fe groundwater was also found in the central region of the study area adjacent to the Wuyi town.
Comparing the distribution of EWQI results (Figure 6) and exceeding indices (Figure 8), it can be seen that the distribution of poor groundwater was consistent with the spatial distribution of high TDS and TH groundwater. This indicated that the exceeding major ions were essentially responsible for the overall poor quality of confined groundwater in the study area. Figure 6 illustrates that the relatively poor quality (rank 3: medium quality) groundwater was also distributed in the central region close to the Wuyi town, where groundwater had high Fe and F, but no high major ions, suggesting that minor elements also contributed to the poor quality of groundwater. However, groundwater in many regions with high F was not found to be poor quality groundwater (Figure 6 and Figure 8j), implying that the high F was not the main factor leading to overall poor quality of confined groundwater in the study area. In a word, the overall poor quality of confined groundwater in the study area was predominantly led by the high content of major ions (represented by TDS, TH, Ca, Mg, Na, Cl, and SO42−) and also contributed to by the high concentration of other minor elements, including NO2, NH4+, F, Fe, and Mn to some degree.
Although the minor elements (NO2, NH4+, F, Fe, and Mn) that exceeded the guideline had small contributions to the overall poor water quality assessed by EWQI approach, they can potentially pose health risk to human health in daily water ingestion. As demonstrated in Figure 7 and Figure 9, the overall non-carcinogenic health risk exists for all populations according to the human health risk assessment. To reveal the contribution of each contaminant (i.e., NO2, NH4+, F, Fe, and Mn) that exceeded the guideline to the potential health risk, the HQ of an individual contaminant was examined with box plots in Figure 9. It can be seen that the HQ value of NO2, NH4+, and Mn was less than the permissible limit of 1 for both minors and adults (Figure 9b,c,f), indicating that the potential health risk posed by individual contaminants of NO2, NH4+, and Mn was negligible for all populations. The HQ value of Fe was found beyond the permissible limit (HQ = 1) only for infants at two sites (Figure 9e) located in the west and southeast of the study area, with relatively high Fe groundwater (Figure 8k), while the HQ value of F was found exceeding the permissible limit of 1 at many sites for all populations. The HQ value of F for infants, children, adult females, and adult males was in the range of 0.89–4.04, 0.55–2.5, 0.40–1.79, and 0.47–2.14, respectively, and averaged at 2.01, 1.24, 0.89, and 1.06. It can be clearly seen from Figure 9a,d that the HQ value of F contributed a dominant proportion of the HI value. Additionally, the distribution of overall potential non-carcinogenic health risk (Figure 7) was almost consistent with the spatial distribution of high fluoride groundwater (Figure 9). The above demonstrates that the potential non-carcinogenic health risks to various populations is mainly caused by the high fluoride in groundwater.
Totally, the overall poor quality of groundwater was mainly due to the high concentration of major ions (TDS, TH, Ca, Mg, Na, Cl, and SO42−). The minor elements that exceeded the guideline (i.e., NO2, NH4+, F, Fe, and Mn) were also responsible for the overall poor quality of groundwater in the study area, but their contribution was limited and small. The potential non-carcinogenic health risks for various populations are essentially caused by high fluoride in groundwater. High concentration of Fe in groundwater can also pose potential health hazards to infants at some sporadic sites, while the health threats from NO2, NH4+, and Mn are very low and can be ignored for all populations. Thus, attention should be paid to the high concentration of major ions, fluoride, and Fe in groundwater when exploiting the confined groundwater for domestic water supply.

3.4. Formation Mechanisms of Poor Groundwater Quality

In order to reveal the mechanisms governing the hydrochemistry of groundwater in confined aquifers, the Gibbs diagrams were introduced in the presented study. The Gibbs diagrams, which were constructed by the relationship of TDS versus Na+/((Na++Ca2+) and Cl/(Cl+HCO3), divided the natural formation mechanisms of groundwater chemistry into three categories, i.e., rock, evaporation, and precipitation dominance. As shown in Figure 10, all sampled groundwater was plotted in the rock dominance, indicating that the hydrogeochemical composition of groundwater in confined aquifers is predominantly governed by the water−rock interactions.
To further illustrate the interactions regulating the composition of groundwater, ion correlation analysis was performed in the present study. If the dissolution of carbonate and sulfate minerals is the dominant processes contributing Ca2+, Mg2+, HCO3, and SO42− to groundwater, then the milliequivalent ratio of Ca2+ + Mg2+ and HCO3 + SO42− is approximately 1:1. As shown in Figure 11a, the majority of groundwater samples plot below the 1:1 line, showing an excess of Ca2+ and Mg2+. Thus, carbonate and sulfate mineral dissolution should not be the only sources of Ca2+ and Mg2+ in groundwater. Generally, if the Ca2+ and Mg2+ in groundwater are all from the dissolution of dolomite (Equation (12)) and calcite (Equation (13)), the milliequivalent ratio of Ca2+ + Mg2+ and HCO3 should be close to 1:1, while, except a few of the samples, the majority of the sampled groundwater was observed below the 1:1 line (Figure 11b), suggesting that the dissolution of carbonate minerals like dolomite, calcite, and aragonite were not the dominant sources of Ca2+ and Mg2+ for groundwater, or there exists some processes decreasing the content of Ca2+ and Mg2+ in groundwater. Additionally, the relationship between Ca2+ and HCO3 was examined in Figure 11c. It can be seen that most of sampled groundwater was below the 2:1 line, confirming the aforementioned reference.
CaMg(CO3)2 + 2CO2 + 2H2O→Ca2+ + Mg2+ + 4HCO3
CaCO3 + CO2 + H2O→Ca2+ + 2HCO3
Fresh water in a natural environment generally has a low abundance of SO42− and mainly originates from the dissolution of gypsum (Equation (14)) and anhydrite (Equation (15)). The milliequivalent ratio of Ca2+ and SO42− should be 1:1. It can be seen from Figure 11d that all groundwater samples were situated below the 1:1 line of gypsum dissolution, implying the existence of some hydro-chemical processes that can decrease the content of Ca2+, such as the cation exchange process.
CaSO4 2H2O→Ca2+ + SO42− + 2H2O
CaSO4→Ca2+ + SO42−
Theoretically, the milliequivalent ratio of Na+ and Cl is 1:1 if these two ions in groundwater originate only from halite dissolution (Equation (16)). In this study, most of the samples plotted above the halite dissolution line (1:1 line), exhibiting that the content of Na+ was higher than Cl (Figure 11e). This suggests that Na+ in groundwater is not only from halite dissolution, and that some other processes also contribute Na+ to water in the confined aquifers.
NaCl→Na+ + Cl
The end−member diagrams proposed by Gaillardet, et al. [58] were constructed in the present study to illustrate the involved rocks in the water−rock interaction processes. The types of rocks contributing to the hydrochemistry can be identified from three rock type end−members, including evaporites, silicates, and carbonates, with the aid of the ratios of Mg2+/Na+ and HCO3/Na+ versus the ratio of Ca2+/Na+. It can be seen from Figure 12 that sampled groundwater situated in the zone from evaporites to silicates. This confirmed the aforementioned conclusions that the dissolution of evaporites (halite and sulfate) is one of the dominant processes contributing the major ions to groundwater. Additionally, the weathering of silicates (Equation (17)) is a predominant source of Na+ and HCO3 in groundwater, resulting in higher Na+ and HCO3 than Cl (Figure 11e) and Ca2+ + Mg2+ (Figure 11b), respectively. As shown in Figure 12, none of the sampled groundwater was found in the zone of carbonates, implying that the dissolution of carbonate minerals (dolomite, calcite, and aragonite) is not the main source of Ca2+ + Mg2+ and HCO3 in groundwater. This evidenced the conclusion above from Figure 11b,c.
2NaAlSi3O8 + 2CO2 + 11H2O→Al2Si2O5(OH)4 + 4H4SiO4 + 2Na+ + 2HCO3
The major cations exhibited an excess of Na+ and deficiency of Ca2+ and Mg2+ in groundwater (Figure 11). This phenomenon is usually caused by the ion exchange process between water and the aquifer medium. The relationship of Na+ + K+ + Cl versus Ca2+ + Mg2+ − HCO3 − SO42− can be used to examine the occurrence of ion exchange in the aquifer [43]. As presented in Figure 13a, most of the groundwater samples situated along the 1:1 line in the lower right part of the bivariate diagram, suggesting that the composition of major ions in groundwater is influenced by the cation exchange reaction (Equations (18) and (19)) in aquifers. The chloro-alkaline indices (CAI-1 and CAI-2) were computed to further verify the occurrence of a cation exchange reaction. If the cation exchange reaction is one of the dominant hydro-chemical processes governing groundwater chemistry, the CAI-1 (Equation (20)) and CAI-2 (Equation (21)) should both be negative. If all chloro−alkaline indices demonstrate positive, then a reverse cation exchange reaction occurs. It can be seen that the majority of samples situated in the lower left part of the bivariate diagram composed by CAI-1 and CAI-2, exhibiting negative chloro−alkaline indices. This evidenced that the cation exchange reaction is one of dominant processes controlling the abundance of major ions in groundwater.
Ca2+ + 2NaX→2Na+ + CaX2
Mg2+ + 2NaX→2Na+ + MgX2
CAI-1= (Cl−(Na++K+))/Cl
CAI-2= (Cl−(Na++K+))/(HCO3+SO42+CO32+NO3)
For further illustrating the contribution of specific mineral dissolution to hydro-chemical composition, the saturation status of related minerals in groundwater was examined with the aid of the saturation index (SI) of selected minerals. The SI values were computed using PHREEQC software. As demonstrated in Figure 14, most of the sampled groundwater was observed with a saturation index of carbonate minerals, including dolomite, calcite, and aragonite, greater than 0, implying oversaturated status. This confirmed the aforementioned conclusion that the dissolution of carbonate minerals is not the main source for major ions in groundwater. For the evaporate minerals, including halite, anhydrite, and gypsum, almost all groundwater was found with a saturation index below 0, indicating evaporate mineral (if existing) dissolution can greatly contribute to the abundance of major ions in groundwater. This evidenced that the dissolution of halite, anhydrite, and gypsum is the main source of major ions in the groundwater of the confined aquifers.
As discussed before, groundwater with relatively high F was widespread in the study area. Generally, fluoride in groundwater originates from natural fluoride-bearing mineral dissolution rather than from the anthropogenic inputs, especially in the relatively closed groundwater system. The sampled confined aquifers were deeply buried in the study area, with greater than 50 m of low permeability layers above them (Figure 2). Thus, anthropogenic sources of F from the surface are hard to input into the sampled aquifers, and the relatively high concentration of F in the groundwater was from geogenic origin. NO3 is a common contaminant from human society, is generally less than 10 mg/L in natural groundwater [50], and can be used as the indicator of anthropogenic pollution. It can be seen from Table 3 that all sampled groundwater had an NO3 concentration below this limit, suggesting no anthropogenic inputs in sampled aquifers. This confirmed the natural origin of F in groundwater. As presented in Figure 14, all sampled groundwater was found with a saturation index of fluoride below 0, indicating that the high concentration of F in groundwater is caused by the natural dissolution of fluoride minerals. As aforementioned, Fe in groundwater was also found in high concentrations at some local sites and potentially threatened groundwater quality. Nearly all groundwater had a saturation index of Fe-bearing minerals (jarosite, melanterite, and siderite) of less than 0, suggesting that Fe in groundwater could potentially come from the dissolution of Fe-bearing minerals, if existing. Thus, the relatively high concentration of Fe in groundwater at sporadic sites is also caused by geogenic genesis.
Overall, the high concentration of major ions in groundwater is dominantly caused by the natural dissolution of silicates and evaporates (including halite, gypsum, and anhydrite), as well as the cation exchange reaction. The widespread distribution of relatively high F in groundwater originates from fluoride-bearing mineral dissolution. The high content of Fe in groundwater at sporadic sites is from the dissolution of Fe-bearing minerals like jarosite, melanterite, and siderite on aquifer mediums.

4. Conclusions

Confined groundwater is the main water source for drinking purposes in the central area of the semi-arid North China Plain (NCP) due to the salty phreatic groundwater. Comprehensive investigation was conducted to reveal the hydrogeochemical characteristics, water quality status, and its formation mechanisms in confined aquifers of Wuyi County, a typical central area of the NCP in this present study. The main findings are as follows:
(1)
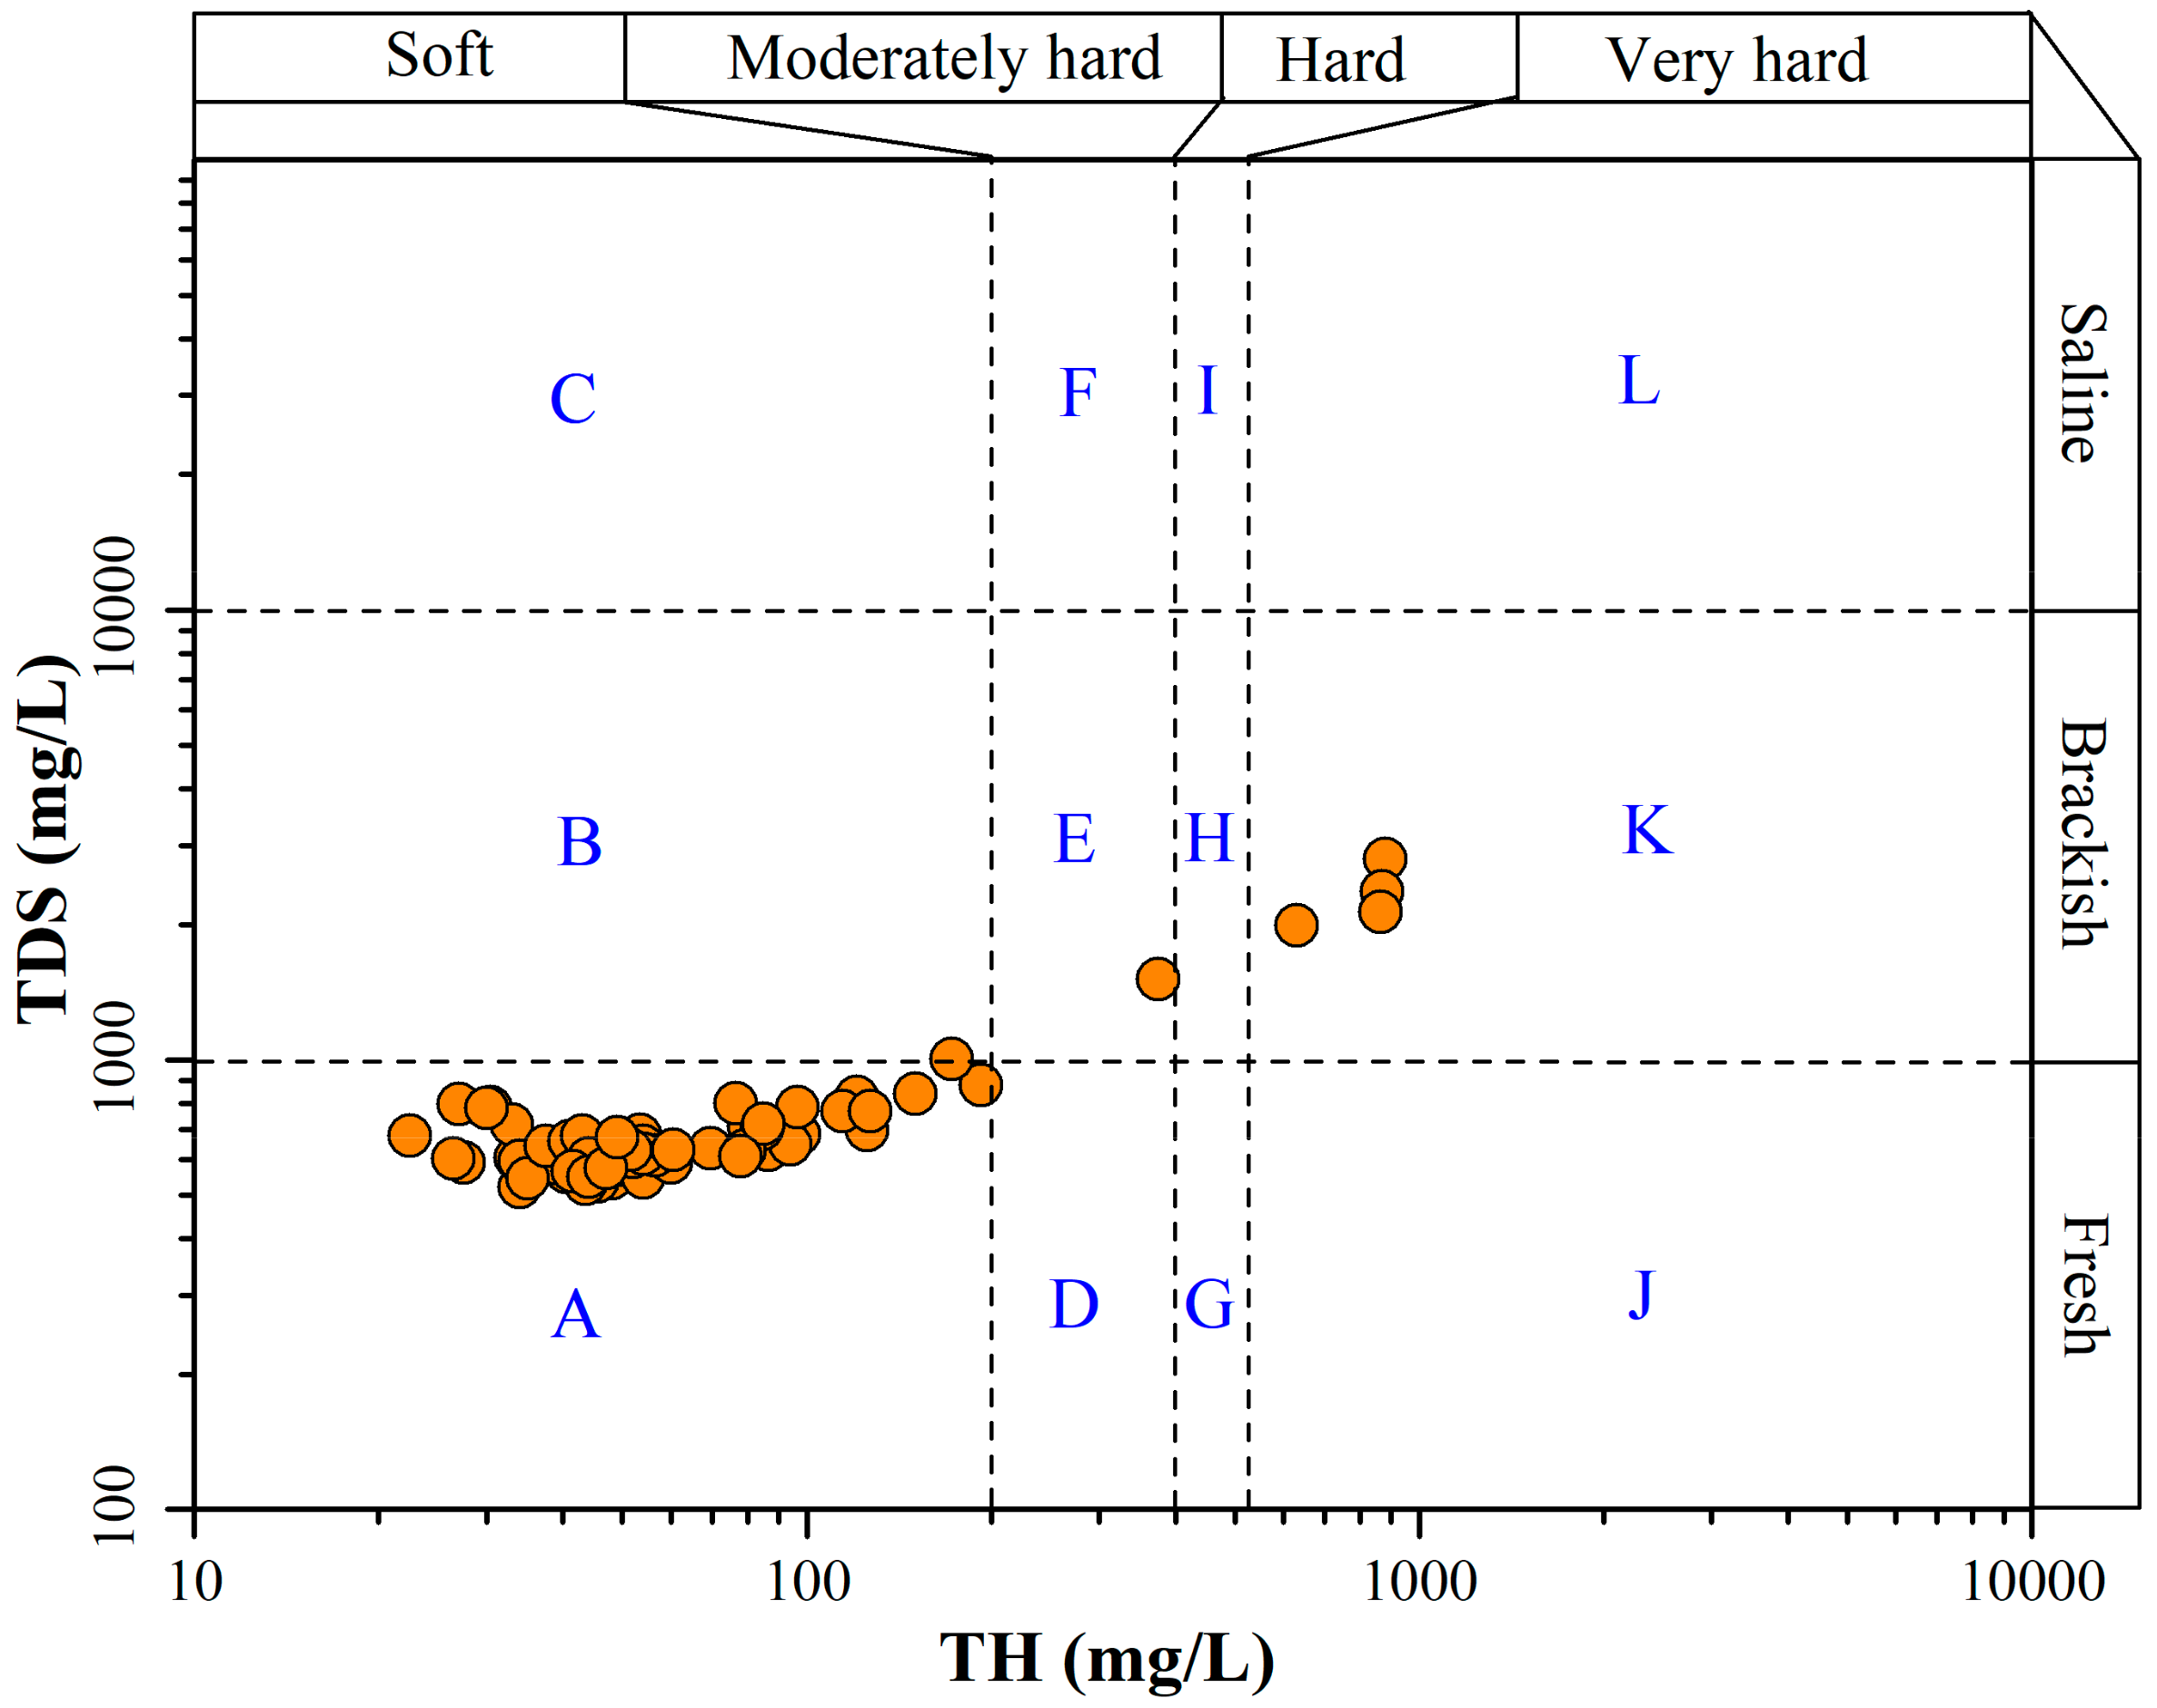
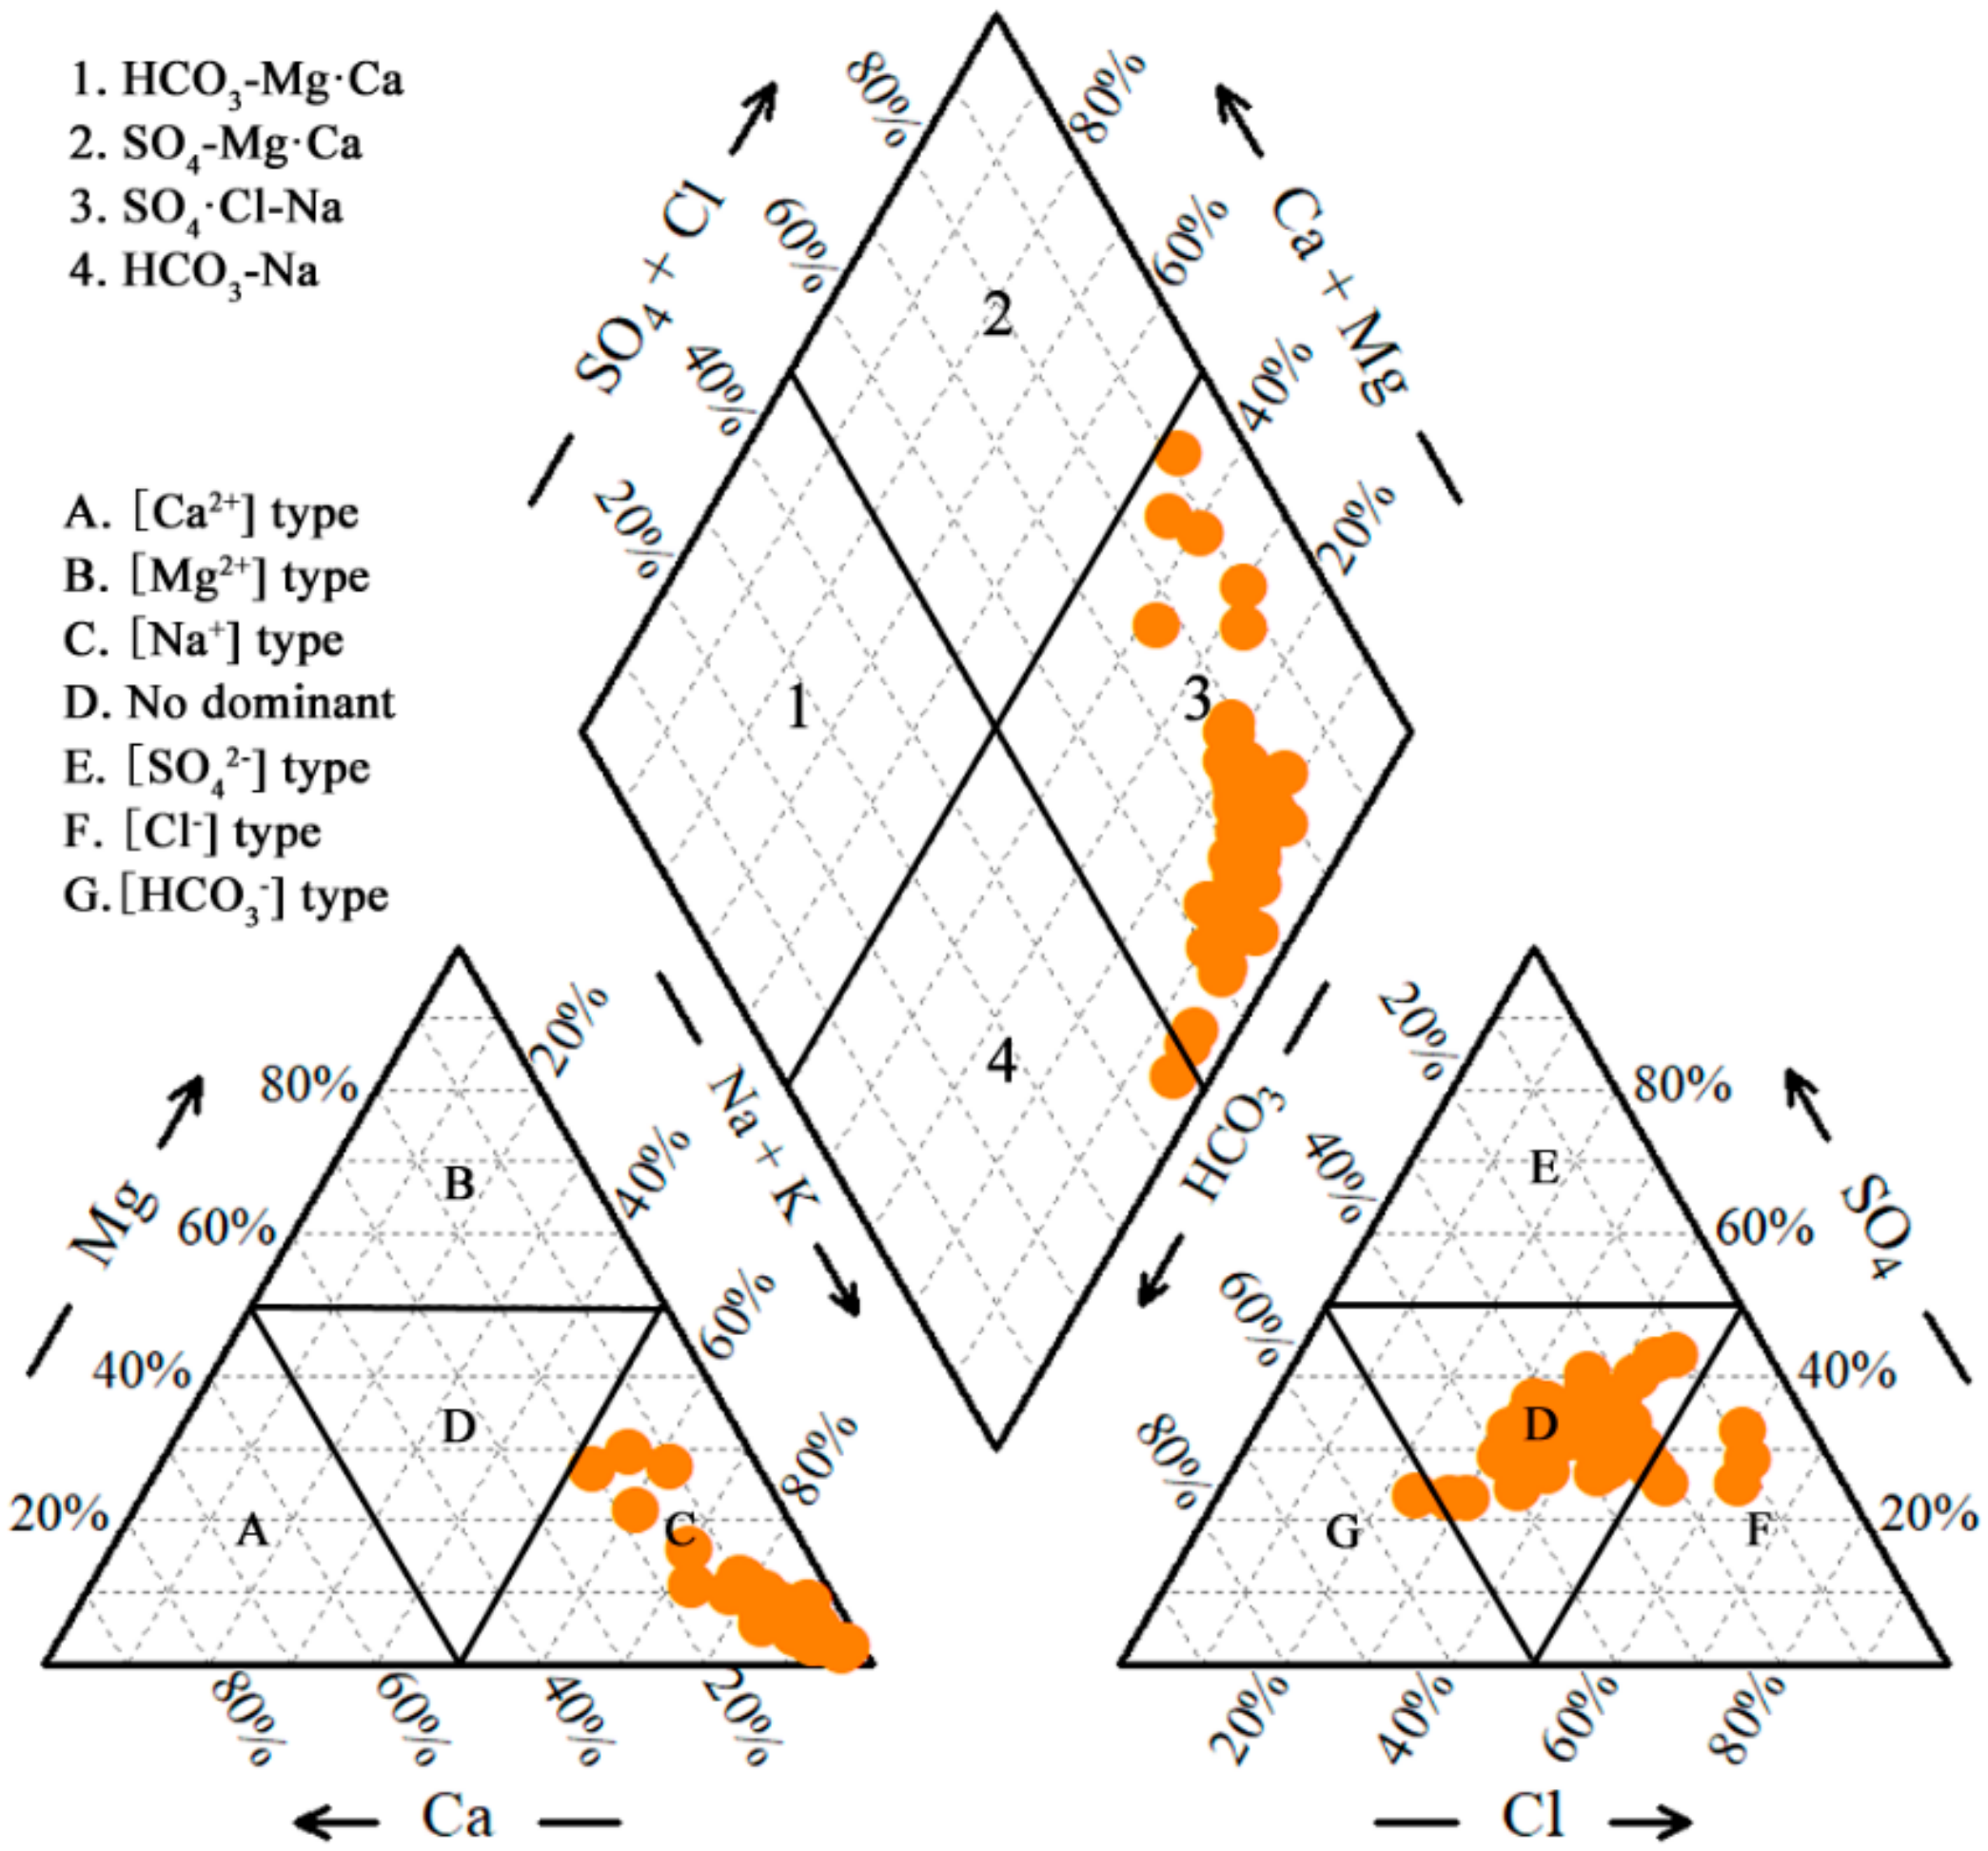
Groundwater in confined aquifers of the central NCP is naturally neutral to slightly alkaline water. TDS and TH values of confined groundwater are in the range of 522–2796 mg/L and 22.52–880.20 mg/L, respectively. Soft fresh water is predominantly (91.53%) occupied in confined aquifers of the study area, followed by very hard brackish water (6.78%) and moderately hard brackish water (1.69%). Confined groundwater has the major cations in the order of Na+ > Ca2+ > Mg2 > K+, but no dominant anions. Hydro-chemical types are dominantly SO4·ClNa type with a few of the HCO3−Na type. Nitrogen was found to exceed the permissible limits at local sites and dominantly in the form of NO2 (1.69%) and NH4+ (1.69%). Toxic metals, including Mn and Fe, exceed the permissible limits, and account for 10.17% and 45.76% of the total samples, respectively. F is a wide distribution contaminant (77.97% of samples exceeding the permissible limit) in confined groundwater, but the maximum is not too high and only 2.59 mg/L.
(2)
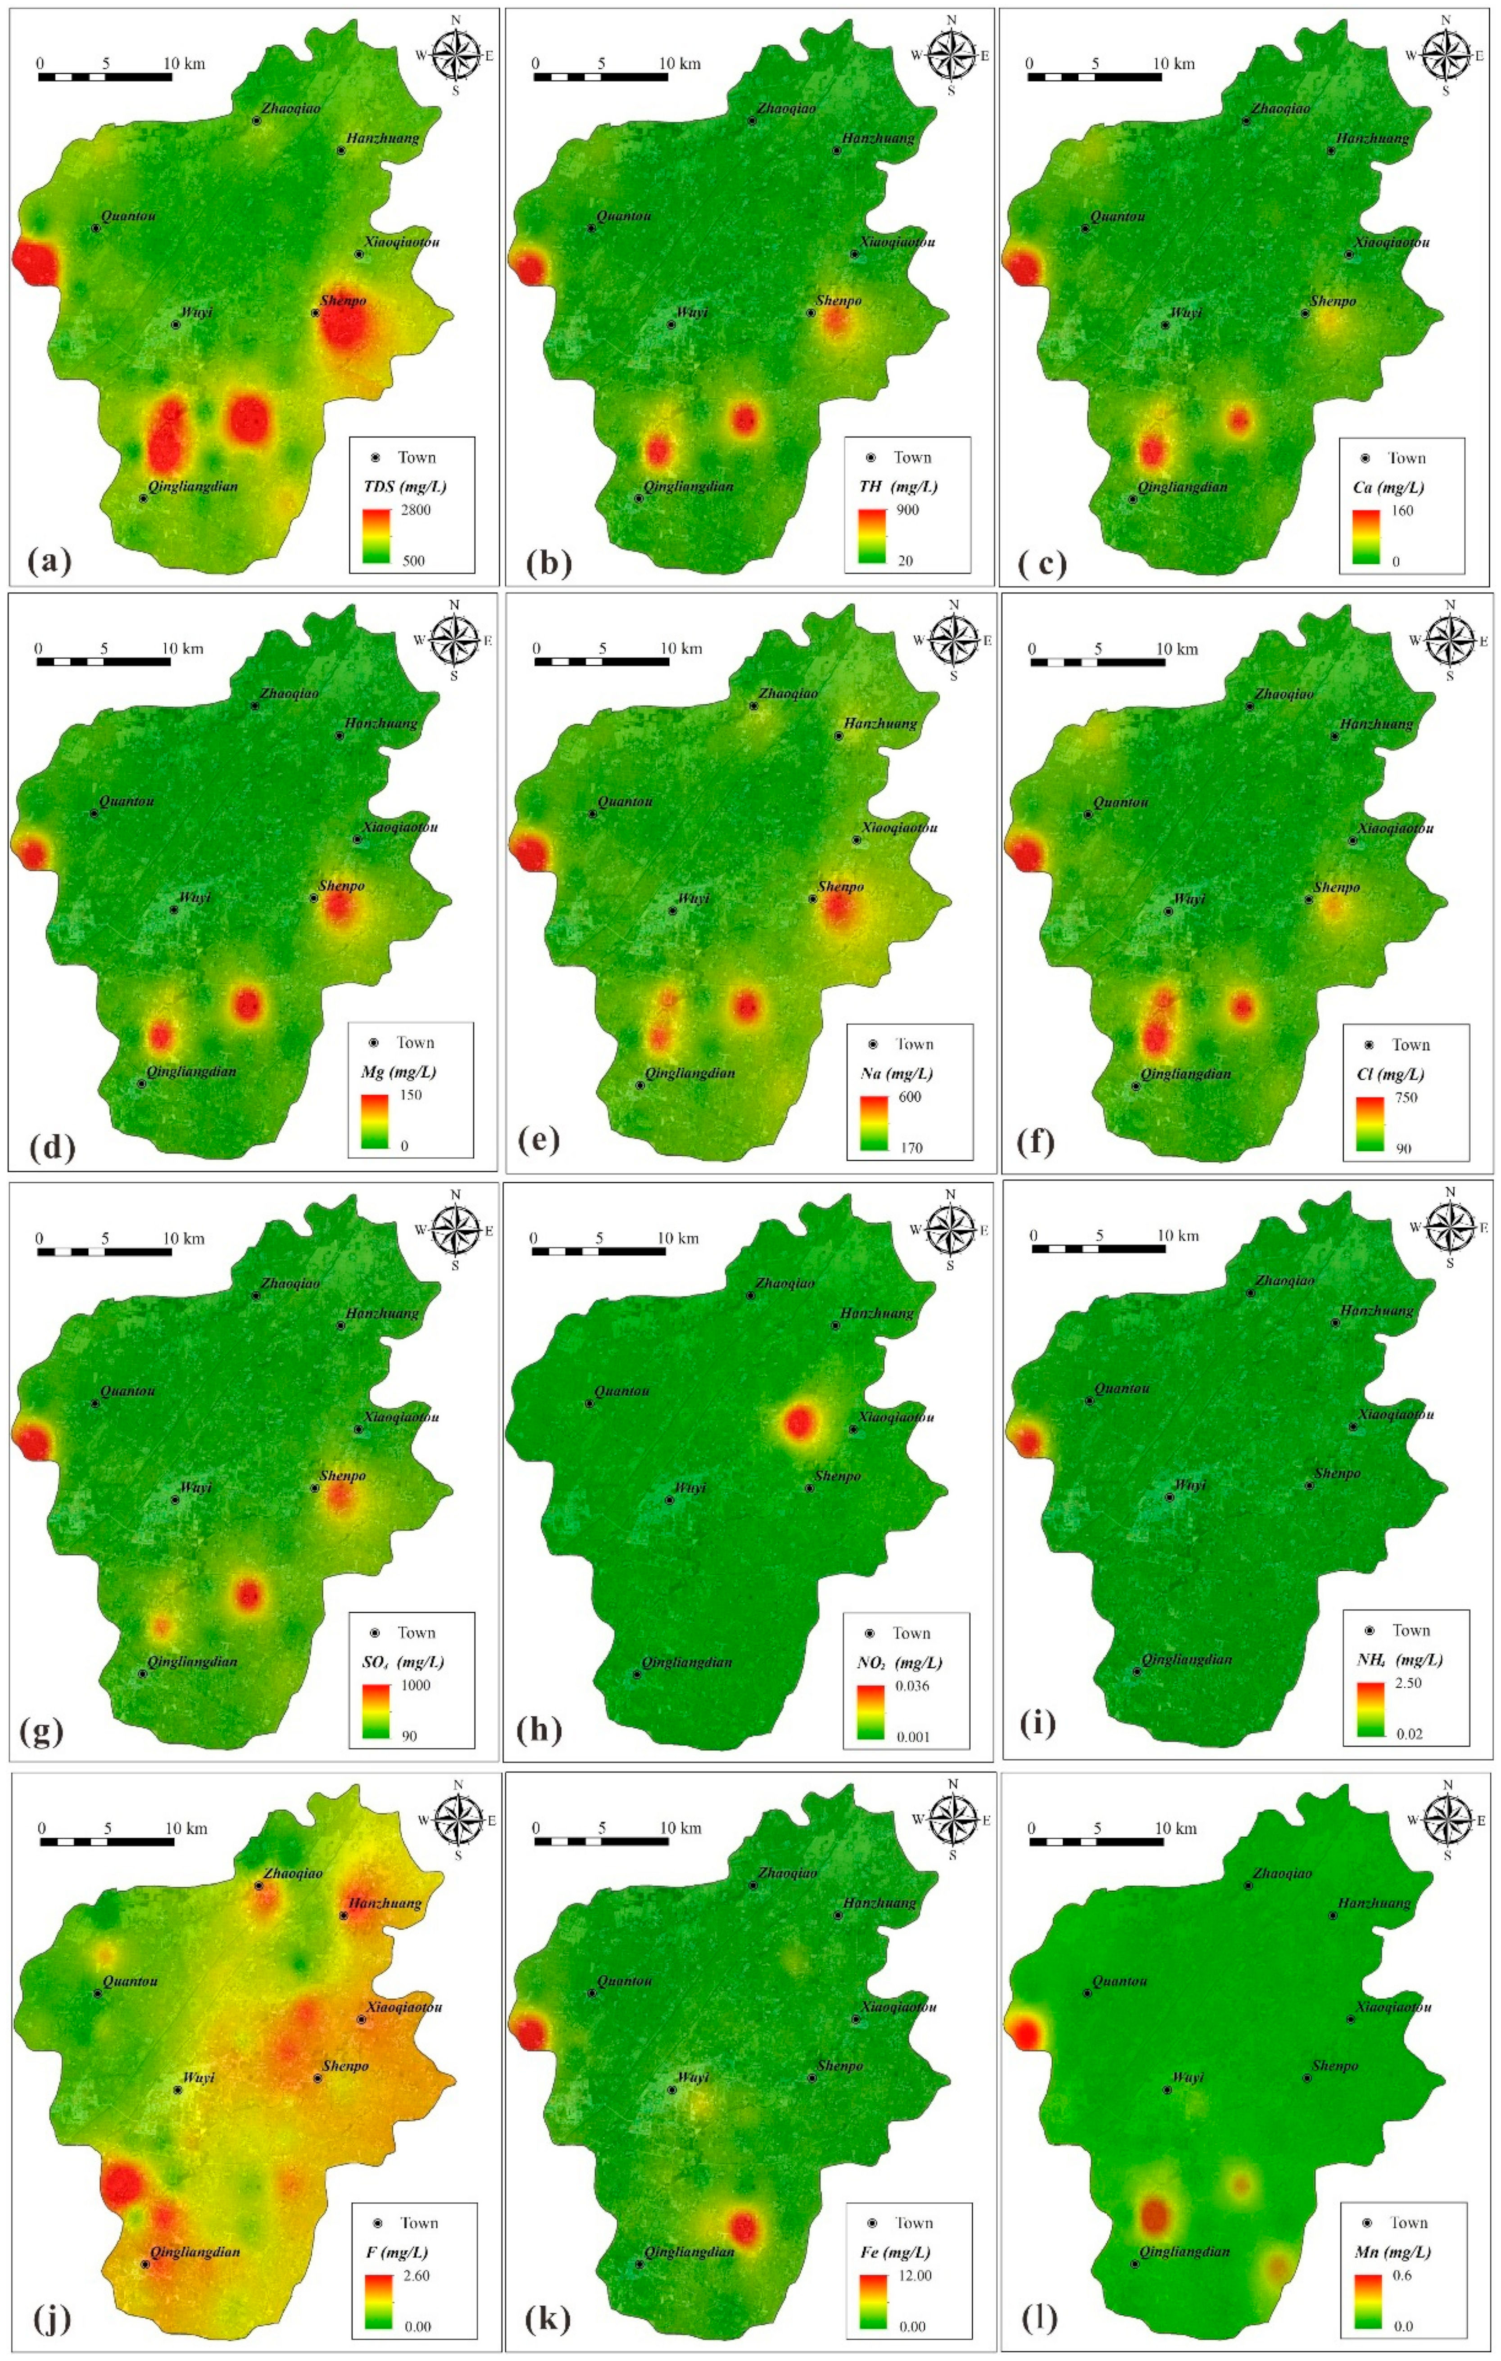
Groundwater quality in confined aquifers varies from excellent to extremely poor quality according to the EWQI assessment. Approximately 21.3% of the total groundwater samples come under the medium to extremely poor quality, and should be avoided as drinking water, whereas 79.7% of the sampled groundwater comes under the excellent and good quality and is most suitable for drinking purposes. Groundwater with relatively poor quality and dominantly medium quality are mainly distributed in the west, east, and central−south part of the study area, while that with poor and extremely poor quality is spatially limited. The overall poor quality of confined groundwater is predominantly led by the high content of major ions (represented by indices of TDS, TH, Ca, Mg, Na, Cl, and SO42−).
(3)
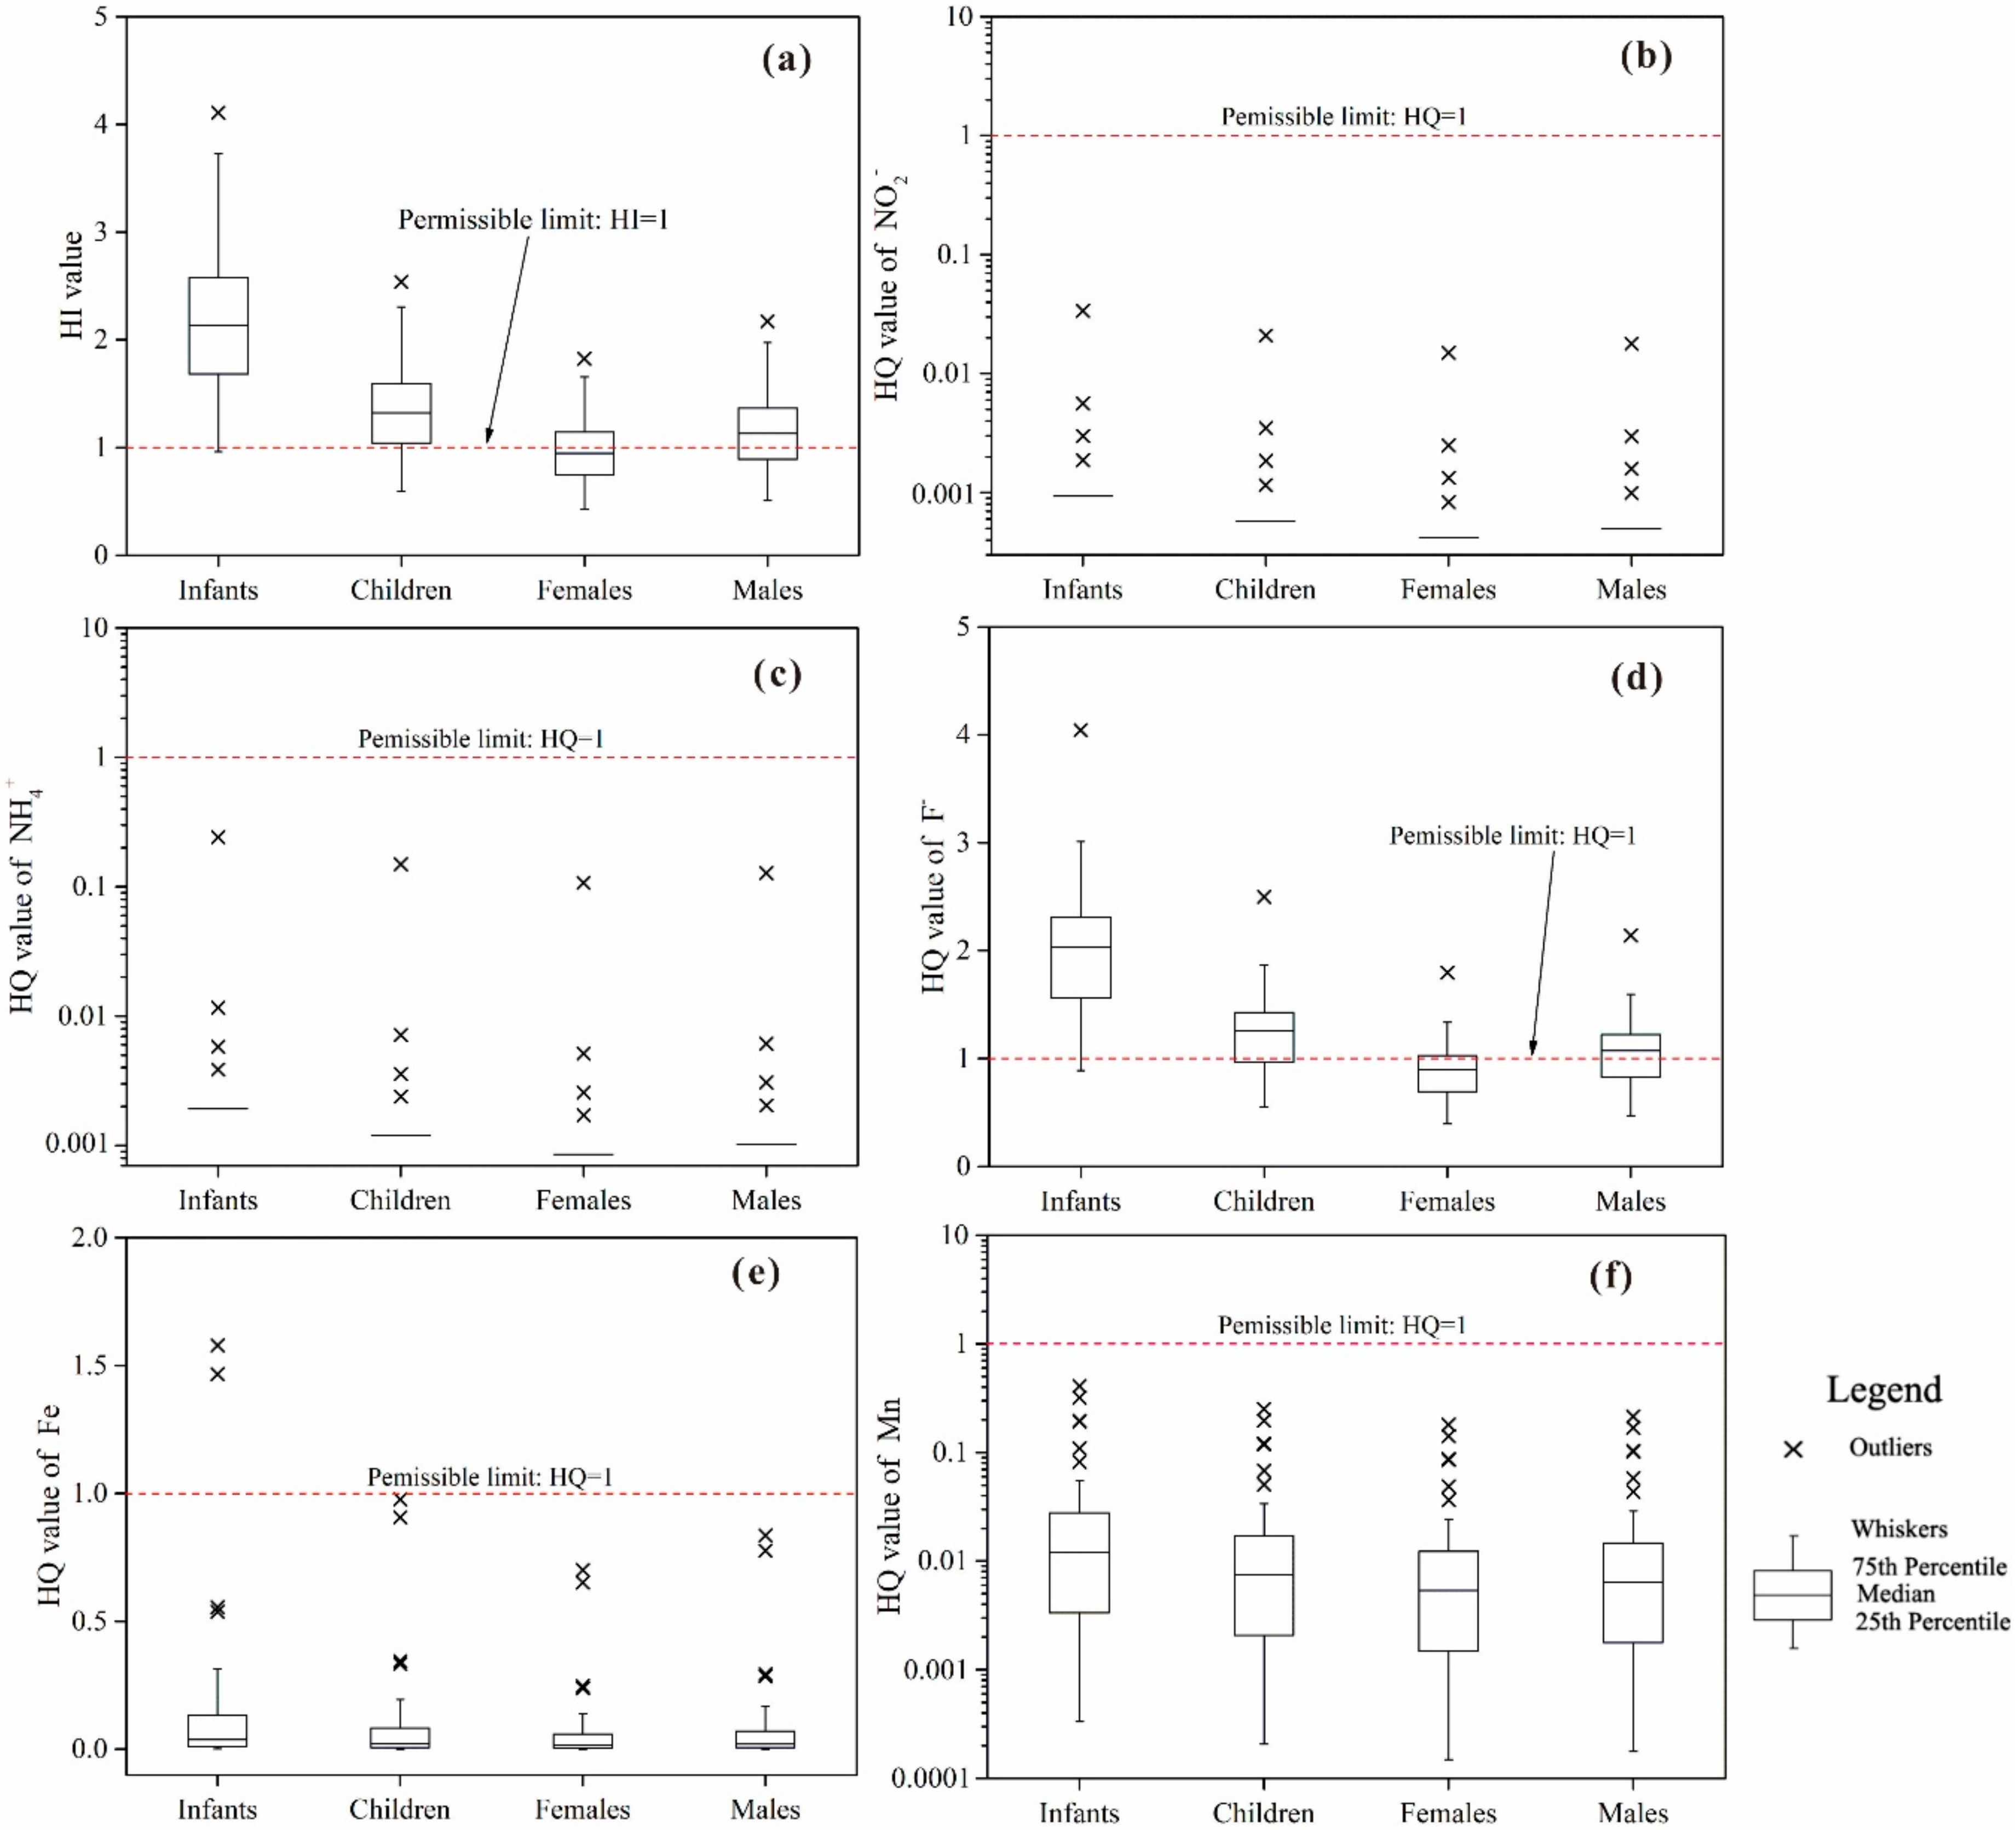
The susceptibility to total chronic non-carcinogenic health risk is virtually in the order of adult females < adult males < children < infants. Approximately 98.3%, 81.4%, 44.1%, and 64.4% of the total groundwater samples have potential non-carcinogenic risk (HI > 1) to infants, children, adult females, and adult males, respectively. Most groundwater samples with potential non-carcinogenic risk are of only medium chronic risk for various populations, and only one groundwater sample has high chronic risk to only infants. Spatially, confined groundwater in the northwestern region has low health risk for all populations. The high chronic risk is sporadically distributed in the study area and only for infants. The health threats are essentially caused by high fluoride and high Fe in groundwater, and threats caused by NO2, NH4+, and Mn are very low and negligible.
(4)
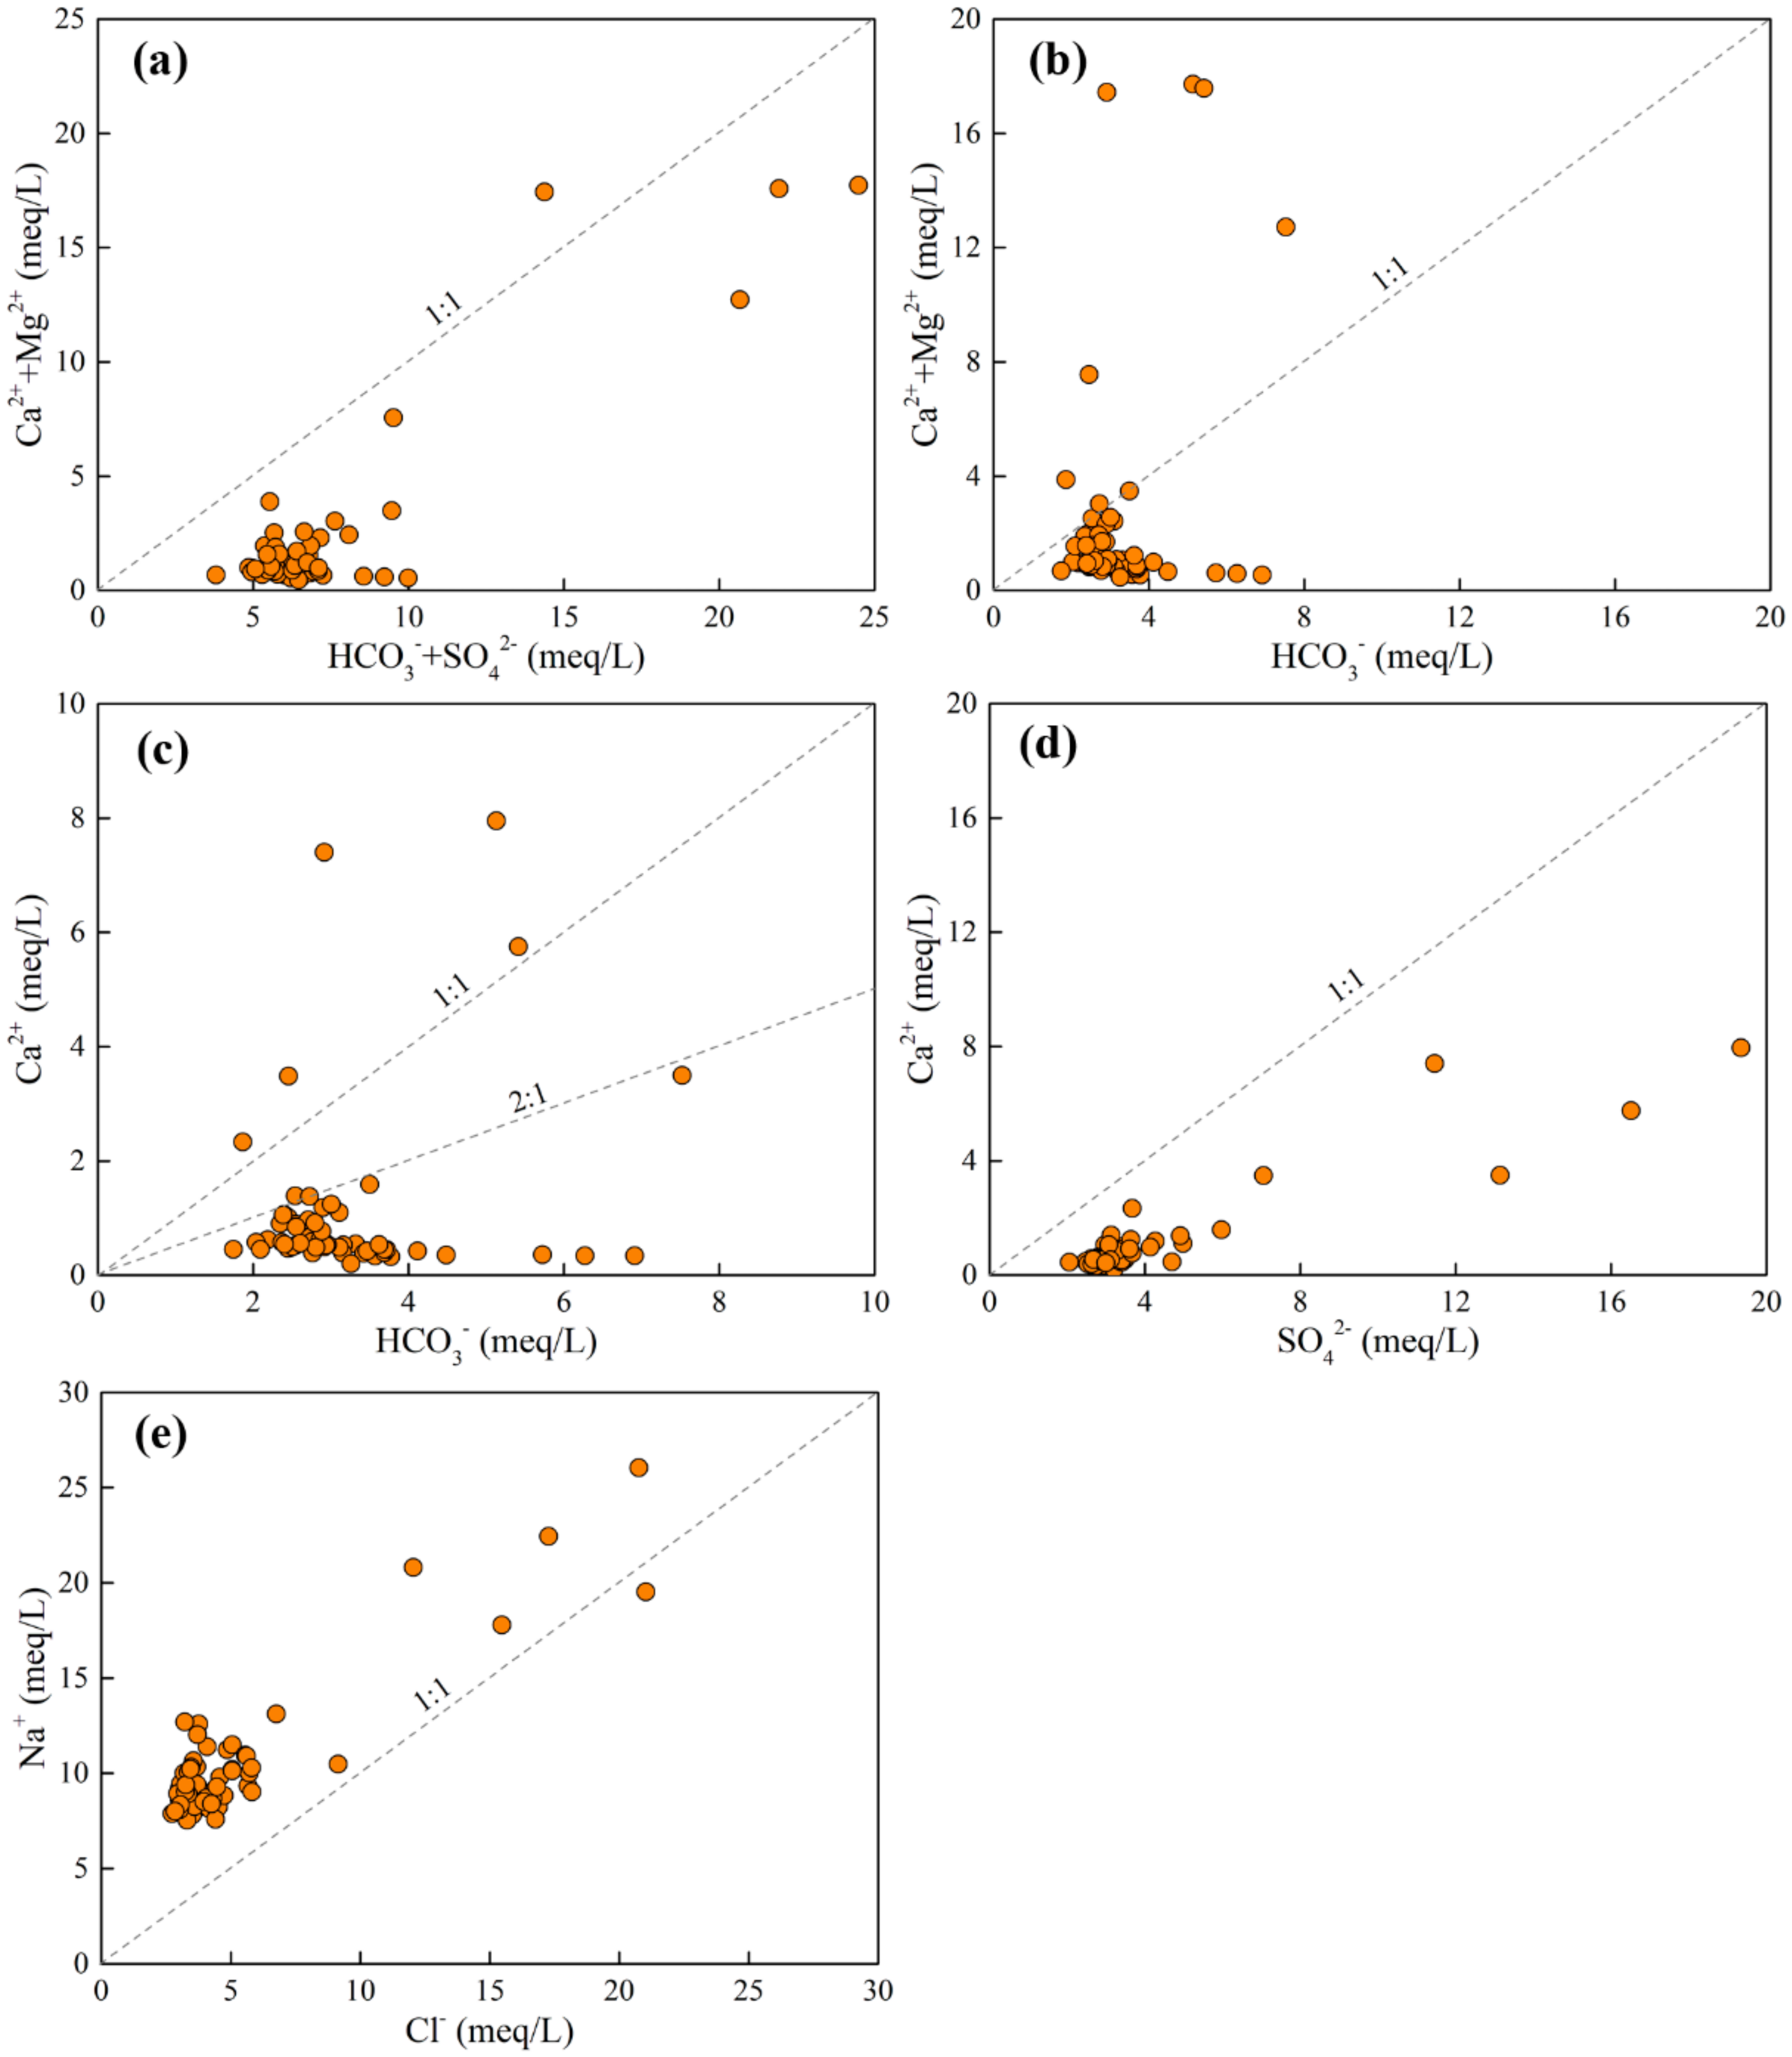
Groundwater chemistry in confined aquifers of the study area is predominantly governed by the natural mechanism of water−rock interactions but has no anthropogenic factor. The high content of major ions in confined groundwater which lead to overall poor water quality is caused by cation exchange and natural dissolution of silicates and evaporates (including halite, gypsum, and anhydrite). Elements potentially threatening human health are also natural in origin. The widespread distribution of relatively high F in groundwater is caused by the dissolution of fluoride-bearing minerals. The sporadically high Fe in groundwater originates from the dissolution of Fe-bearing minerals, like jarosite, melanterite, and siderite on aquifer mediums.

Author Contributions

Conceptualization, Y.X. and K.C.; Methodology, Q.H. and Y.X.; Formal Analysis, Q.H. and Y.X.; Investigation, Q.H., Y.Z. and J.L.; Data Curation, Q.H., Y.Z. and J.L.; Writing−Original Draft, Q.H. and Y.X.; Writing−Review & Editing, Y.X. and K.C.; Supervision, K.C. All authors have read and agree to the published version of the manuscript.

Funding

This research was funded by the Natural Science Foundation of China, grant number 41702282, 42007183, the China Geological Survey Project, grant number DD20160238, DD20190303, the Fundamental Research Funds for the Central Universities, grant number 2682019CX14, and the Student Research Training Program of Southwest Jiaotong University, grant number 201015.

Acknowledgments

Authors are grateful to the Editor and anonymous reviewers whose insightful comments were very helpful in improving the paper.

Conflicts of Interest

The authors declare no conflict of interest. The funders had no role in the design of the study; in the collection, analyses, or interpretation of data; in the writing of the manuscript, or in the decision to publish the results.

References

  1. Adimalla, N. Controlling factors and mechanism of groundwater quality variation in semiarid region of South India: An approach of water quality index (WQI) and health risk assessment (HRA). Environ. Geochem. Health 2020, 42, 1725–1752. [Google Scholar] [CrossRef] [PubMed]
  2. Xiao, Y.; Shao, J.; Frape, S.; Cui, Y.; Dang, X.; Wang, S.; Ji, Y. Groundwater origin, flow regime and geochemical evolution in arid endorheic watersheds: A case study from the Qaidam Basin, northwestern China. Hydrol. Earth Syst. Sci. 2018, 22, 4381–4400. [Google Scholar] [CrossRef] [Green Version]
  3. Wilby, R.L. A global hydrology research agenda fit for the 2030s. Hydrol. Res. 2019, 50, 1464–1480. [Google Scholar] [CrossRef] [Green Version]
  4. Li, P.; He, S.; Yang, N.; Xiang, G. Groundwater quality assessment for domestic and agricultural purposes in Yan’an City, northwest China: Implications to sustainable groundwater quality management on the Loess Plateau. Environ. Earth Sci. 2018, 77, 775. [Google Scholar] [CrossRef]
  5. Wang, Q.; Dong, S.; Wang, H.; Yang, J.; Huang, H.; Dong, X.; Yu, B. Hydrogeochemical processes and groundwater quality assessment for different aquifers in the Caojiatan coal mine of Ordos Basin, northwestern China. Environ. Earth Sci. 2020, 79, 199. [Google Scholar] [CrossRef]
  6. Li, W.; Wang, M.-Y.; Liu, L.-Y.; Wang, H.-F.; Yu, S. Groundwater heavy metal levels and associated human health risk in the North China Plain. Arab. J. Geosci. 2015, 8, 10389–10398. [Google Scholar] [CrossRef]
  7. Díaz-Alcaide, S.; Martínez-Santos, P. Review: Advances in groundwater potential mapping. Hydrogeol. J. 2019, 27, 2307–2324. [Google Scholar] [CrossRef]
  8. Satheeskumar, V.; Subramani, T.; Lakshumanan, C.; Roy, P.D.; Karunanidhi, D. Groundwater chemistry and demarcation of seawater intrusion zones in the Thamirabarani delta of south India based on geochemical signatures. Environ. Geochem. Health 2020. [Google Scholar] [CrossRef]
  9. Li, J.; Wang, Y.; Zhu, C.; Xue, X.; Qian, K.; Xie, X.; Wang, Y. Hydrogeochemical processes controlling the mobilization and enrichment of fluoride in groundwater of the North China Plain. Sci. Total Environ. 2020, 730, 138877. [Google Scholar] [CrossRef]
  10. Gu, X.; Xiao, Y.; Yin, S.; Pan, X.; Niu, Y.; Shao, J.; Cui, Y.; Zhang, Q.; Hao, Q. Natural and anthropogenic factors affecting the shallow groundwater quality in a typical irrigation area with reclaimed water, North China Plain. Environ. Monit. Assess. 2017, 189, 1–12. [Google Scholar] [CrossRef]
  11. Eslami, F.; Yaghmaeian, K.; Mohammadi, A.; Salari, M.; Faraji, M. An integrated evaluation of groundwater quality using drinking water quality indices and hydrochemical characteristics: A case study in Jiroft, Iran. Environ. Earth Sci. 2019, 78, 314. [Google Scholar] [CrossRef]
  12. Zhao, L.; Li, Y.; Jiang, F.; Wang, H.; Ren, S.; Liu, Y.; Ouyang, Z. Comparative advantage for the areas irrigated with underground blue water in North China Plain. Water Policy 2015, 17, 1033–1044. [Google Scholar] [CrossRef] [Green Version]
  13. Foster, S.; Garduno, H.; Evans, R.; Olson, D.; Tian, Y.; Zhang, W.; Han, Z. Quaternary Aquifer of the North China Plain—assessing and achieving groundwater resource sustainability. Hydrogeol. J. 2004, 12, 81–93. [Google Scholar] [CrossRef]
  14. Qiu, G.Y.; Zhang, X.; Yu, X.; Zou, Z. The increasing effects in energy and GHG emission caused by groundwater level declines in North China’s main food production plain. Agric. Water Manag. 2018, 203, 138–150. [Google Scholar] [CrossRef]
  15. Shao, J.; Cui, Y.; Hao, Q.; Han, Z.; Cheng, T. Study on the estimation of groundwater withdrawals based on groundwater flow modeling and its application in the North China Plain. J. Earth Sci. 2014, 25, 1033–1042. [Google Scholar] [CrossRef]
  16. Zhao, Q.; Zhang, B.; Yao, Y.; Wu, W.; Meng, G.; Chen, Q. Geodetic and hydrological measurements reveal the recent acceleration of groundwater depletion in North China Plain. J. Hydrol. 2019, 575, 1065–1072. [Google Scholar] [CrossRef]
  17. Pang, Y.; Zhang, H.; Cheng, H.; Shi, Y.; Fang, C.; Luan, X.; Chen, S.; Li, Y.; Hao, M. The modulation of groundwater exploitation on crustal stress in the North China Plain, and its implications on seismicity. J. Asian Earth Sci. 2020, 189, 104141. [Google Scholar] [CrossRef]
  18. Feng, W.; Zhong, M.; Lemoine, J.-M.; Biancale, R.; Hsu, H.-T.; Xia, J. Evaluation of groundwater depletion in North China using the Gravity Recovery and Climate Experiment (GRACE) data and ground-based measurements. Water Resour. Res. 2013, 49, 2110–2118. [Google Scholar] [CrossRef]
  19. Wang, S.; Song, X.; Wang, Q.; Xiao, G.; Liu, C.; Liu, J. Shallow groundwater dynamics in North China Plain. J. Geogr. Sci. 2009, 19, 175–188. [Google Scholar] [CrossRef] [Green Version]
  20. Alley, W.M. Flow and Storage in Groundwater Systems. Science 2002, 296, 1985–1990. [Google Scholar] [CrossRef] [Green Version]
  21. Li, P.; Ren, L. Evaluating the effects of limited irrigation on crop water productivity and reducing deep groundwater exploitation in the North China Plain using an agro-hydrological model: II. Scenario simulation and analysis. J. Hydrol. 2019, 574, 715–732. [Google Scholar] [CrossRef]
  22. Su, C.; Cheng, Z.; Wei, W.; Chen, Z. Assessing groundwater availability and the response of the groundwater system to intensive exploitation in the North China Plain by analysis of long-term isotopic tracer data. Hydrogeol. J. 2018, 26, 1401–1415. [Google Scholar] [CrossRef]
  23. Cheng, Z.; Zhang, Y.; Su, C.; Chen, Z. Chemical and isotopic response to intensive groundwater abstraction and its implications on aquifer sustainability in Shijiazhuang, China. J. Earth Sci. 2017, 28, 523–534. [Google Scholar] [CrossRef]
  24. Xiao, Y.; Gu, X.; Yin, S.; Pan, X.; Shao, J.; Cui, Y. Investigation of Geochemical Characteristics and Controlling Processes of Groundwater in a Typical Long-Term Reclaimed Water Use Area. Water 2017, 9, 800. [Google Scholar] [CrossRef] [Green Version]
  25. Gu, X.; Xiao, Y.; Yin, S.; Hao, Q.; Liu, H.; Hao, Z.; Meng, G.; Pei, Q.; Yan, H. Hydrogeochemical Characterization and Quality Assessment of Groundwater in a Long-Term Reclaimed Water Irrigation Area, North China Plain. Water 2018, 10, 1209. [Google Scholar] [CrossRef] [Green Version]
  26. Yin, S.; Gu, X.; Xiao, Y.; Wu, W.; Pan, X.; Shao, J.; Zhang, Q. Geostatistics-based spatial variation characteristics of groundwater levels in a wastewater irrigation area, northern China. Water Supply 2017, 17, 1479–1489. [Google Scholar] [CrossRef]
  27. Matsumoto, T.; Chen, Z.; Wei, W.; Yang, G.-M.; Hu, S.-M.; Zhang, X. Application of combined 81Kr and 4He chronometers to the dating of old groundwater in a tectonically active region of the North China Plain. Earth Planet. Sci. Lett. 2018, 493, 208–217. [Google Scholar] [CrossRef]
  28. Zhan, Y.; Guo, H.; Wang, Y.; Li, R.; Hou, C.; Shao, J.; Cui, Y. Evolution of groundwater major components in the Hebei Plain: Evidences from 30-year monitoring data. J. Earth Sci. 2014, 25, 563–574. [Google Scholar] [CrossRef]
  29. Chen, J.; Tang, C.; Yu, J. Use of 18O, 2H and 15N to identify nitrate contamination of groundwater in a wastewater irrigated field near the city of Shijiazhuang, China. J. Hydrol. 2006, 326, 367–378. [Google Scholar] [CrossRef]
  30. Li, J.; Zhou, H.; Qian, K.; Xie, X.; Xue, X.; Yang, Y.; Wang, Y. Fluoride and iodine enrichment in groundwater of North China Plain: Evidences from speciation analysis and geochemical modeling. Sci. Total Environ. 2017, 598, 239–248. [Google Scholar] [CrossRef]
  31. Li, Y.; Zhang, Z.; Fei, Y.; Chen, H.; Qian, Y.; Dun, Y. Investigation of quality and pollution characteristics of groundwater in the Hutuo River Alluvial Plain, North China Plain. Environ. Earth Sci. 2016, 75, 1–10. [Google Scholar] [CrossRef]
  32. Ma, R.; Shi, J.; Liu, J.; Gui, C. Combined use of multivariate statistical analysis and hydrochemical analysis for groundwater quality evolution: A case study in north chain plain. J. Earth Sci. 2014, 25, 587–597. [Google Scholar] [CrossRef]
  33. Zhang, Q.; Wang, H.; Wang, Y.; Yang, M.; Zhu, L. Groundwater quality assessment and pollution source apportionment in an intensely exploited region of northern China. Environ. Sci. Pollut. Res. 2017, 24, 16639–16650. [Google Scholar] [CrossRef] [PubMed]
  34. Zhang, Y.; Wu, Y.; Sun, J.; Hu, S.; Xiang, X. Controls on the spatial distribution of iodine in groundwater in the Hebei Plain, China. Environ. Sci. Pollut. Res. 2018, 25, 16702–16709. [Google Scholar] [CrossRef]
  35. Liu, H.; Guo, H.; Yang, L.; Wu, L.; Li, F.; Li, S.; Ni, P.; Liang, X. Occurrence and formation of high fluoride groundwater in the Hengshui area of the North China Plain. Environ. Earth Sci. 2015, 74, 2329–2340. [Google Scholar] [CrossRef]
  36. Zhi, C.; Chen, H.; Li, P.; Ma, C.; Zhang, J.; Zhang, C.; Wang, C.; Yue, X. Spatial distribution of arsenic along groundwater flow path in Chaobai River alluvial–proluvial fan, North China Plain. Environ. Earth Sci. 2019, 78, 259. [Google Scholar] [CrossRef]
  37. Zhou, J.; Zhang, Y.; Zhou, A.; Liu, C.; Cai, H.; Liu, Y. Application of hydrochemistry and stable isotopes (δ34S, δ18O and δ37Cl) to trace natural and anthropogenic influences on the quality of groundwater in the piedmont region, Shijiazhuang, China. Appl. Geochem. 2016, 71, 63–72. [Google Scholar] [CrossRef]
  38. Yan, M.; Wang, Q.; Tian, Y.; Wang, J.; Nie, Z.; Zhang, G. The dynamics and origin of groundwater salinity in the northeast Hufu Plain. Environ. Earth Sci. 2016, 75, 1154. [Google Scholar] [CrossRef]
  39. Zhou, Z.; Zhang, G.; Yan, M.; Wang, J. Spatial variability of the shallow groundwater level and its chemistry characteristics in the low plain around the Bohai Sea, North China. Environ. Monit. Assess. 2012, 184, 3697–3710. [Google Scholar] [CrossRef]
  40. Zhang, X.; He, J.; He, B.; Sun, J. Assessment, formation mechanism, and different source contributions of dissolved salt pollution in the shallow groundwater of Hutuo River alluvial-pluvial fan in the North China Plain. Environ. Sci. Pollut. Res. 2019, 26, 35742–35756. [Google Scholar] [CrossRef]
  41. Yin, S.; Xiao, Y.; Gu, X.; Hao, Q.; Liu, H.; Hao, Z.; Meng, G.; Pan, X.; Pei, Q. Geostatistical analysis of hydrochemical variations and nitrate pollution causes of groundwater in an alluvial fan plain. Acta Geophys. 2019, 67, 1191–1203. [Google Scholar] [CrossRef]
  42. Lu, Y.; Tang, C.; Chen, J.; Song, X.; Li, F.; Sakura, Y. Spatial characteristics of water quality, stable isotopes and tritium associated with groundwater flow in the Hutuo River alluvial fan plain of the North China Plain. Hydrogeol. J. 2008, 16, 1003–1015. [Google Scholar] [CrossRef]
  43. Zhou, Y.; Li, P.; Xue, L.; Dong, Z.; Li, D. Solute geochemistry and groundwater quality for drinking and irrigation purposes: A case study in Xinle City, North China. Geochemistry 2020, 125609. [Google Scholar] [CrossRef]
  44. Wang, S.; Song, X.; Wang, Q.; Xiao, G.; Wang, Z.; Liu, X.; Wang, P. Shallow groundwater dynamics and origin of salinity at two sites in salinated and water-deficient region of North China Plain, China. Environ. Earth Sci. 2012, 66, 729–739. [Google Scholar] [CrossRef]
  45. Liu, H.; Guo, H.; Xing, L.; Zhan, Y.; Li, F.; Shao, J.; Niu, H.; Liang, X.; Li, C. Geochemical behaviors of rare earth elements in groundwater along a flow path in the North China Plain. J. Asian Earth Sci. 2016, 117, 33–51. [Google Scholar] [CrossRef]
  46. Gao, Y.; Qian, H.; Ren, W.; Wang, H.; Liu, F.; Yang, F. Hydrogeochemical characterization and quality assessment of groundwater based on integrated-weight water quality index in a concentrated urban area. J. Clean. Prod. 2020, 260, 121006. [Google Scholar] [CrossRef]
  47. Kamrani, S.; Rezaei, M.; Amiri, V.; Saberinasr, A. Investigating the efficiency of information entropy and fuzzy theories to classification of groundwater samples for drinking purposes: Lenjanat Plain, Central Iran. Environ. Earth Sci. 2016, 75, 1370. [Google Scholar] [CrossRef]
  48. Singh, K.R.; Dutta, R.; Kalamdhad, A.S.; Kumar, B. An investigation on water quality variability and identification of ideal monitoring locations by using entropy based disorder indices. Sci. Total Environ. 2019, 647, 1444–1455. [Google Scholar] [CrossRef]
  49. USEPA. Risk assessment guidance for Superfund. In Human Health Evaluation Manual (Part A), Interim Final (EPA/540/1--89/002); Office of Emergency and Remedial Response U.S. Environmental Protection Agency: Washington, DC, USA, 1989; Volume 1, p. 20450. [Google Scholar]
  50. Yin, S.; Xiao, Y.; Han, P.; Hao, Q.; Gu, X.; Men, B.; Huang, L. Investigation of Groundwater Contamination and Health Implications in a Typical Semiarid Basin of North China. Water 2020, 12, 1137. [Google Scholar] [CrossRef] [Green Version]
  51. Xiao, Y.; Yin, S.; Hao, Q.; Gu, X.; Pei, Q.; Zhang, Y. Hydrogeochemical appraisal of groundwater quality and health risk in a near-suburb area of North China. J. Water Supply Res. Technol. Aqua 2020, 55–69. [Google Scholar] [CrossRef]
  52. USEPA. User’s Guide: Human Health Risk Assessment; United States Environmental Protection Agency: Washington, DC, USA, 2008. [Google Scholar]
  53. Zhang, Y.; Wu, J.; Xu, B. Human health risk assessment of groundwater nitrogen pollution in Jinghui canal irrigation area of the loess region, northwest China. Environ. Earth Sci. 2018, 77, 1–12. [Google Scholar] [CrossRef]
  54. Zhai, Y.; Lei, Y.; Wu, J.; Teng, Y.; Wang, J.; Zhao, X.; Pan, X. Does the groundwater nitrate pollution in China pose a risk to human health? A critical review of published data. Environ. Sci. Pollut. Res. 2017, 24, 3640–3653. [Google Scholar] [CrossRef] [PubMed]
  55. Supervision, G.A.O.Q. Standards for Groundwater Quality (GB/T 14848-2017); Standards Press of China: Beijing, China, 2017. (In Chinese) [Google Scholar]
  56. World Health Organization. Guidelines for Drinking-Water Quality, 4th ed.; World Health Organization: Geneva, Switzerland, 2011. [Google Scholar]
  57. Xiao, J.; Wang, L.; Deng, L.; Jin, Z. Characteristics, sources, water quality and health risk assessment of trace elements in river water and well water in the Chinese Loess Plateau. Sci. Total Environ. 2019, 650, 2004–2012. [Google Scholar] [CrossRef]
  58. Gaillardet, J.; Dupré, B.; Louvat, P.; Allègre, C.J. Global silicate weathering and CO2 consumption rates deduced from the chemistry of large rivers. Chem. Geol. 1999, 159, 3–30. [Google Scholar] [CrossRef]
Figure 1. Location of (a) the North China Plain, (b) the study area and (c) groundwater sampling sites.
Water 12 03052 g001
Figure 2. Hydrogeological section along the A-A’ in the study area.
Water 12 03052 g002
Figure 3. Scatter plots of TH versus TDS demonstrating groundwater quality.
Water 12 03052 g003
Figure 4. Piper trilinear diagram for groundwater samples.
Water 12 03052 g004
Figure 5. Scatter plot of the TDS versus entropy-weighted water quality index (EWQI) of groundwater.
Water 12 03052 g005
Figure 6. Spatial distribution of the confined groundwater quality rank based on the EWQI.
Water 12 03052 g006
Figure 7. Spatial distribution of the overall potential noncarcinogenic health risks through drinking pathway for (a) infants, (b) children, (c) adult females, and (d) adult males.
Water 12 03052 g007
Figure 8. Spatial distribution of (a) TDS, (b) TH, (c) Ca2+, (d) Mg2+, (e) Na+, (f) Cl, (g) SO42−, (h) NO2, (i) NH4+, (j) F, (k) Fe, and (l) Mn in groundwater.
Water 12 03052 g008
Figure 9. Box plots of (a) the overall non-carcinogenic health risk, and the hazard quotient of non-carcinogenic health risk due to (b) NO2, (c) NH4+, (d) F, (e) Fe, and (f) Mn.
Water 12 03052 g009
Figure 10. Gibbs diagrams demonstrating the mechanisms governing groundwater chemistry. (a) TDS versus Na+/(Na++Ca2+), (b) TDS versus Cl/(Cl+HCO3).
Water 12 03052 g010
Figure 11. Scatter plots of (a) Na+ versus Cl, (b) Ca2+ versus SO42−, (c) Ca2+ versus HCO3, (d) Ca2+ + Mg2+ versus HCO3, and (e) Ca2+ + Mg2+ versus HCO3 + SO42− of groundwater.
Water 12 03052 g011
Figure 12. Scatter plots of (a) (Mg2+/Na+) versus (Ca2+/Na+), and (b) (HCO3/Na+) versus (Ca2+/Na+).
Water 12 03052 g012
Figure 13. Scatter plots of (a) Na+ + K+− Cl versus Ca2+ + Mg 2+− HCO3 −SO42−, and (b) chloro−alkaline indices CAI–1 versus CAI–2.
Water 12 03052 g013
Figure 14. Saturation index of selected minerals in groundwater of the study area.
Water 12 03052 g014
Table 1. Classification criteria of water quality based on the EWQI.
RankEWQIWater Quality
1<50Excellent
250–100Good
3100–150Medium
4150–200Poor
5>200Extremely poor
Table 2. RfD and exposure parameters involved in the human health risk assessment.
CompositionRfDoralExposureValue
(mg/(kg × day))ParameterInfantsChildrenAdult FemalesAdult Males
NO20.1aIR (L/day)0.65d1.5d2.66d3.62d
F0.06bEF (days/year)365c365c365d365c
NH4+0.97aED (years)0.5d6d30d30d
Mn0.14cBW (kg)6.94d25.9d64.0d73.0d
Fe0.7c
a refer to [53]; b refer to [52]; c refer to [49]; d refer to [54].
Table 3. Statistical analyses of physicochemical parameters and drinking water standard.
IndexUnitMinMaxMeanSD *Guideline% of the Sample Exceeding the Guideline
T°C11.3028.3021.273.25/
pH/6.99.58.30.56.5–8.5 **33.90%
ECμS/cm71837501274590/
THmg/L22.52880.20120.04197.71450 **3.39%
TDSmg/L52227967864501000 **10.17%
K+mg/L0.0666.481.898.57/
Na+mg/L173.40598.90242.0383.84200 ****72.88%
Ca2+mg/L4.00159.0021.8930.7875 ***3.39%
Mg2+mg/L2.44142.0015.8730.0350 ***6.78%
Clmg/L97.13746.50185.34142.10250 **10.17%
SO42−mg/L98.70928.70197.91153.68250 **10.17%
HCO3mg/L106.40458.90196.0971.05/
NO3mg/L0.105.431.441.4350.0 ***
NO2mg/L0.0010.0360.0020.0050.02 **1.69%
NH4mg/L0.022.500.070.320.2 **1.69%
F-mg/L0.572.591.290.381.0 **77.97%
Znmg/L0.0010.4700.0320.0781.0 **
Mnmg/L0.00050.60900.05370.11100.1 **10.17%
Femg/L0.0011.801.042.180.3 **45.76%
Asmg/L0.00050.00700.00120.00100.01 **
* Standard Deviation; ** Chinese Guideline [55]; *** WHO Guideline [56]; **** refer to [53].
Table 4. Statistics of health risks assessment results through drinking water intake.
Population HQNO2HQNH4HQFHQMnHQFeHI
InfantsMin9.37 × 10−41.93 × 10−38.90 × 10−13.34 × 10−41.34 × 10−39.62 × 10−1
Max3.37 × 10−22.41 × 10−14.04 × 1004.07 × 10−11.58 × 1004.11 × 100
Mean1.67 × 10−36.42 × 10−32.01 × 1003.59 × 10−21.39 × 10−12.19 × 100
SD4.30 × 10−33.12 × 10−25.88 × 10−17.43 × 10−22.92 × 10−16.60 × 10⁻¹
ChildrenMin5.79 × 10−41.19 × 10−35.50 × 10−12.07 × 10−48.27 × 10−45.95 × 10−1
Max2.08 × 10−21.49 × 10−12.50 × 1002.52 × 10−19.76 × 10−12.54 × 100
Mean1.03 × 10−33.97 × 10−31.24 × 1002.22 × 10−28.57 × 10−21.35 × 100
SD2.66 × 10−31.93 × 10−23.63 × 10−14.59 × 10−21.80 × 10−14.08 × 10⁻¹
FemalesMin4.16 × 10−48.57 × 10−43.95 × 10−11.48 × 10−45.94 × 10−44.27 × 10−1
Max1.50 × 10−21.07 × 10−11.79 × 1001.81 × 10−17.01 × 10−11.82 × 100
Mean7.41 × 10−42.85 × 10−38.92 × 10−11.59 × 10−26.15 × 10−29.70 × 10⁻¹
SD1.91 × 10−31.38 × 10−22.61 × 10−13.30 × 10−21.30 × 10−12.93 × 10⁻¹
MalesMin4.96 × 10−41.02 × 10−34.71 × 10−11.77 × 10−47.08 × 10−45.09 × 10−1
Max1.79 × 10−21.28 × 10−12.14 × 1002.16 × 10−18.36 × 10−12.17 × 100
Mean8.84 × 10−43.40 × 10−31.06 × 1001.90 × 10−27.34 × 10−21.16 × 100
SD2.28 × 10−31.65 × 10−23.11 × 10−13.93 × 10−21.55 × 10−13.49 × 10⁻¹
Publisher’s Note: MDPI stays neutral with regard to jurisdictional claims in published maps and institutional affiliations.

