Article

Concentration–Discharge Relationships in Runoff Components during Rainfall Events at the Hydrohill Experimental Catchment in Chuzhou, China

1
College of Water Resource & Hydropower, Sichuan University, Chengdu 610065, China
2
State Key Laboratory of Hydrology-Water Resources and Hydraulic Engineering, Nanjing Hydraulic Research Institute, Nanjing 210029, China
3
Department of Ecosystem Science and Management, The Pennsylvania State University, University Park, PA 16802, USA
*
Author to whom correspondence should be addressed.
Water 2020, 12(11), 3033; https://doi.org/10.3390/w12113033
Submission received: 1 September 2020 / Revised: 22 October 2020 / Accepted: 26 October 2020 / Published: 29 October 2020
(This article belongs to the Section Hydrology)

Abstract

:
Concentration–discharge (C-Q) relationships are a convenient and increasingly popular tool for interpreting the episodic hydrochemical response to the varying discharge in small basins, providing insights into solute transport and streamflow generation. While most studies are focused on total runoff, this study quantified C-Q relationships in four runoff components during precipitation events at the Hydrohill experimental catchment in Chuzhou, China. This unique artificial catchment is carefully engineered, allowing observations of the interacting runoff components that collectively determine total flow issuing from the catchment. The four runoff components, or flow paths, include surface runoff (SR), shallow interflow at 0–30 cm depth (SSR30), deeper interflow at 30–60 cm depth (SSR60), and groundwater flow at 60–100 cm depth (SSR100). Water samples were collected during three consecutive precipitation events to study how the concentrations of primary solutes vary with flow. Analysis of C-Q relationships reveals that concentrations of Na+, Ca2+, Mg2+, SO42−, and HCO3 in the four runoff components had a negative relationship with discharge, while the concentration of K+ and Cl were negatively correlated with discharge in SR and SSR30 but positively correlated in SSR60 and SSR100. Further insights were gained from principal component analysis. Three eigenvectors explained 92% of the variability in hydrochemistry in surface runoff, while two eigenvectors explained most of the variability in the hydrochemistry of subsurface flows observed at various depths in the soil profile (73% for SSR30, 79% for SSR60, and 76% for SSR100). PC1 (the first Principal Component) can be interpreted as a salinity factor, deriving from carbonate minerals such as dolomites and limestone minerals. Results indicated that leaching and dilution processes, water–soil interaction, and macropore flows in soils are the primary factors controlling the C-Q relationships. Our work sheds light on the coupled processes and streamflow generation mechanisms that control water quality at the catchment scale.

1. Introduction

Concentration–discharge (C-Q) relationships are an increasingly popular tool for interpreting episodic hydrochemical responses to the varying discharge in small catchments [1,2,3]. Solutes show different responses to the changing discharge with the origin, reactivity, and physical phase of materials influencing the C-Q relationship [1,4,5]. Studies investigating C-Q relationships across many catchments have shown that the behavior within the watershed is influenced by flushing or concentrating effects of lithologic solutes [6,7,8]. The solutes can be generated at relatively fixed rates in the regolith by chemical weathering processes [9,10]. Storm events provide opportunities to mobilize and transport these solutes. Describing and quantifying hydrological and geochemical responses to storm events, in turn, improves the understanding of the processes underlying solute and particulate export to catchment outlets [11]. The concentrations of most dissolved species in runoff decline during periods of high discharge, while a few increases in concentration or are unchanged.
Many researchers have studied patterns of C-Q relationships, which vary across different catchments and among different storms [12,13,14,15]. The C-Q relationships for single or long-term time series storm events showed the characteristics of solute/particulate changes (dilution or concentrating) with various flows [13], which can be quantified as linear and nonlinear C-Q regression relationships on logarithmic axes [4]. The results can be seen from the slope, from which the relationships can be divided into two patterns: chemostatic and chemodynamic, with either dilution or concentration pattern due to the complex hydrochemical variability. When the concentrations of many solutes and particulates with an abundant source of chemicals in the catchment are stable over a large range of flows, a chemostatic C-Q pattern can be defined [14], e.g., weathering bedrock [4,15,16] or agricultural soils and the unsaturated zone [17,18]. When the rate of the concentration change is larger than the flow change, a chemodynamic C-Q pattern and source-limitation are observed with either concentration increasing (concentration) or decreasing (dilution).
Commonly used methods for studying hydrochemistry include correlation analysis, cluster analysis, factor analysis, and principal component analysis (PCA). Among the different methods, PCA is a multivariate statistical method that extracts important information hidden in the large-scale original data group and grasps the main characteristics of the system, thereby simplifying the number of original variables, and achieving the effect of effectively revealing the essence of the original information. PCA has frequently been used as a useful tool to explore the hydrogeochemical processes of surface water and groundwater, particularly in studies related to salinization, pollution sources, and flow paths [19,20,21,22,23]. However, most previous studies are focused on C-Q relationships in total streamflow observed at the catchment outlet, while the subsurface runoff components are not investigated explicitly. There is a necessity to study the relationship of C-Q in various runoff components, especially flows issuing from the vadose zone which are not commonly measured.
In this study, C-Q relationships are quantified in four runoff components during precipitation events at the Hydrohill experimental catchment in Chuzhou, China. A concentration–discharge (C-Q) analysis approach was used to quantify relationships between discharge and the concentrations of cations (K+, Na+, Ca2+, and Mg2+) and anions (Cl, SO42−, and HCO3) in various runoff components contributing to total flow during three consecutive storm events. Further, a PCA approach was used to investigate the hydrogeochemical formations in different runoff processes. These analyses help to elucidate the coupled processes and streamflow generation mechanisms that control water quality at the catchment outlet.

2. Materials and Methods

2.1. Study Site

This study was carried out at the Hydrohill experimental catchment (32°12′25″ N, 118°12′21″ E), located in the city of Chuzhou in the Anhui Province of southeastern China (Figure 1a). The basin has a drainage area of 490 m2, and is situated on a small andesitic hill. The rainfall is unevenly distributed during the year, and the wet seasons mainly include June, July, and August, accounting for almost 49% of the annual rainfall. The mean annual precipitation is 1060 mm, and the average annual temperature is 14.9 °C. This unique artificial catchment is carefully engineered, allowing observations of the interacting runoff components that collectively determine total flow issuing from the catchment. Two intersecting slopes inclined at 10° were at the bottom of this catchment and the overall downslope gradient is 16.9°. Impermeable concrete walls were built to enclose the catchment on all sides so that they can prevent any flow of water across the catchment boundaries (Figure 1b).
In preparing the artificial catchment for investigations of hydrological processes, the silt-loam soil removed before excavation was put back to a depth of approximately 1 m. A central drainage trench was constructed at the intersection of the two slopes after three years of soil subsidence and then measuring facilities were installed (Figure 2). Five stainless-steel troughs were installed longitudinally in the trench at the center of the Hydrohill and each trough extends horizontally into the soil layer to prevent leakage between layers (Figure 2). The troughs from the top-down collect precipitation, surface runoff (SR), and subsurface flow from soil layers with the depths of 0–30, 30–60, and 60–100 cm (noted as SSR30, SSR60, and SSR100 troughs) (Figure 2). In general, runoff collected from SSR30 is the interflow from the unsaturated zone, but that from SSR60 will depend on the comparison between the groundwater table and the height of trough SSR60 at the catchment. When the saturated zone table (plus its capillary fringe) is lower than the trough, then the runoff measured in SSR60 is the interflow from the unsaturated zone; otherwise, it is the groundwater flow from the saturated zone. The runoff component measured from trough SSR100 (i.e., from the saturated zone) was the groundwater flow (note that our study catchment does not have a permanent water table, so the groundwater here refers to transient saturated flow) [24,25].

2.2. Data Collection and Sample Analysis

Precipitation is evenly distributed in the catchment, and thus rainfall data can be collected from any of the rain gauges located inside the catchment (see Figure 2). The discharge data for SR, SSR30, SSR60, and SSR100 can be measured by the five 90° sharp-crested V-notch weirs and logarithmic weirs at the outlet, and continuous measurements were taken by using pressure type stage recorders. 125 samples were collected at the catchment outlet from 25 October 23:00 to 28 October 23:00 in 2016. This whole process contained three rainfall events, and the rainfall amounts for each event were 54, 63, and 33 mm, respectively. Water samples of all four runoff components were collected, including rainwater samples, surface water samples, and subsurface water samples. Rainfall samples were collected with a one-hour interval through a rainfall water collector with a diameter of 40 cm located on the observation room roof. Surface runoff and subsurface runoff in the troughs are routed through V-notch logarithm weirs and the water samples can be collected by using the section negative pressure sampling system located in a gauging room (Figure 2), which is right below the catchment. Discharge is continuously monitored, and when there were typical points like peak points, valley points, and inflection points on the hydrograph, the water samples were collected at that time.
All samples were analyzed by Inductively Coupled Plasma Optical Emission Spectrometry (ICP-OEC) for major cations (K+, Na+, Ca2+, Mg2+), and Dionex ICS-2100 Ion Chromatography for anions (Cl and SO42−). Concentrations of HCO3 were determined in each sample by a titration assay on-site. Hydrochemistry of all water samples was analyzed within two weeks after collection.

2.3. Principal Component Analysis

To help further interpret large and complex sets of observational data on variations in water quality, the dataset was treated using PCA to reduce the dimension of the multivariate data and provide new insights into the factors controlling variation in water quality. PCA is designed to transform the original variables into new, uncorrelated variables (axes), referred to as the principal components, which are linear combinations of the original variables established via eigendecomposition [26,27]. PCA is concerned with establishing which linear component exists within the data and how a particular variable might contribute to that component [27]. Principal components (PCs) are the number of factors that can be defined by following the criterion of only PCs accounting for variances with eigenvalues ≥ 1 [27]. The principal components can be expressed per the equation below, where Z is the component score, a is the component loading, x is the measured value of a variable, i is the component number, j is the sample number, and m is the total number of variables.
Zij = ai1 × 1j + ai1 × 1j + ai1 × 1j + ⋯⋯ aim × mj
The cation and anion concentrations that were measured from our water samples (as described above) were used as variables in the PCA analysis. Before using hydrochemical data in PCA, the units for each chemical species were converted from mg/L to μeq/L (micro equivalents per liter), following methods by Hem [28]. The values of different variables were normalized before conducting PCA, using SPSS software, version 20.

3. Results

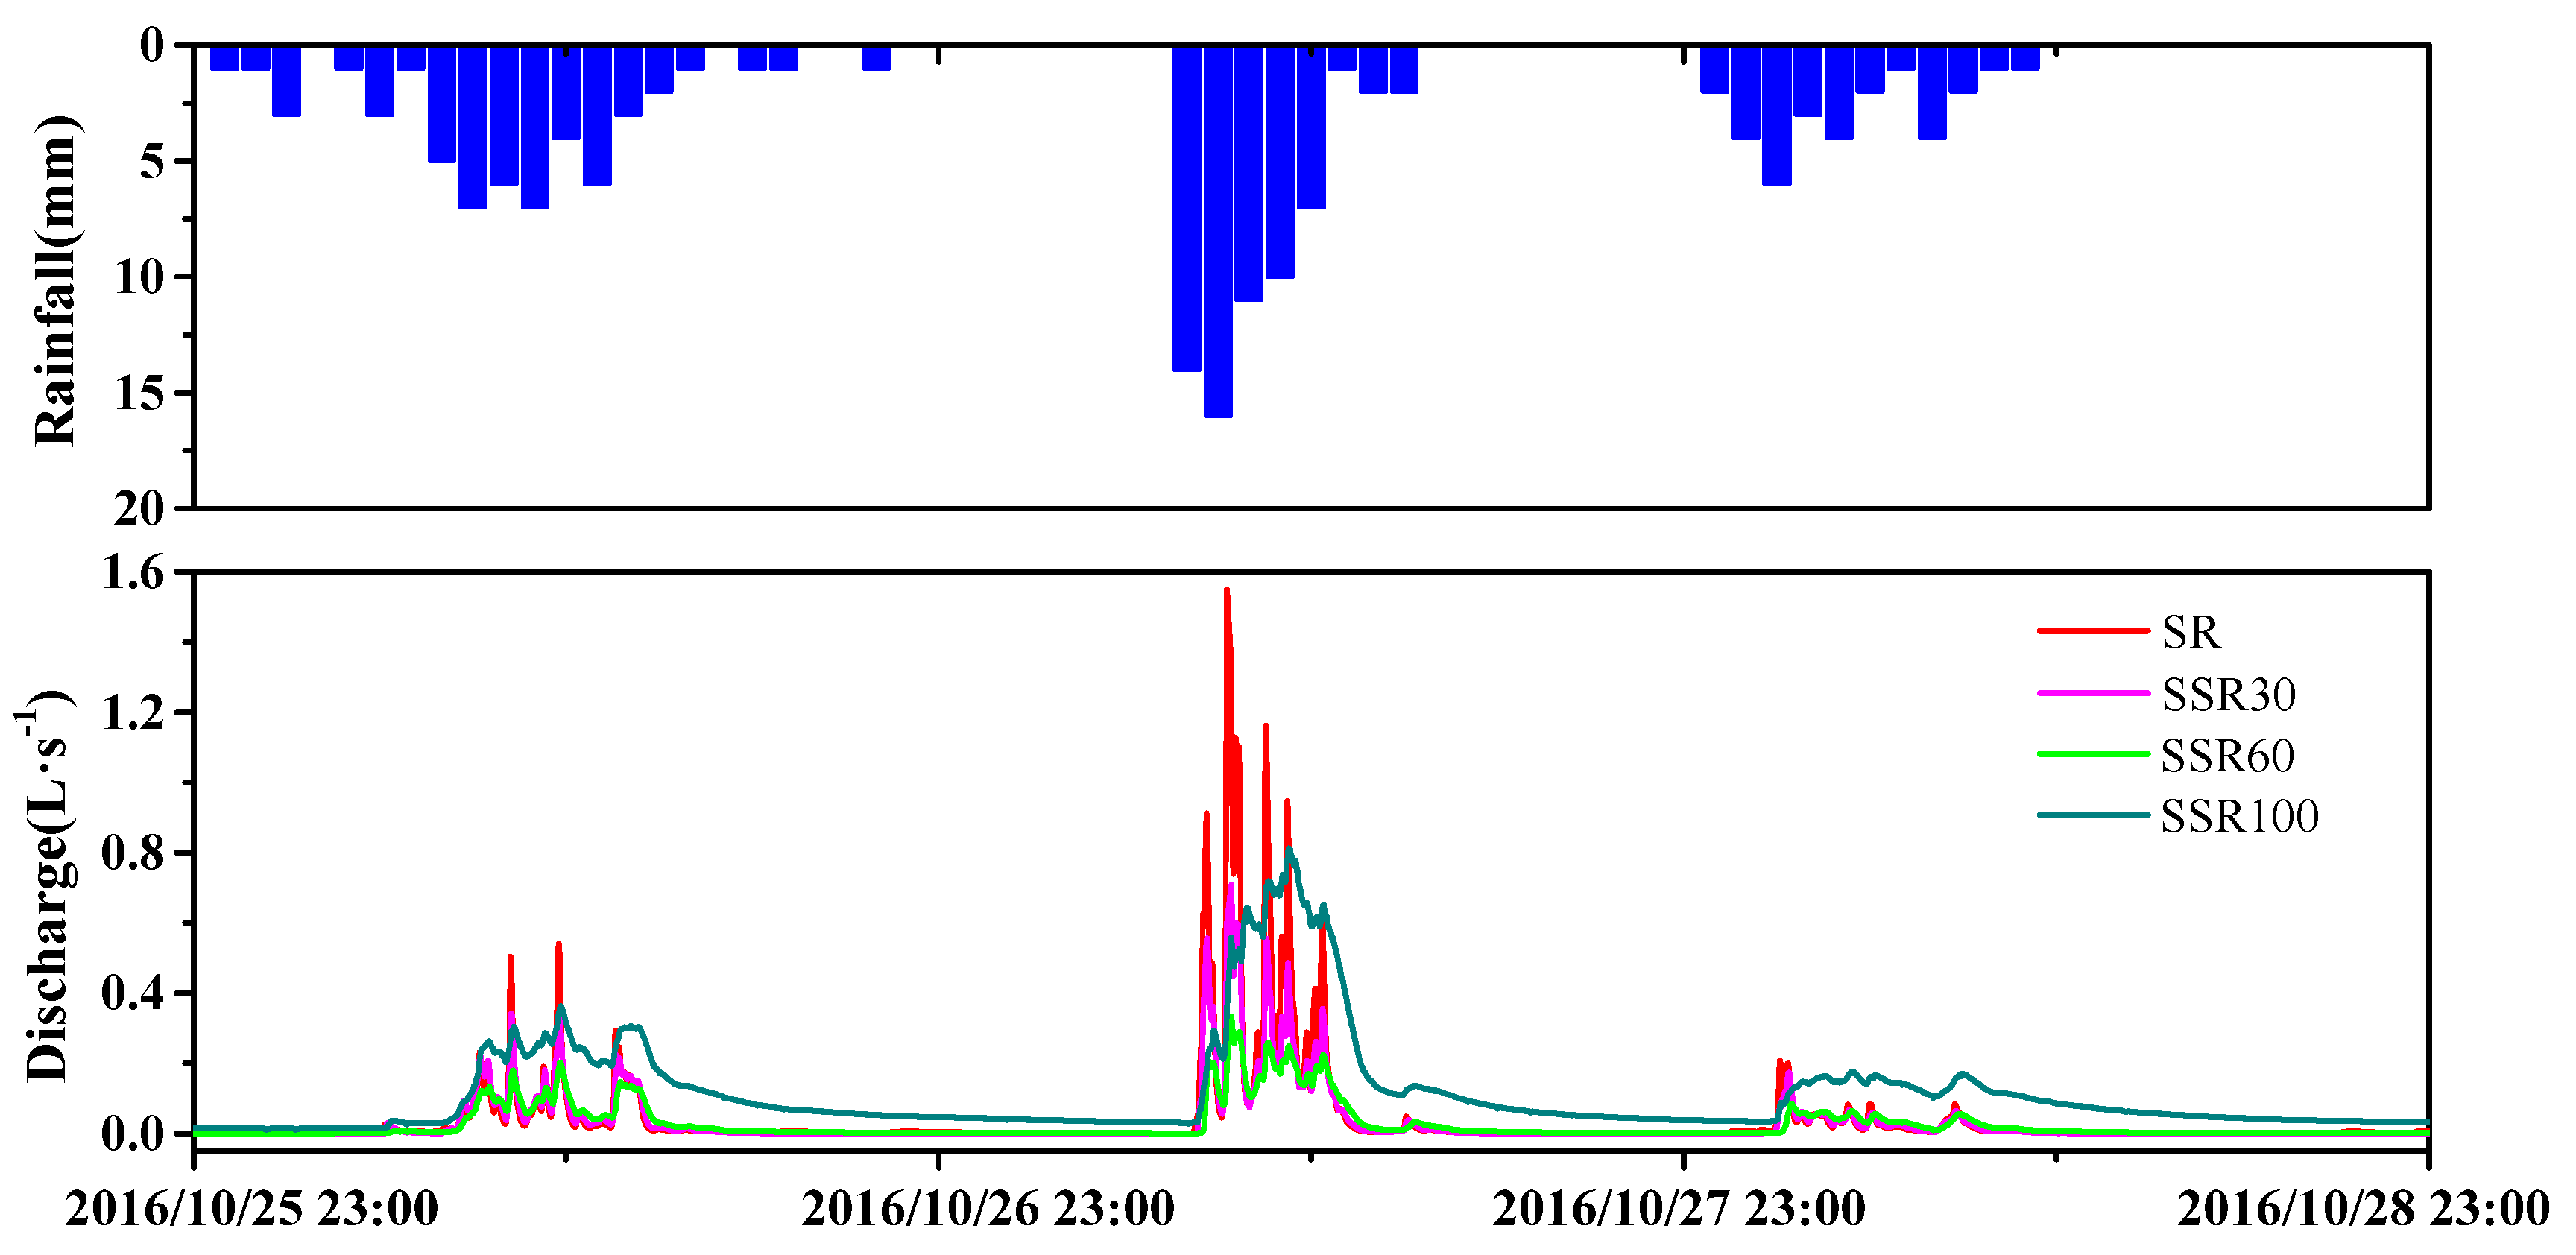
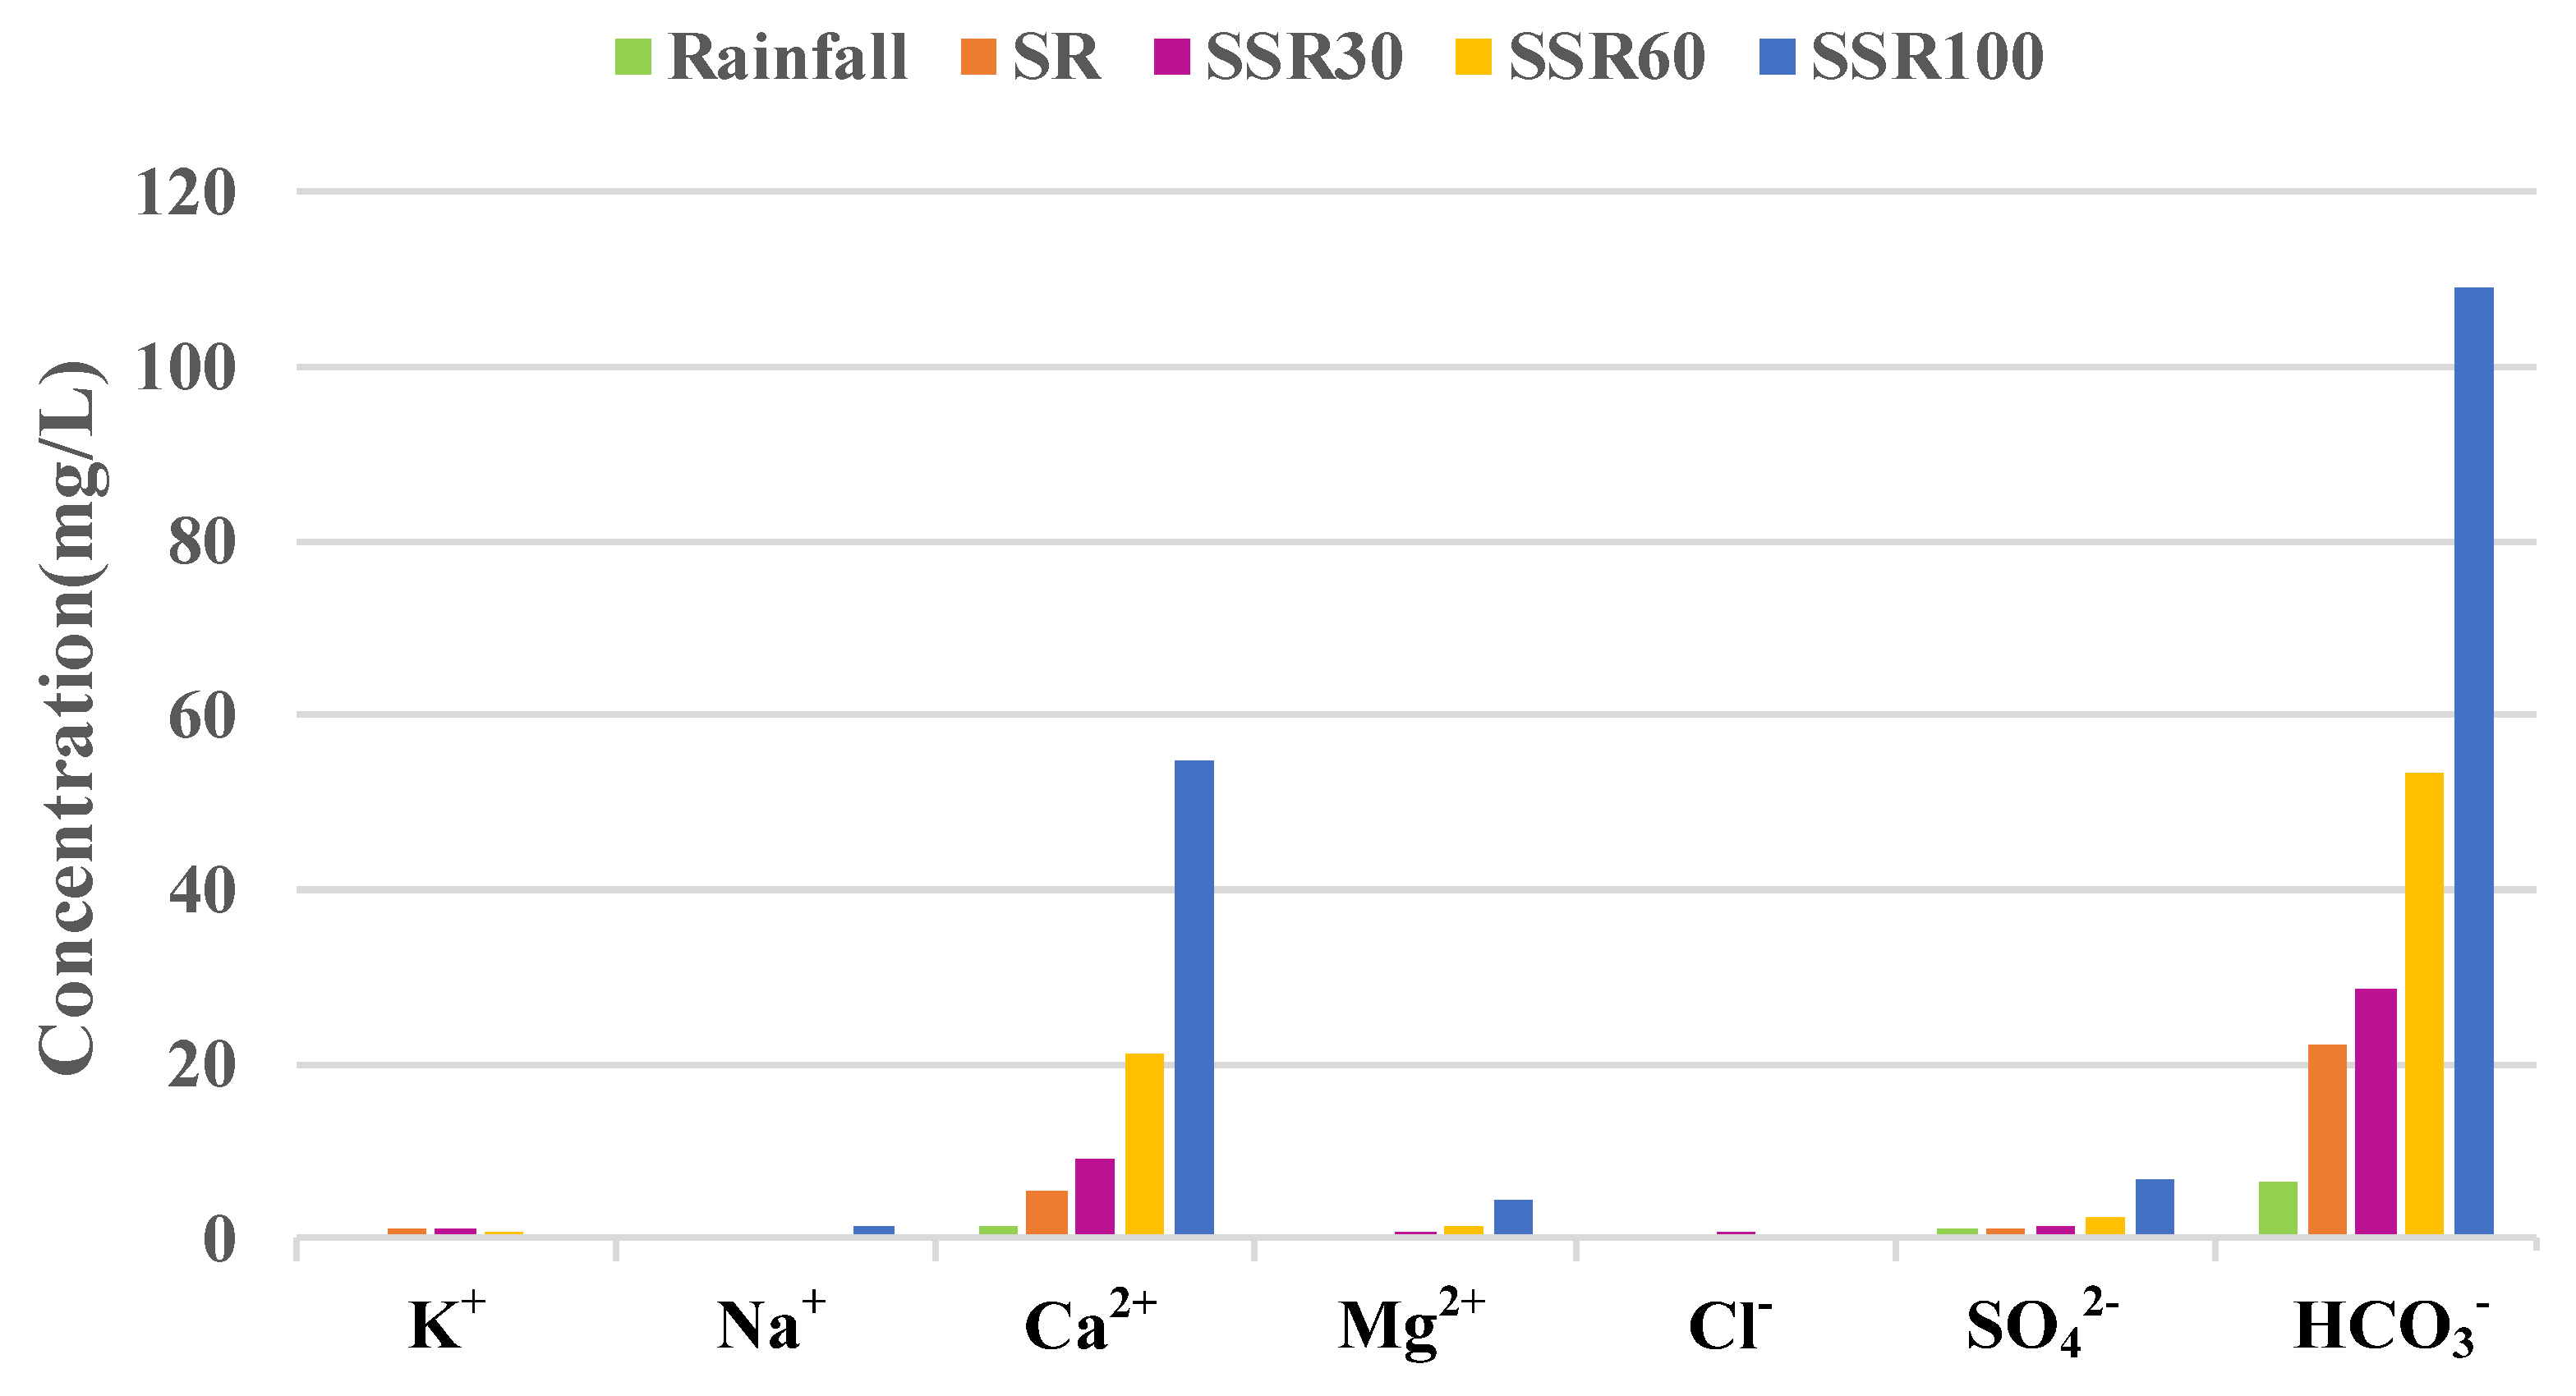
3.1. Hydrological Processes

Hydrologically, the discharge hydrograph responded to precipitation occurring from 25 to 28 October 2016 (Figure 3). The rainfall events occurring during this period accounted for a high proportion of the total annual precipitation amount in 2016. The runoff coefficient (rainfall/runoff ratios) for these three consecutive events were 0.63, 0.88, and 0.97, respectively.

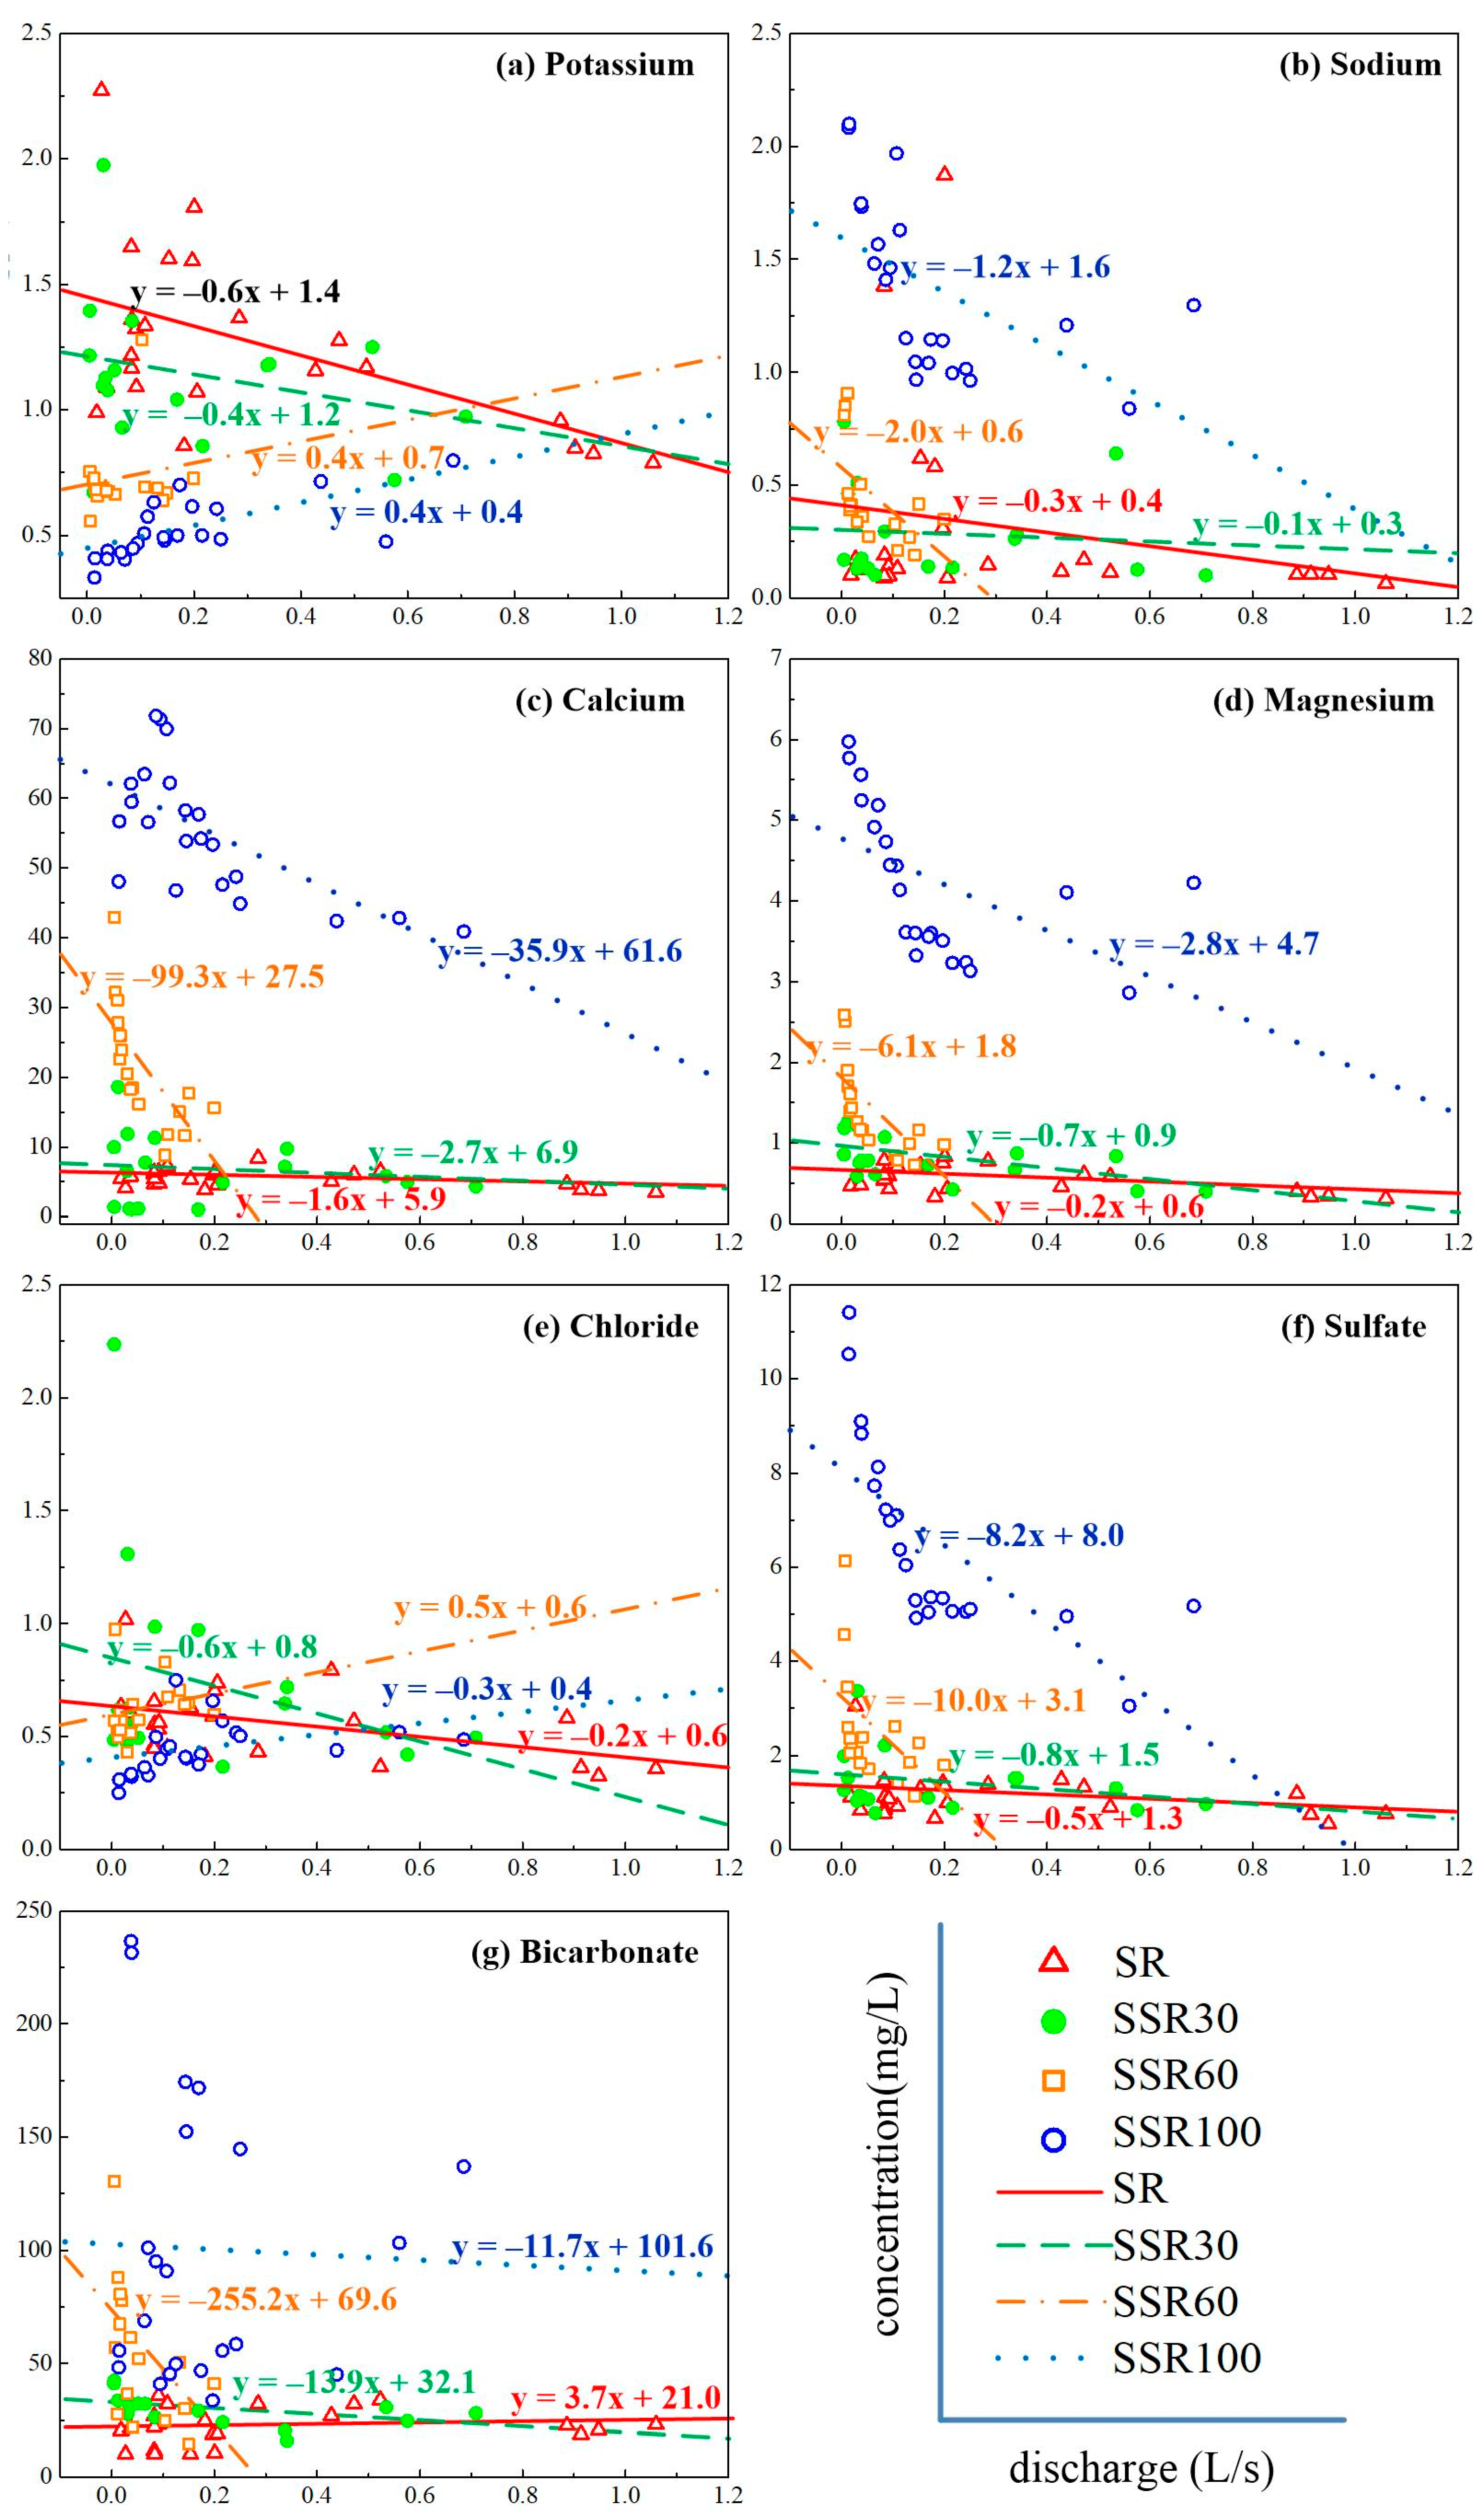
3.2. Concentration–Discharge Relationships

Changes in hydrological flows during the rainfall period had important impacts on the hydrochemical responses of each runoff pathway (Figure 4). Concentration values of Ca2+, Mg2+, SO42−, and HCO3 increased with depth in the soil profile, from lowest in rainfall to highest in the deepest flow path. Specifically, this value sequence was SSR100 > SSR60 > SSR30 > SR > rainfall. Concentrations of Ca2+ ranged from 1.48 to 54.83 mg/L, Mg2+ ranged from 0.18 to 4.33 mg/L, SO42− ranged from 1.15 to 6.81 mg/L, and HCO3 ranged from 6.59 to 109.10 mg/L. There is no regular pattern for the remaining constituents (K+, Na+, and Cl). The highest concentration values for K+ and Cl were observed in SSR30. The value for Na+ was larger in rainfall than in SR and SSR30, though the highest concentration value of Na+ was still in the deepest flow path, SSR100. Further information about the basic characteristics of ions is presented in several previous studies about the hydrochemistry in Hydrohill catchment [29,30], though this is the first study to focus on the C-Q relationship in runoff components.
Analysis of C-Q relationships reveals that concentrations of Na+, Ca2+, Mg2+, SO42−, and HCO3 in the four runoff components had a negative relationship with discharge (Figure 5). Concentrations of K+ and Cl and discharge were negatively correlated in SR and SSR30 but were positively correlated in SSR60 and SSR100. Thus, all the analyzed species in SR and SSR30 declined with the increasing discharge, suggesting that they are sensitive to rainfall composition when they are mixed in the surface runoff and 0~30 cm interflow. In the C-Q plots, the steeper (more negative) the slope, the more rapid the concentrations have changed with increasing discharge (Figure 5). For example, Ca2+ concentrations in SSR60 and SSR100, Mg2+ in SSR60 and SSR100, SO42− in SSR60 and SSR100, and HCO3 in SSR60 have much more negative slopes than other constituents, and their concentrations declined very quickly. The slopes for Ca2+ in SSR60 and SSR100 are −35.8 and −99.3, Mg2+ in SSR60 and SSR100 are −2.8 and −6.1, SO42− in SSR60 and SSR100 are −8.1 and −10.0, and HCO3 in SSR60 is −255.2, respectively. However, the discharge sequence is SR > SSR30 > SSR60 > SSR100 (see Figure 4), and the concentrations of water quality parameters (Ca2+, Mg2+, SO42−, HCO3) increase with depth, indicating that the C-Q shows a positive relationship in the vertical direction.

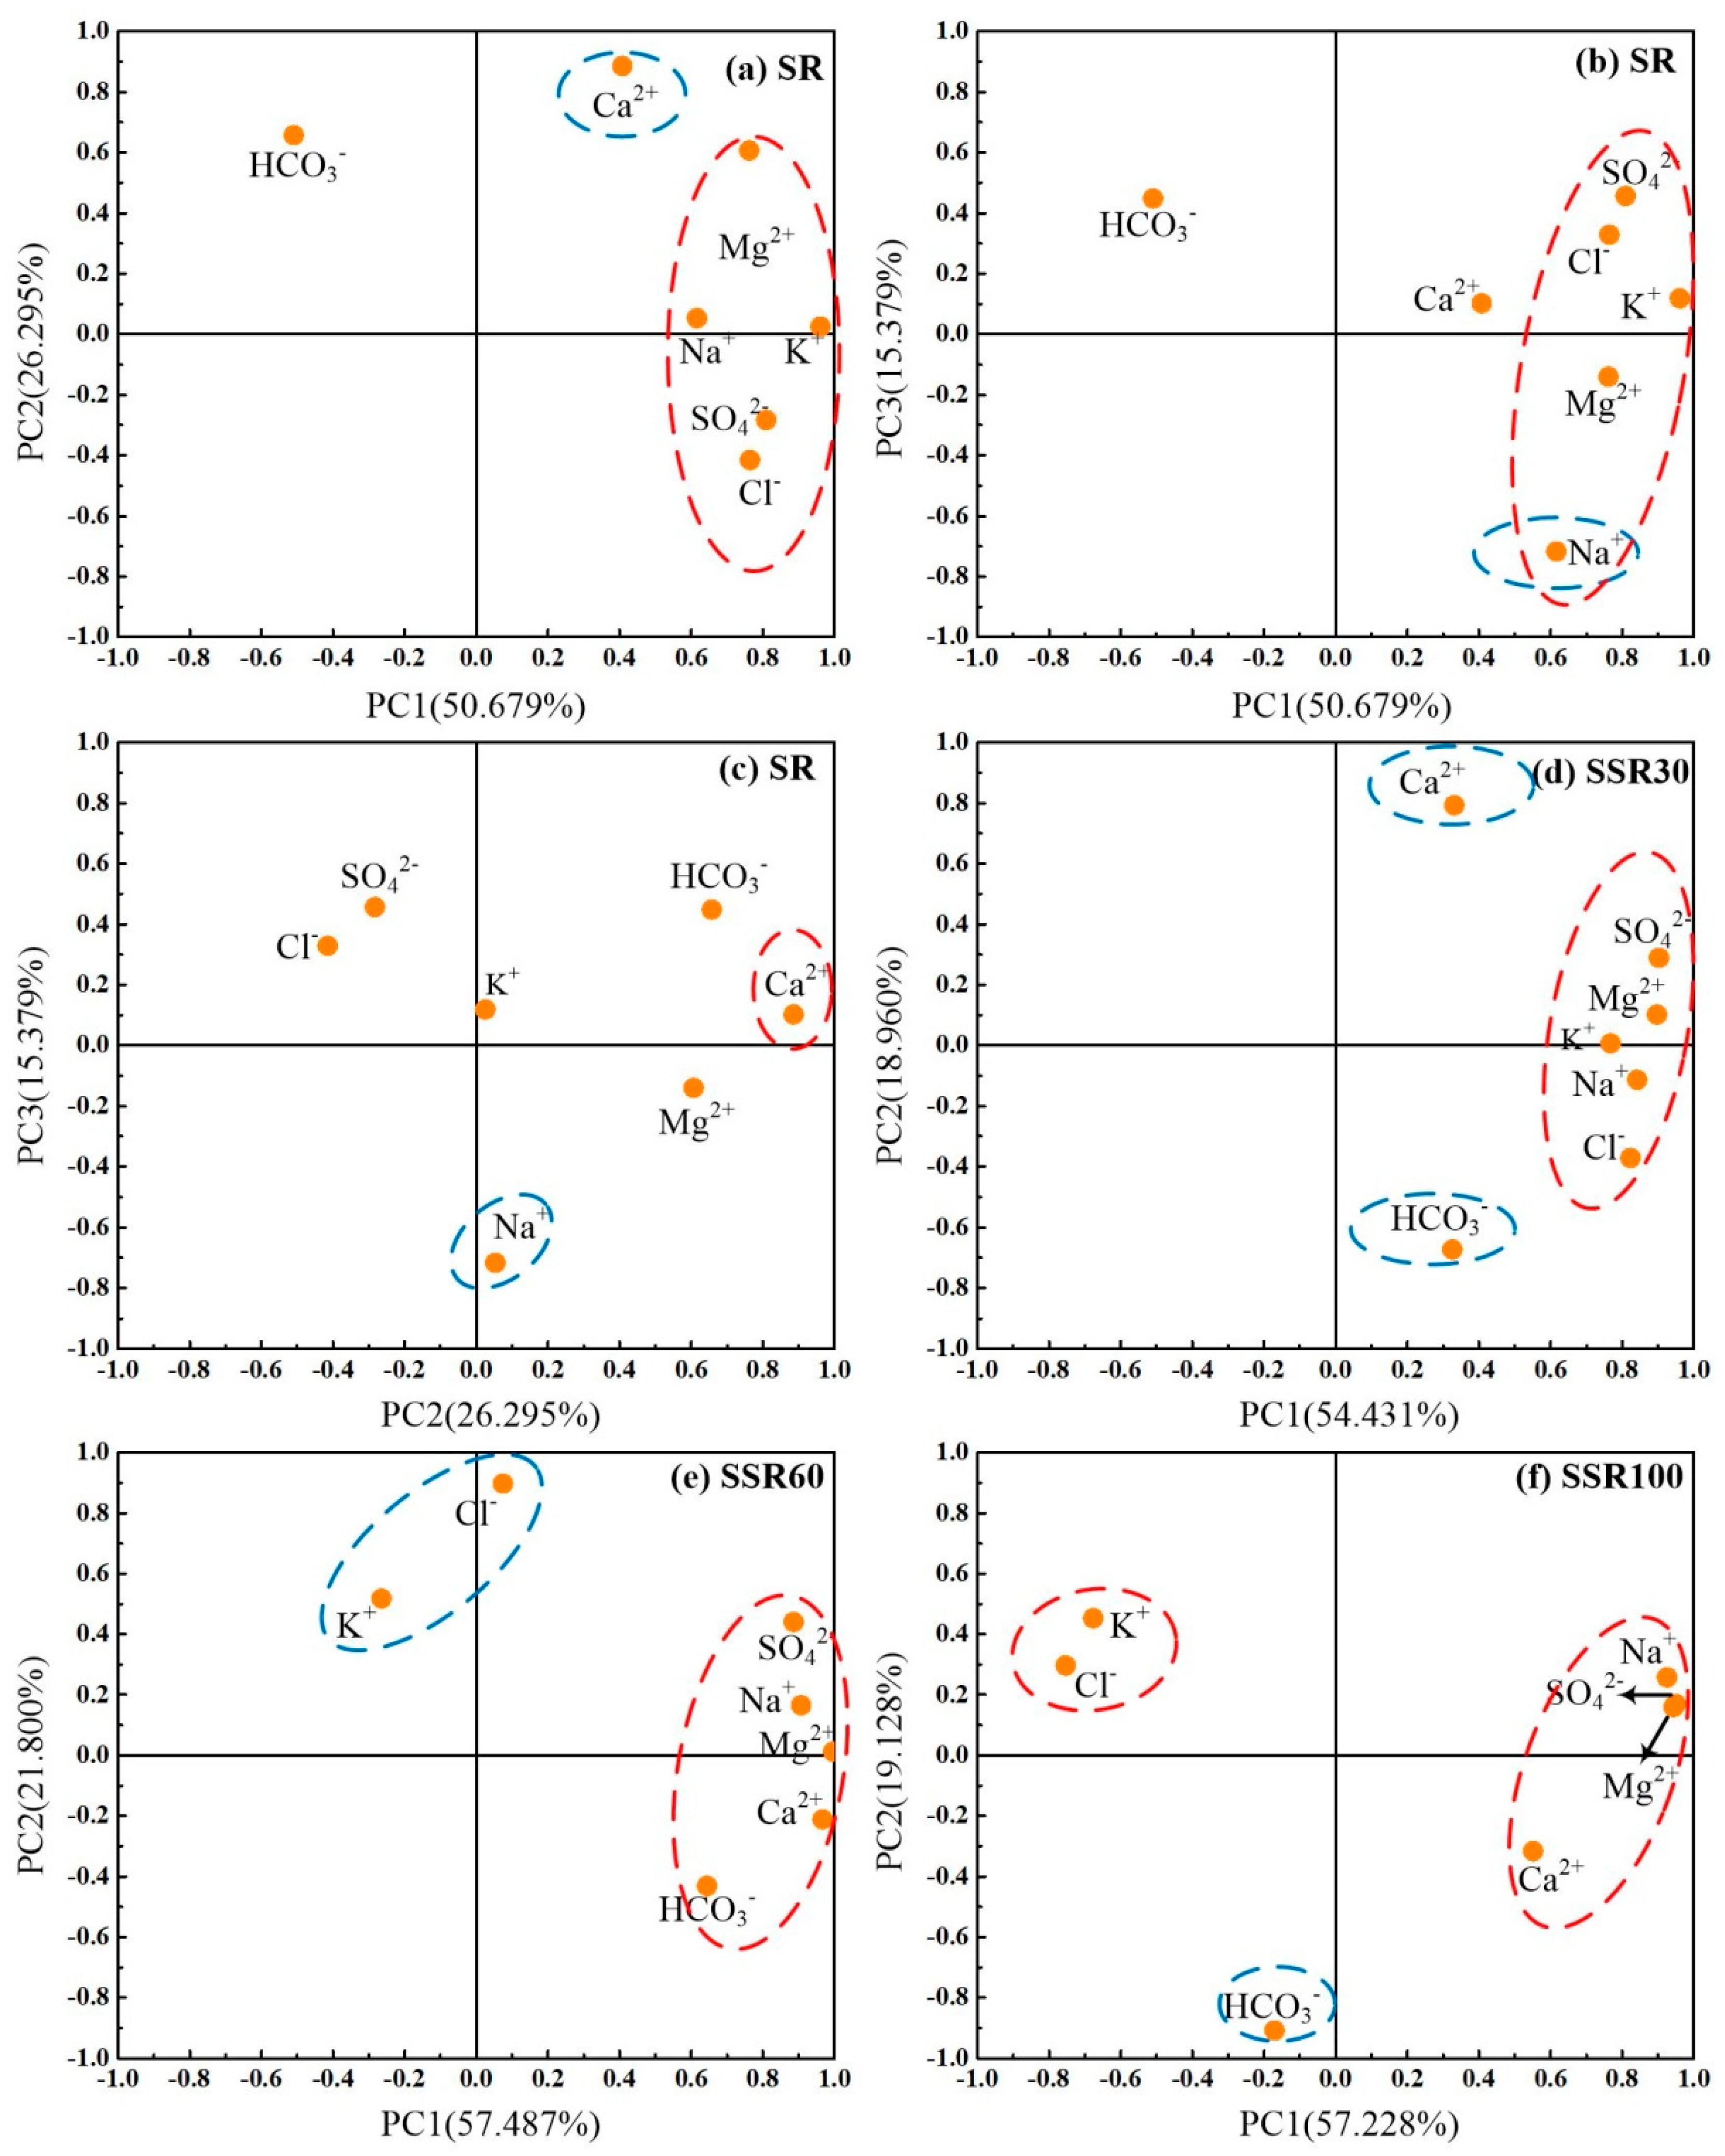
3.3. Principal Component Analysis

Further insights were gained from PCA analysis. There are three PCs with an eigenvalue of one or greater in SR and two PCs in SSR30, SSR60, and SSR100, respectively. Each principal component in the component loadings has linear relationships with the original variables, and each principal component can be used to interpret as a specific hydrogeochemical process through an examination of their loadings [22,27].
The three PC’s associated with SR explained 50.68%, 26.30%, and 15.38%, respectively. The amount of variance explained by the two PCs in SSR30 was 54.43% and 18.96%, 57.49% and 21.80% in SSR60, and 57.23% and 19.13% in SSR100. The cumulative contribution rate of these four runoff types was 92.35%, 73.39%, 79.29%, and 76.36%, respectively. The cumulative contribution rate for the three PCs in SR and two PCs in SSR30, SSR60, and SSR100 shows that they explain most of the information. Additional PCs accounted for only a small percentage of the total variance, and the parameters within them had insignificant correlation coefficients [27].

4. Discussion

4.1. Runoff Pathways and Concentration–Discharge Relationships

Insights to the commonly observed behavior of solutes in C-Q relationships can be found in previous literature. Godsey et al. [4] studied 59 relatively undisturbed catchments having diverse physical characteristics distributed across the US, where results show remarkably consistent chemostatic to slight dilution response for major lithogenic elements (Si, Ca, Mg, Na, K). Further, Anderson found that base cations decline in concentration with increased discharge, while aerosol and rain-deposited anions (e.g., chloride, sulfate) may display no trend with discharge [12]. The C-Q relationships observed in this study partly align with these concepts. However, not all four runoff components show the same responses, due to characteristics of the Hydrohill catchment and associated streamflow generation.
At the Hydrohill catchment, rainfall provides inputs of hydrochemical ions, which then infiltrate into the unsaturated zone and the saturated groundwater zone. In this infiltration process, many ions’ concentrations (Ca2+, Mg2+, SO42−, and HCO3) increase with depth and finally become maximum values in groundwater (Figure 4), while other ions show similar characteristics only in some of the events. Shortly after rainfall begins, surface runoff is generated, and with the increasing discharge, concentrations of the hydrochemical ions decline in SR (see Figure 3 and Figure 4). Surface runoff is diluted with rainwater and/or shallow soil water during the precipitation events, a common explanation for the hydrochemical response in SR [12]. The Hydrohill catchment is fully closed at the bottom, so rainfall is the primary water input source. Incoming water during events infiltrates in the soil, generating runoff via SR, SSR30, SSR60, and SSR100. Variations of the hydrochemical concentration from the four runoff components reveal that the solutes of interflow are not only driven by rainfall but also by multiple processes in each of the soil layers, such as biological processes (mainly ion-exchange) and water–soil interaction processes (dissolution, adsorption and desorption, ion-exchange, leaching, and other chemical interactions) [24,30,31,32,33]. The SR and SSR30 have a similar slope of fitted regression lines (see Figure 5), which suggests that they are driven by similar processes.
Different ions may occur in different processes due to their sources. For example, the Na+ in the soil can be brought by rainfall infiltration and may also be formed by weathering and dissolution of sodium-containing minerals in the soil. The concentration of Ca2+ is more affected by complex water-rock effects such as ion adsorption and leaching [32]. The SO42− in the rainfall at the Hydrohill catchment comes primarily from the atmosphere. After entering the soil, a series of reactions, such as SO2 and H2S oxidation, sulfur-containing animal and plant residues decompose protein, sulfur-containing animal and plant residues decomposing protein, etc., occur in the soil [29]. In addition to the rainfall replenishment, primary sources of HCO3 in the soil are the dissolution of CO2, microbial activities, and the weathering decomposition of carbonates [34]. For the positive C-Q relationship of K+ and Cl in SSR60 and SSR100, the concentration of K+ and Cl was very small compared with other ions. In theory, under natural rainfall conditions, the underground runoff from the ground to 100 cm is a mixing process of rainfall input Cl and previous soil water Cl. Therefore, the change of Cl may be related to the Cl concentration in rainfall, as well as the Cl concentration in the soil in the previous period. Thus, this condition for K+ and Cl will be further studied in the future experiments and research. The composition of water exiting the outlets may also change as the discharge from the soil changes, becoming more dilute at high flow and more concentrated at low flow.
Due to its long legacy as an experimental catchment, much is known about the complex mechanisms generating streamflow discharge at this site. Gu et al. [24] concluded that there are many types of runoff mechanisms that can be operating simultaneously in this catchment during precipitation events. Many are directly related to the unsaturated zone, including direct interflow from the unsaturated zone, ubiquitous preferential flow including macropore flow in the unsaturated zone, and the soil’s indispensable contribution to surface runoff generation [24]. At Chuzhou Hydrohill, various macropores were also visible 3 years after soil infilling, with the development of natural vegetation and roots. Macropore flow is the most frequently observed type of preferential flow across soils and landscapes, and macropores play an important role in controlling preferential flow and solute chemistry in catchments [35,36,37].
The soils of Hydrohill are heterogeneous at multiple scales—from pores to pedons to hillslopes—thus it is expected that soil heterogeneities manifest into hydrological heterogeneities during rainfall-runoff events [24]. After studying numerous rainfall events, Gu found that once a rainfall with a uniform spatial distribution in isotopic and hydrochemical signatures across the entire catchment fell onto the ground, the uniform input of infiltrating rainwater quickly turned into a spatially heterogeneous distribution. Such heterogeneity increased with soil depth until the groundwater table [24]. Thus, the soil water appears to indisputably be a main influencing factor during rainfall-runoff processes, and it possesses the strongest heterogeneity among all water components involved in the catchment water cycle [24]. Some of the flow mechanisms are characterized by high flow velocities, short contact time, and/or high-volume water movement, which can lead to preferential flow in soils to be an essential factor influencing hydrological cycle, soil erosion, hillslope stability, environmental quality, and many other biogeochemical and ecological processes [38,39]. As the chemistry of water in the soil also depends on the flow velocity and flow path, flow through soil pores may lower the solute concentrations, which is much more obvious in shallow water during precipitation events [40]. The C-Q relationships in the different runoff pathways show that solute concentrations in runoff depend on the proportions of runoff from the soil and from the pores, both of which can be a function of discharge and vary as the discharge varies. Rain appears to enhance the exchange of water and solutes between small and large pores, allowing solutes produced between rain events to be swept out during rain events. Our results highlight that leaching and dilution, water–soil interaction, and macropores in soils all shape the C-Q relationships.

4.2. Principal Component Analysis

Three principal component eigenvectors explained most of the variability in hydrochemistry in surface runoff, while two eigenvectors explained most of the variability in the hydrochemistry of subsurface flows observed at various depths in the soil profile (see Table 1). PC1, PC2, and PC3 mean the first, the second, and the third principal component respectively. The PCA results reveal distinct water chemistry between the four sampling depths corresponding to the different runoff components and support the notion that hydrochemistry is also affected by the varying discharges during these precipitation events. Scatter plots of the principal component loadings between PC1, PC2, and PC3 in SR and PC1 with PC2 in SSR30, SSR60, and SSR100 show the variation of the principal component loadings from positive to negative (Figure 6), providing further insights into relationships between the principal components and hydrochemical variables.
In SR, PC1 has a positive weight for K+, Na+, Mg2+, Cl, and SO42−, with K+ and SO42− weighted most heavily (0.961 and 0.809, respectively). PC2 has a positive weighting for Ca2+ (0.886) and Mg2+ (0.607). PC3 has a negative weight for Na+ (−0.717). In SSR30, PC1 has a positive weight for K+, Na+, Mg2+, Cl, and a higher, positive weight for SO42− (0.902). PC2 has a positive weight for Ca2+ (0.793) and a negative weight for HCO3. In SSR60, PC1 shows a positive relationship with Na+, Ca2+, and Mg2+, and a relatively smaller, positive weighting for SO42− and HCO3 (0.886 and 0.664). PC2 has a positive weight for K+ and a higher positive relationship with Cl. In SSR100, PC1 has a positive weight for SO42−, Mg2+, and Na+ (from 0.925 to 0.950), and a smaller, positive weight for Ca2+ (0.551), and has a negative weight for K+ (−0.676) and Cl (−0.754). PC2 behaves heavily negatively with HCO3 (−0.908). The first principal components (PC1) for all four runoff pathways are interpreted as salinity factors. Salinity, in turn, is directly controlled by the concentrations of Na+ and Cl, which is derived from the interaction of water and soil. The relationship between PC1 and Na+ is getting highly correlated with depth and always closely correlated with Cl due to their higher solubility. In addition, the principal components have a very strong relationship with Mg2+, Ca2+, and HCO3, suggesting that the main sources are from carbonate minerals such as dolomites and limestone minerals.

5. Conclusions

Relationships between hydrological and hydrochemical processes were explored in four different runoff components issuing from the Hydrohill catchment during rainfall events. C-Q relationships reveal that the concentrations of Na+, Ca2+, Mg2+, SO42−, and HCO3 in surface runoff (SR), shallow subsurface interflows (SSR30 and SSR60), and in groundwater flows (SSR100) have a negative relationship with discharge. The concentration of K+ and Cl were negatively correlated with discharge in SR and SSR30, but were positively correlated with discharge in SSR60 and SSR100. C-Q relationships for Ca2+, Mg2+, SO42−, and HCO3 show a positive relationship with depth. Within the infiltration process, the leaching and dilution, water–soil interaction, and macropores in soils are the main controlling factors resulting in these C-Q relationships. Using a PCA approach, three eigenvectors explained 92% of the variability in hydrochemistry in surface runoff, while two eigenvectors explained more than 70% of the variability in hydrochemistry of subsurface flows observed at various depths in the soil profile (73% for SSR30, 79% for SSR60, and 76% for SSR100). One principal component was interpreted as a salinity factor, deriving from carbonate minerals such as dolomites and limestone minerals, reinforcing the notion of water–soil interactions. Results indicated that leaching and dilution processes, water–soil interaction, and macropore flows in soils are the primary factors controlling the C-Q relationships.
Results also highlight coupling among hydrological and hydrochemical processes, influencing each other. Further work is needed to understand how soils become a source of hydrochemical ions, and how hydropedology affects the differential responses among the runoff flow pathways at Hydrohill. Our work sheds light on the coupled processes and streamflow generation mechanisms that control water quality at the catchment scale.

Author Contributions

Conceptualization, N.Y., J.Z. and J.L.; Data curation, J.Z., J.L., G.L., G.W. and L.G.; Formal analysis, N.Y.; Funding acquisition, J.L. and G.W.; Investigation, N.Y.; Methodology, J.L. and N.Y.; Resources, J.L.; Validation, L.G.; Writing—original draft, N.Y.; Writing—review and editing, G.W., L.G. and E.W.B. All authors have read and agreed to the published version of the manuscript.

Funding

This research was funded by the National Natural Science Foundation of China, grant numbers 41830863 and 91647203.

Acknowledgments

We thank Hao Zheng and Niu Wang for their assistance with data collection, as well as Chaoyu Zheng and Tongping Liu for their assistance with water sampling. We appreciate ideas and mentoring provided by the late Henry Lin, Professor of hydropedology at Penn State, who is greatly missed. We also appreciate Tao Ma for providing nice pictures of experimental facilities and the Chuzhou Hydrohill experimental catchment.

Conflicts of Interest

The authors declare no conflict of interest.

References

  1. Chanat, J.G.; Rice, K.C.; Hornberger, G.M. Consistency of patterns in concentration-discharge plots. Water Resour. Res. 2002, 38, 1–10. [Google Scholar] [CrossRef]
  2. Chorover, J.; Derry, L.A.; McDowell, W.H. Concentration-discharge relations in the critical zone: Implications for resolving critical zone structure, function, and evolution. Water Resour. Res. 2017, 53, 8654–8659. [Google Scholar] [CrossRef]
  3. Hornberger, G.M.; Scanlon, T.M.; Raffensperger, J.P. Modelling transport of dissolved silica in a forested headwater catchment: The effect of hydrological and chemical time scales on hysteresis in the concentration–discharge relationship. Hydrol. Process. 2001, 15, 2029–2038. [Google Scholar] [CrossRef]
  4. Godsey, S.E.; Kirchner, J.W.; Clow, D.W. Concentration–discharge relationships reflect chemostatic characteristics of US catchments. Hydrol. Process. 2009, 23, 1844–1864. [Google Scholar] [CrossRef]
  5. Musolff, A.; Schmidt, C.; Selle, B.; Fleckenstein, J.H. Catchment controls on solute export. Adv. Water Resour. 2015, 86, 133–146. [Google Scholar] [CrossRef]
  6. Boyer, E.W.; Hornberger, G.M.; Bencala, K.E.; McKnight, D.M. Effects of asynchronous snowmelt on flushing of dissolved organic carbon: A mixing model approach. Hydrol. Process. 2000, 14, 3291–3308. [Google Scholar] [CrossRef]
  7. Burns, D.A. What do hydrologists mean when they use the term flushing? Hydrol. Process. 2005, 19, 1325–1327. [Google Scholar] [CrossRef]
  8. Rue, G.P.; Rock, N.D.; Gabor, R.S.; Pitlick, J.; Tfaily, M.; McKnight, D.M. Concentration-discharge relationships during an extreme event: Contrasting behavior of solutes and changes to chemical quality of dissolved organic material in the Boulder Creek Watershed during the September 2013 flood. Water Resour. Res. 2017, 53, 5276–5297. [Google Scholar] [CrossRef]
  9. Clow, D.W.; Drever, J.I. Weathering rates as a function of flow through an alpine soil. Chem. Geol. 1996, 132, 131–141. [Google Scholar] [CrossRef]
  10. House, W.A.; Warwick, M.S. Hysteresis of the solute concentration/discharge relationship in rivers during storms. Water Res. 1998, 32, 2279–2290. [Google Scholar] [CrossRef]
  11. Aguilera, R.; Melack, J.M. Concentration-discharge responses to storm events in coastal California watersheds. Water Resour. Res. 2018, 54, 407–424. [Google Scholar] [CrossRef]
  12. Anderson, S.P.; Dietrich, W.E.; Torres, R.; Montgomery, D.R.; Loague, K. Concentration-discharge relationships in runoff from a steep, unchanneled catchment. Water Resour. Res. 1997, 33, 211–225. [Google Scholar] [CrossRef] [Green Version]
  13. Evans, C.; Davies, T.D. Causes of concentration/discharge hysteresis and its potential as a tool for analysis of episode hydrochemistry. Water Resour. Res. 1998, 34, 129–137. [Google Scholar] [CrossRef]
  14. Thompson, S.E.; Basu, N.B.; Lascurain, J.; Aubeneau, A.; Rao, P.S.C. Relative dominance of hydrologic versus biogeochemical factors on solute export across impact gradients. Water Resour. Res. 2011, 47. [Google Scholar] [CrossRef]
  15. Ameli, A.A.; Beven, K.; Erlandsson, M.; Creed, I.F.; McDonnell, J.J.; Bishop, K. Primary weathering rates, water transit times, and concentration-discharge relations: A theoretical analysis for the critical zone. Water Resour. Res. 2017, 53, 942–960. [Google Scholar] [CrossRef] [Green Version]
  16. Hoagland, B.; Russo, T.A.; Gu, X.; Hill, L.; Kaye, J.; Forsythe, B.; Brantley, S.L. Hyporheic zone influences on concentration-discharge relationships in a headwater sandstone stream. Water Resour. Res. 2017, 53, 4643–4667. [Google Scholar] [CrossRef]
  17. Basu, N.B.; Thompson, S.E.; Rao, P.S.C. Hydrologic and biogeochemical functioning of intensively managed catchments: A synthesis of top-down analyses. Water Resour. Res. 2012, 48. [Google Scholar] [CrossRef]
  18. Van, M.K.J.; Basu, N.B.; Van, C.P. Two centuries of nitrogen dynamics: Legacy sources and sinks in the Mississippi and Susquehanna River Basins. Glob. Biogeochem. Cycles 2017, 31, 2–23. [Google Scholar] [CrossRef] [Green Version]
  19. Christopherson, N.; Hooper, R.P. Multivariate analysis of stream water chemical data: The use of principal components analysis for the end-member mixing problem. Water Resour. Res. 1992, 28, 99–107. [Google Scholar] [CrossRef]
  20. Carroll, S.; Goonetilleke, A. Assessment of high density of onsite wastewater treatment systems on a shallow groundwater coastal aquifer using PCA. Environmetrics 2005, 16, 257–274. [Google Scholar] [CrossRef] [Green Version]
  21. Lamouroux, C.; Hani, A. Identification of groundwater flow paths in complex aquifer systems. Hydrol. Process. 2006, 20, 2971–2987. [Google Scholar] [CrossRef]
  22. Rao, N.S.; Rao, J.P.; Subrahmanyam, A. Principal component analysis in groundwater quality in a developing urban area of Andhra Pradesh. J. Geol. Soc. India 2007, 69, 959. [Google Scholar]
  23. Yang, P.H.; Yuan, D.X.; Yuan, W.H.; Kuang, Y.L.; Jia, P.; He, Q.F. Formations of groundwater hydrogeochemistry in a karst system during storm events as revealed by PCA. Chin. Sci. Bull. 2010, 55, 1412–1422. [Google Scholar] [CrossRef]
  24. Gu, W.Z.; Liu, J.F.; Lin, H.; Lin, J.; Liu, H.W.; Liao, A.M.; Wang, N.; Wang, W.Z.; Ma, T.; Yang, N.; et al. Why hydrological maze: The hydropedological trigger? Review of experiments at Chuzhou hydrology laboratory. Vadose Zone J. 2018, 17, 1–27. [Google Scholar] [CrossRef] [Green Version]
  25. Liu, J.F.; Liao, A.M.; Wang, N.; Lin, J.; Liu, H.W.; Wang, W.Z.; Ma, T.; Cai, Z.; Liao, M.H.; Li, X.G.; et al. Hydrology of artificial and controlled experiments. Practice on the watershed hydrological experimental system reconciling deterministic and stochastic subjects based on the system complexity: 2. Practice and test. In Hydrology of Artificial and Controlled Experiments; Liu, J.F., Gu, W.Z., Eds.; IntechOpen: London, UK, 2018; pp. 253–281. [Google Scholar] [CrossRef] [Green Version]
  26. Shrestha, S.; Kazama, F. Assessment of surface water quality using multivariate statistical techniques: A case study of the Fuji river basin, Japan. Environ. Model. Softw. 2007, 22, 464–475. [Google Scholar] [CrossRef]
  27. Field, A.P. Discovering Statistics Using SPSS, 2nd ed.; Sage: London, UK, 2005; pp. 574–575. Available online: sro.sussex.ac.uk/id/eprint/14911 (accessed on 28 October 2020).
  28. Hem, J.D. Study and Interpretation of the Chemical Characteristics of Natural Water, 3rd ed.; U.S. Geological Survey: Alexandria, VA, USA, 1985; p. 272.
  29. Yang, N.; Zhang, J.Y.; Liu, J.F.; Liu, G.D.; Liao, A.M.; Wang, G.Q. Analysis of event-based hydrological processes at the hydrohill catchment using hydrochemical and isotopic methods. In Proceedings of the International Association of Hydrological Sciences; Copernicus Publications: Bethel Park, PA, USA, 2020; Volume 383, pp. 99–110. [Google Scholar] [CrossRef]
  30. Gu, W.Z.; Lu, J.J.; Zhao, X.; Norman, E.P. Responses of hydrochemical inorganic ions in the rainfall-runoff processes of the experimental catchments and its significance for tracing. Adv. Water Resour. 2007, 18, 1–7. (in Chinese). [Google Scholar] [CrossRef]
  31. Nimick, D.A.; Cleasby, T.E.; McCleskey, R.B. Seasonality of diel cycles of dissolved trace-metal concentrations in a Rocky Mountain stream. Environ. Geol. 2005, 47, 603–614. [Google Scholar] [CrossRef]
  32. Liu, H.Y.; Huang, J.G.; Guo, Y.N. Impacts of different vegetation types and soil properties on runoff chemical characteristics. Environ. Sci. 2006, 27, 654–660. [Google Scholar] [CrossRef]
  33. Qiao, B.Q.; Chen, K.P. The chemical composition in different categories of soil water. J. Nanjing Univ. Nat. Sci. 2015, 3, 604–611. [Google Scholar]
  34. Zhang, R.Q. Fundamentals of Hydrogeology, 7th ed.; Geological Publishing House: Beijing, China, 2011. [Google Scholar]
  35. Guo, L.; Lin, H. Addressing two bottlenecks to advance the understanding of preferential flow in soils. Adv. Agron. 2018, 147, 61–117. [Google Scholar] [CrossRef]
  36. Jarvis, N.J. A review of non-equilibrium water flow and solute transport in soil macropores: Principles, controlling factors and consequences for water quality. Eur. J. Soil Sci. 2007, 58, 523–546. [Google Scholar] [CrossRef]
  37. Guo, L.; Hallett, P.D.; Müller, K. Landmark Papers: No. 9 Jarvis, NJ 2007. A review of non-equilibrium water flow and solute transport in soil macropores: Principles, controlling factors and consequences for water quality. European Journal of Soil Science, 58, 523–546: Commentary on the impact of Jarvis (2007) by L. Guo, PD Hallett and K. Müller. PD Hallett and K. Müller. Eur. J. Soil Sci. 2020, 71, 308–315. [Google Scholar] [CrossRef]
  38. Guo, L.; Lin, H. Critical zone research and observatories: Current status and future perspectives. Vadose Zone J. 2016, 15. [Google Scholar] [CrossRef] [Green Version]
  39. Hencher, S.R. Preferential flow paths through soil and rock and their association with landslides. Hydrol. Process. 2010, 24, 1610–1630. [Google Scholar] [CrossRef]
  40. Freeze, R.A.; Cherry, J.A. Groundwater; Prentice Hall: Englewood Cliffs, NJ, USA, 1979; p. 398. [Google Scholar]
Figure 1. (a) The Hydrohill experimental catchment is located in the city of Chuzhou in the Anhui Province of southeastern China. (b) Hydrological and hydrochemical observation devices are installed in the artificial Hydrohill catchment, which is covered by grass.
Water 12 03033 g001
Figure 2. The overall layout of hydrometric monitoring at the Hydrohill experimental catchment. Central stacked troughs are used to collect various runoff components at different depths. Measuring structures for different runoff components and section negative pressure sampling system are housed in a collection room.
Water 12 03033 g002
Figure 3. (top) Rainfall and (bottom) discharge hydrographs of the different runoff components observed from 25 to 28 October 2016 at the Hydrohill experimental catchment.
Water 12 03033 g003
Figure 4. Mean concentrations of selected solutes found in runoff components, observed from 25 to 28 October 2016 at the Hydrohill experimental catchment.
Water 12 03033 g004
Figure 5. (ag) show the relationships between concentrations (K+, Na+, Ca2+, Mg2+, Cl, SO42−, or HCO3, on the y-axis) and discharge (on the x-axis) in different runoff components during raninfall events at the Hydrohill catchment. Symobls refer to surface runoff sample values. Linear relationships provide an indication of the rate and magnitude of the concentration changes.
Water 12 03033 g005
Figure 6. (ac) show the component loadings of variables for PCs in SR. (d) shows the component loadings of variables for PCs in SSR30. (e) shows the component loadings of variables for PCs in SSR60. (f) shows the component loadings of variables for PCs in SSR100. The red dashed line oval circles chemicals of high correlation coefficient with PCs located in the x-axis, and the blue dashed line oval circles chemicals of high correlation coefficient with PCs in the y-axis.
Water 12 03033 g006
Table 1. Principal component (PC) analysis loadings of the hydrogeochemical parameters.
ParametersSRSSR30SSR60SSR100
PC1PC2PC3PC1PC2PC1PC2PC1PC2
K+0.9610.0250.1190.7680.007−0.2640.518−0.6760.453
Na+0.6160.053−0.7170.842−0.1140.9070.1660.9250.257
Ca2+0.4080.8860.1030.3310.7930.967−0.2110.551−0.316
Mg2+0.7620.607−0.1400.8970.1020.9960.0120.9430.160
Cl0.764−0.4150.3290.823−0.3720.0740.898−0.7540.297
SO42−0.809−0.2830.4570.9020.2890.8860.4400.9500.170
HCO3−0.5090.6570.4490.326−0.6730.664−0.431−0.171−0.908
Eigenvalue3.5471.8411.0773.8101.3274.0241.5264.0061.339
Variance explained by PCs (%)50.6826.3015.3854.4318.9657.4921.8057.2319.13
Cumulative variance explained by PCs (%)50.6876.9792.3554.4373.3957.4979.2957.2376.36
Publisher’s Note: MDPI stays neutral with regard to jurisdictional claims in published maps and institutional affiliations.

