Article

Influence of Physical and Chemical Characteristics of Sediment on Macroinvertebrate Communities in Agricultural Headwater Streams

by
Tyler C. Shuman
1,
Peter C. Smiley, Jr.
2,
Robert B. Gillespie
1,* and
Javier M. Gonzalez
3
1
Department of Biology, Purdue University Fort Wayne, Fort Wayne, IN 46805, USA
2
USDA Agricultural Research Service, Columbus, OH 43210, USA
3
USDA Agricultural Research Service, West Lafayette, IN 47907, USA
*
Author to whom correspondence should be addressed.
Water 2020, 12(11), 2976; https://doi.org/10.3390/w12112976
Submission received: 18 September 2020 / Revised: 19 October 2020 / Accepted: 20 October 2020 / Published: 23 October 2020

Abstract

:
Agricultural land use leads to changes in physical and chemical characteristics of sediment that influence macroinvertebrate community diversity and abundance in streams. To the best of our knowledge the joint influence of sediment’s physical and chemical characteristics on stream macroinvertebrates has not been assessed. We measured sediment’s physical and chemical characteristics and sampled macroinvertebrates in eight agricultural headwater streams in Indiana, Michigan, and Ohio, United States, in 2017 and 2018 to determine the physical and chemical conditions of the sediment, to evaluate the relationships between physical and chemical characteristics of the sediment, and the relationship of macroinvertebrate communities with the sediment’s physical and chemical characteristics. Sediments within most sites were dominated by sand or silt. pH was suitable for macroinvertebrates and nitrate, herbicide, and trace metal concentrations were below concentration levels anticipated to affect macroinvertebrate survival. Linear mixed effect model analysis results indicated that a physical gradient of percent small gravel and percent silt was positively correlated (p < 0.05) with a chemical gradient of potassium concentrations, magnesium concentrations, and percent total nitrogen in the sediments. Our linear mixed effect model analysis results also indicated that Invertebrate Community Index scores were negatively correlated (p < 0.05) with a chemical gradient of simazine and calcium concentrations and were negatively correlated (p < 0.05) with physical gradient of grain size diversity and percent sand. Our results suggest that watershed management plans need to address physical and chemical degradation of sediment to improve macroinvertebrate biotic integrity within agricultural headwater streams in the Midwestern United States.

1. Introduction

Macroinvertebrates in streams are influenced by a wide range of abiotic and biotic factors operating at different spatial and temporal scales [1,2]. Benthic sediments represent a critical habitat resource for stream macroinvertebrates because many reside within the sediment or on its surface. Discovery of the importance of sediment particle size for stream macroinvertebrates dates back to the late 1920s [3]. Interest in sediment’s physical characteristics by early stream ecologists was likely influenced by a parallel interest by marine biologists with invertebrate-substrate relationships [3]. Sediment particle size and other physical characteristics of sediment have long been considered the foundation of the physical habitat template [4] for macroinvertebrates and a critical determinant of macroinvertebrate population and community structure in streams [1,3]. Increases in macroinvertebrate diversity and abundance with increasing particle size and particle size diversity has been well documented [1,5]. Changes in macroinvertebrate diversity and taxa composition among pools, riffles, and runs occur from changes in substrate types and water velocity among microhabitat types [1,6]. These relationships between sediment and hydrologic characteristics highlight the role of sediment as a habitat-forming feature that alters other physical habitat characteristics [7]. Additionally, the severity of spates and floods are often described through their impacts on sediment movement and its subsequent influence on macroinvertebrate community structure [8,9].
Agricultural land use causes excess fine sediments (<2 mm in size) in streams that negatively impacts macroinvertebrates and stream habitat quality worldwide [7]. Increases in fine sediments from agriculture occurs from cropland soil erosion, riparian habitat loss, decreased bank stability, and altered hydrologic regimes [10]. Deposition of fine sediments results in injury, impaired feeding and respiration, increased drift, decreased growth, and increased mortality [7,11,12]. Ultimately, population and community level changes (e.g., decreased diversity, abundance, biomass, and reductions in sediment sensitive (Ephemeroptera, Plecoptera, Trichoptera) and filter feeding taxa) occur due to increased fine sediment deposition [7,10,11,12,13].
Agricultural land use also increases the nutrients and pesticides in benthic sediments [14]. The increased deposition of fine sediments from agriculture increases sediment contamination because silt and clay fractions sorb pesticides and trace metals [11]. Increases in fine sediment may also increase organic content resulting in oxygen depletion and increases in ammonia and trace metals [12]. Thus, increasing fine sediments is also associated with the accumulation of nutrients, pesticides, and trace metals within agricultural streams and increased sediment toxicity. Increases in sediment toxicity from agricultural contaminants have been documented to decrease biodiversity, biomass, and the abundance of sediment sensitive taxa [15,16]. Most sediment quality guidelines developed to reduce the impact of contaminated sediments are based on macroinvertebrates [17], highlighting the importance of sediment contamination as an influential abiotic factor.
Macroinvertebrates in agricultural streams are influenced by both physical and chemical sediment characteristics. Macroinvertebrate–sediment relationships within agricultural streams are complex and involve direct effects, indirect effects, and confounding effects of other habitat characteristics [2,15,18,19]. Additionally, regional differences in macroinvertebrate-habitat relationships in streams within the United States suggests these relationships may be site-specific [20,21]. Previous studies evaluating the relationships of macroinvertebrates with sediment have focused on either sediment’s physical or chemical characteristics. We suspect the lack of information on the joint influence of sediment’s physical and chemical characteristics derives from a focus on reducing nutrients, pesticides, and suspended sediments in agricultural runoff and stream water [17]. There are greater amounts of information on water chemistry than sediment quality. Additionally, the greater regulatory usage of suspended sediment guidelines than deposited sediment guidelines in the United States and Canada confirms the water quality focus [17,22].
To our knowledge, no other studies have evaluated the influence of physical and chemical characteristics of sediment on macroinvertebrates in agricultural streams. This information is needed to help develop conservation plans capable of reducing agricultural impacts on the numerous agricultural headwater streams in the United States, Canada, and Europe that have been impacted by channelization that removes large substrates and decreases sediment diversity [23]. To address this information gap we measured physical and chemical characteristics of sediment and sampled macroinvertebrates in eight agricultural headwater streams in Indiana, Michigan, and Ohio, United States over two years. Our research questions were: (1) what are the physical and chemical conditions of sediments in agricultural headwater streams in the Midwestern United States?; (2) what is the relationship between sediment’s physical and chemical characteristics in agricultural headwater streams in the Midwestern United States?; and (3) what is the relationship between macroinvertebrate communities and sediment’s physical and chemical characteristics in agricultural headwater streams in the Midwestern United States?

2. Materials and Methods

2.1. Study Sites

Eight sites within eight agricultural headwater streams were selected for our study. Selected sites were 150 m in length and were part of our long term research efforts in Indiana, Michigan, and Ohio in support of the United States Department of Agriculture Agricultural Research Service’s Conservation Effects Assessment Project Watershed Assessment Study [24,25,26]. Four sites were located in the Saint Joseph River watershed (SJR) in northeast Indiana and southern Michigan, and four sites were located in the Upper Big Walnut Creek watershed (UBWC) in central Ohio (Supplementary Figures S1 and S2). Our previous publications [24,25,26,27] have described the watershed characteristics of the SJR and UBWC, and we only summarize the key watershed trends here. SJR drains north into Lake Erie and UBWC flows south into the Ohio River. Both SJR and UBWC serve as the drinking water source for major metropolitan areas (SJR-Fort Wayne, Indiana; UBWC-Columbus, Ohio). Land use in both watersheds consists mostly of cropland planted with soybeans (Glycine max) and corn (Zea mays) on a rotating basis. Most streams in SJR and UBWC have been channelized for agricultural drainage and watershed management issues encompass nutrients, pathogens, and physical habitat degradation [28,29]. Both SJR and UBWC are located in the hot summer continental climate region of the United States (Koppen Climate Classification Dfa). Within each watershed, we selected sites with a range of watershed sizes, percent agricultural land use, riparian canopy cover, and channelization status (Table 1) to ensure that our sampling was conducted over a range of physical and chemical characteristics of sediment.

2.2. Sediment Sampling and Measurement of Physical and Chemical Characteristics

Sediment sampling occurred in the spring (May–June) and fall (September–October) of 2017 and 2018, respectively. Each 150 m site was delineated into six 25 m long segments that served as the sampling unit for our statistical analyses. Prior to sampling, one segment from each site was randomly selected. No segment was repeatedly sampled, and we sampled four of six segments from each site during our two-year study resulting in a total of 32 segments sampled. We used stratified random sampling to randomly select six locations within each segment for sediment sampling. Stratified random sampling selected six locations from 72 possible locations in each segment that were derived from pairs of 24 possible longitudinal positions (1 m intervals from the downstream border of the segment to 24 m upstream) and from three possible latitudinal positions (left, center, right) (Supplementary Figure S3).
Benthic sediments were sampled with a hand corer (diameter 5.08 cm) to a depth of 7.6 cm at the six randomly selected locations in each segment and composited into a single sample. If the substrate was composed of hard material that prevented the corer from penetrating to the target depth, then additional cores were collected from locations immediately adjacent to the randomly selected location to ensure we collected enough sediment for all planned analyses. In the field sediment cores were placed into a 20 L high-density polyethylene bucket, large visible organic matter was removed, and sediments were homogenized with a power drill fitted with a metal paint mixer. Sediment samples were kept on ice during transport to the laboratory and until laboratory processing was completed. In the laboratory sediment samples were divided in half and random selection was used to allocate one half of the sample for grain size and organic content analyses and the other half for measurements of nutrients, trace metals, and pesticides within the sediments.
Grain size and organic content samples were heated in an oven at 50 °C until the samples reached a constant weight (±1.0%). Sediments were sorted through three sieves (50.8 mm, 16.0 mm, 2.0 mm) using an automated shaker. Sediments retained in each sieve and collection pan were weighed. One 5 g subsample of the sediments that passed through the 2.0 mm sieve was used in laser diffraction particle size analysis to determine the percent of sand, silt and clay in each sample. We set the clay-silt break at 6 µm to enable comparisons of the laser diffraction particle size distribution with that obtained by the pipette method [30]. Additional details related to laser diffraction particle size analysis are provided in the Supplemental Text. A second 5 g subsample of the sediments that passed through the 2.0 mm sieve was used to determine loss-on-ignition percent organic content and was ashed in a muffle furnace for 16 hours at 375 °C, cooled to room temperature in a desiccator, and weighed. Our physical measurements resulted six physical characteristics (percent large gravel (16.0 to 50.8 mm), percent small gravel (2.0–15.9 mm), percent sand (0.053–1.99 mm), percent silt (0.002–0.053 mm), percent clay (<0.002 mm), loss-on-ignition percent organic content) from each sample. Additionally, we derived two additional physical characteristics from each sample by calculating grain size richness (number of grain sizes—large gravel, small gravel, sand, silt, clay) and grain size diversity using the Shannon Diversity Index [31] and the percent of each grain size.
Nutrient, trace metal, and pesticide samples were frozen until analyses. Frozen samples were thawed, the water was decanted, and the remaining sediment was freeze-dried. Freeze-dried sediment samples were sieved through a 2 mm sieve and stored at 4 °C until analyses. Electrical conductivity and pH measurements were made from a slurry of freeze-dried sediment and nanopore water. Total carbon and total nitrogen were measured from freeze-dried sediment with dry combustion using an elemental analyzer. Extractable ammonia-N and nitrate-N from potassium chloride extracted samples were quantified colorimetrically with a flow injection analyzer [32,33]. Concentrations of aluminum, calcium, copper, iron, potassium, magnesium, manganese, phosphorus, sulfur, and zinc were extracted with the Mehlich-3 solution [34] and measured with an inductively coupled optical emission spectrometer. 2,4-D (2,4-Dichlorophenoxyacetic acid), acetochlor, alachlor, atrazine, desethylatrazine, desisopropylatrazine, 2-hydroxyatrazine, clothianidin, methyl nitroguanidine, imidacloprid, malathion, s-metolachlor, and simazine were extracted using an accelerated solvent extractor [35], and their concentrations were measured with ultra-performance liquid chromatography. Details related to measurements of physicochemical, nutrients, trace metals and pesticides are provided in the Supplemental Text. In summary we measured 29 sediment chemistry characteristics in each sediment sample.

2.3. Macroinvertebrate Sampling

Macroinvertebrate sampling was also conducted twice a year in 2017 and 2018 for 28 days with Hester-Dendy (HD) and leaf pack (LP) samplers. Macroinvertebrate sampling was conducted in the spring of each year from June to July and began two weeks after the collection of spring sediment samples were completed. Macroinvertebrate sampling was conducted again from August to September of each year and was completed one week prior to fall sediment sampling. HD samplers consisted of 3 individual HD plate samplers attached to a cement block. LP samplers were composed of a 30 g of dried leaves having a 50:50 ratio of green ash (Fraxinus americanus) and white flowering dogwood (Cornus florida) leaves enclosed in 1.2 cm2 mesh netting. Three HD samplers and three LP samplers were placed within each segment. HD and LP samplers were distributed systematically throughout each 25 m long segment to ensure that at least one pair of HD and LP samplers was located at the downstream, middle, and upstream parts of each segment and located near the left, center, and right of the stream. Occasionally, segment specific conditions required minor deviations from our systematic placement of HD and LP samplers to ensure they remained submerged during low water levels. Samplers were inspected weekly during the 28 day period and repositioned as needed to ensure they remained submerged.
After the 28-day sampling period, all HD and LP samplers were collected and transported to the laboratory. In the laboratory, macroinvertebrate samples were preserved in 70% ethanol. Macroinvertebrates were counted and enumerated using a stereo microscope with a magnification range of 8 to 35 × and paired with an ocular piece with 10 × magnification. All insects except for Collembolla were identified to family level and non-insects and Collembolla were identified to phylum (Nematoda, Nematomorpha, Nemertea), class (Gastropoda, Turbellaria), sub-class (Collembolla, Hirudinea, Oligochaeta), or order (Amphipoda, Decapoda, Isopoda) using standard identification keys [36,37,38,39]. No subsampling procedures were used and all specimens from each sample were enumerated and identified.
We initially calculated 17 macroinvertebrate response variables (i.e., abundance (number of individuals), taxa richness, Shannon Diversity Index [31], Shannon Evenness Index [31], Reciprocal Berger-Parker Dominance Index [31], Hilsenhoff Biotic Index [40], percent EPT (Ephemeroptera, Plecoptera, Trichoptera), percent collector-filterers, percent collector-gatherers, percent predators, percent scrapers, percent shredders, percent parasites, percent omnivores, Invertebrate Community Index [41], percent Chironomidae, percent Gastropoda) from each randomly selected segment during each season in each year. We examined pairwise correlations among all response variables before statistical analysis to identify pairs of redundant response variables that exhibited Pearson correlation coefficients > 0.6 or <−0.6). Subsequently, we retained eight macroinvertebrate response variables that included: (1) abundance; (2) Shannon Diversity Index; (3) Reciprocal Berger-Parker Dominance Index; (4) percent collector-filterers; (5) percent scrapers; (6) percent Chironomidae; (7) Hilsenhoff Biotic Index; and (8) Invertebrate Community Index.

2.4. Statistical Analyses

We conducted PCA (principal components analysis) with the eight physical characteristics of sediment and a second PCA with the 20 chemical characteristics of sediment to obtain the PCA axes that represented the gradients of the sediment’s physical and chemical characteristics that occurred among our samples. Two physical PCA axes and three chemical PCA axes were retained for use in our linear mixed effect model analyses (more details about the PCA results are described in Section 3.1). Thus, our PCA analyses reduced the number of possible independent variables in our linear mixed effect model analyses of macroinvertebrate-sediment relationships from 28 to five. This reduction in the number of independent variables reduced the potential for multicollinearity that could have led to spurious results within our linear mixed effect model analyses. PCA was conducted with PC-ORD 5 for Windows [42].
Linear mixed effect model analysis was used to evaluate the relationships between sediment’s physical and sediment chemical characteristics. We also used linear mixed effect model analyses to evaluate the relationships of the eight macroinvertebrate community response variables with the physical and chemical characteristics of sediment. Linear mixed effect model analysis was chosen because it enabled us to address pseudoreplication that results from repeatedly sampling the same sites during our two-year study. For both linear mixed effect model analyses we used AIC (Akaike information criterion) to identify the best random effect for each response variable. For all response variables we evaluated the random effects of watershed, site, season, and year. We also included additive and nested variations of these individual random effects (i.e., 1|Year + 1|Site; 1|Watershed/Site, etc.) in our AIC analyses if the initial results from the VarCorr and isSingular functions from the lme4 package [43] indicated the linear mixed effect model could incorporate more complex random effects without singular fit and other convergence issues. AIC analyses were conducted with the AIC function from the stats package [44]. Once the best random effect for each response variable was identified, then we conducted linear mixed effect model analyses using the lmer function from the lmerTest package [45]. To evaluate the relationships between sediment’s physical and chemical characteristics we conducted linear mixed effect model analyses with the site scores of the three chemical PCA axes as the response variable and the site scores of the two physical PCA axes as the fixed effect. To evaluate the relationships of macroinvertebrate communities with the physical and chemical characteristics of sediment, we conducted linear mixed effect model analyses with the eight macroinvertebrate response variables and the site scores of the two physical PCA axes and the three chemical PCA axes as the fixed effects. We used the cor.test function from the stats package [44] to assess if the two physical PCA axes and the three chemical PCA axes exhibited multicollinearity (i.e., correlation coefficients > 0.6 or <−0.6) within our macroinvertebrate analyses. For all linear mixed effect model analyses, we evaluated the normality of the model residuals with the qqPlot function from the car package [46] and the Shapiro–Wilks test using the shapiro.test function from the stats package [44]. We also assessed the homogeneity of the model residuals by examining plots of the model residuals and the fitted values. Models that did not meet the normality and/or homogeneity assumptions were rerun using either log(x+1) (abundance, Shannon Diversity Index, Hilsenhoff Biotic Index) or arcsine square root transformation (percent collector-filterers, percent scrapers) of the macroinvertebrate response variables. The significance level for all statistical tests was p < 0.05. All statistical tests associated with linear mixed effect model analyses were performed with RStudio [47] and R version 3.6.2 [44].

3. Results

3.1. Physical and Chemical Results

Our site averages of the percent of each substrate type indicated that sand was the dominant substrate type in SJR sites and the UBWC sites were dominated by either small gravel or silt (Table 2). The similarity in grain size richness indicates that the variation in grain size diversity values are likely related to differences in the percentages of different sediment sizes among sediment samples rather than the differences in grain size richness among sediment samples. Additionally, our site averages of grain size diversity are only 8% to 24% less than the maximum possible grain size diversity value for our sites (i.e., ln(5) = 1.61) [31], which suggests our grain size diversity values are fairly high.
Grand mean pH was 7.71 and site averages ranged from 6.94 to 8.18 (Table 3), which indicated neutral to slightly basic conditions within the sediments. Calcium concentrations exhibited the greatest site averages of the seven nutrients measured (Table 3 and Table 4). Overall, trace metal measurements suggest that our sites are not heavily contaminated with trace metals (Table 4). Iron exhibited the greatest site averages and copper and zinc exhibited the least site averages (Table 4). Of the 13 pesticide and pesticide metabolites measured, only three herbicides and one herbicide metabolite were detected within the sediments (Table 4). The atrazine metabolite 2-hydroxyatrazine exhibited the greatest site averages of the four detected herbicides and metabolites and simazine exhibited the least site averages (Table 4).
The PCA of the physical characteristics resulted in two axes that describe the trends in physical characteristics among sediment samples (Supplementary Table S1). The first two physical PCA axes were greater than the broken stick eigenvalues and accounted for 76% of the variance within the physical characteristic data set (Supplementary Table S1). The first physical PCA axis was a gradient of percent small gravel and silt, where increasing site scores indicated increases in percent small gravel and decreases in percent silt (Supplementary Table S1). The second physical PCA axis represents a gradient of grain size diversity and percent sand, where increasing site scores indicate increases in grain size diversity and decreases in percent sand (Supplementary Table S1).
The PCA of the chemical characteristics resulted in three axes that describe the trends in chemical characteristics among sediment samples (Supplementary Table S2). The three PCA axes were greater than the broken stick eigenvalues and accounted for 62% of the variance in the chemical characteristics data set (Supplementary Table S2). The first chemical PCA axis was a gradient of potassium, magnesium, and percent total nitrogen, where decreases in site scores indicated increases in potassium concentrations, magnesium concentrations, and percent total nitrogen (Supplementary Table S2). The second chemical PCA axis was a gradient of simazine and calcium concentrations, where increases in site scores indicated increases in simazine concentrations and decreases in calcium concentrations (Supplementary Table S2). The third chemical PCA axis was a gradient of copper and nitrate-N concentrations, where increasing site scores indicated decreases in copper and nitrate-N concentrations (Supplementary Table S2).
The site scores of the first chemical PCA axis were significantly correlated (p < 0.001) with the site scores of the first physical PCA axis (Supplementary Table S3), which indicated that increases in percent small gravel and decreases in percent silt within our sediment samples corresponded with decreases in potassium concentrations, magnesium concentrations, and percent total nitrogen (Figure 1). The first chemical PCA axis site scores were not correlated (p = 0.265) with the site scores from the second physical PCA axis (Supplementary Table S3). Additionally, no significant correlations (p > 0.318) were found between the site scores of the second and third chemical PCA axes with the site scores of the first and second physical PCA axes (Supplementary Table S3). The correlation coefficient from the Pearson correlation test between the site scores of the first chemical PCA axis and the site scores of the first physical PCA axis was >0.6 (r = 0.699, p < 0.001). The correlation coefficient from the Pearson correlation test between the site scores of the second chemical PCA axis and the site scores of the second physical PCA axis was also >0.6 (r = 0.639, p < 0.001). These correlation results indicated that moderate multicollinearity between these two pairs of fixed effects is present within our multivariate macroinvertebrate models. No other pair of fixed effects exhibited correlation coefficients > 0.60 or <−0.60.

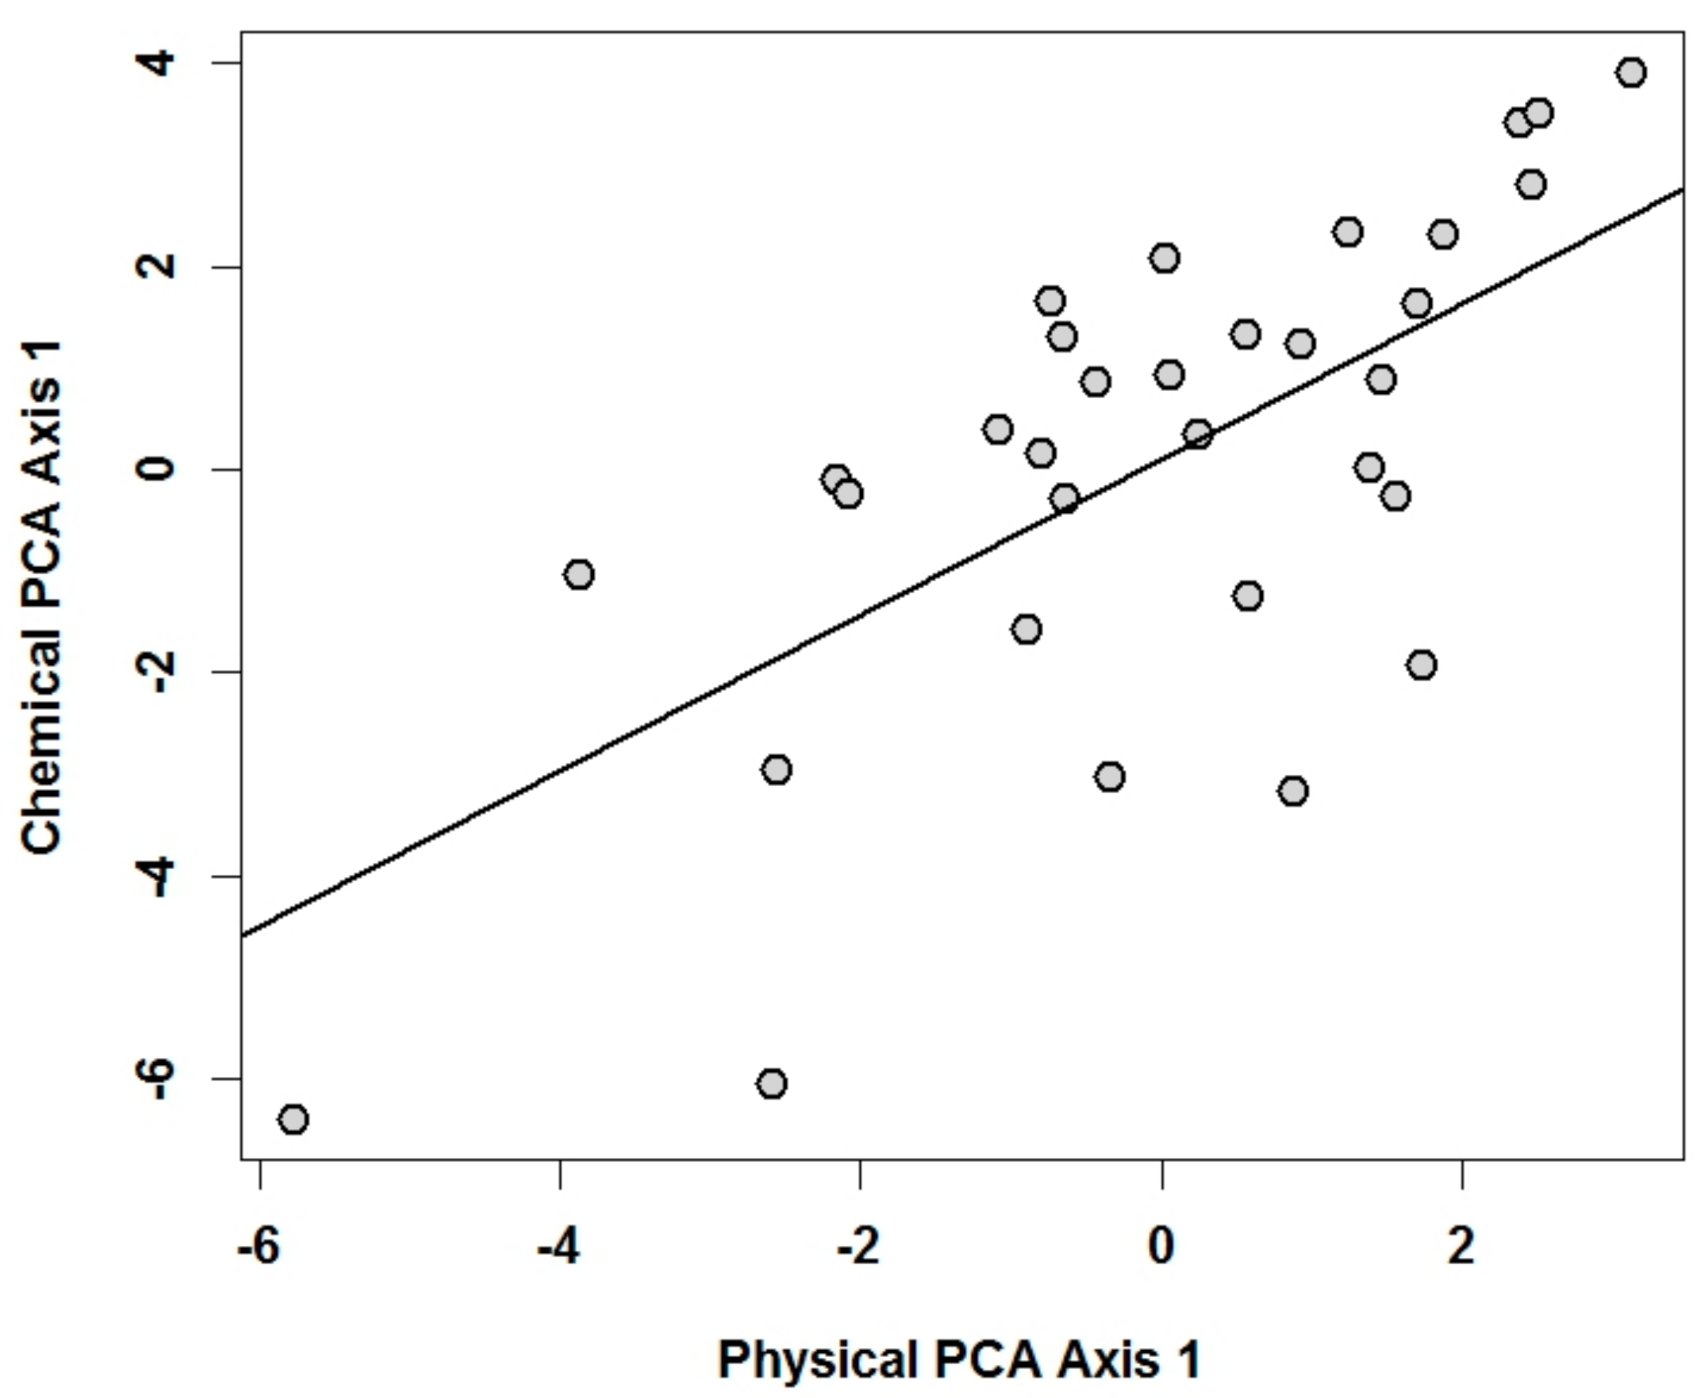
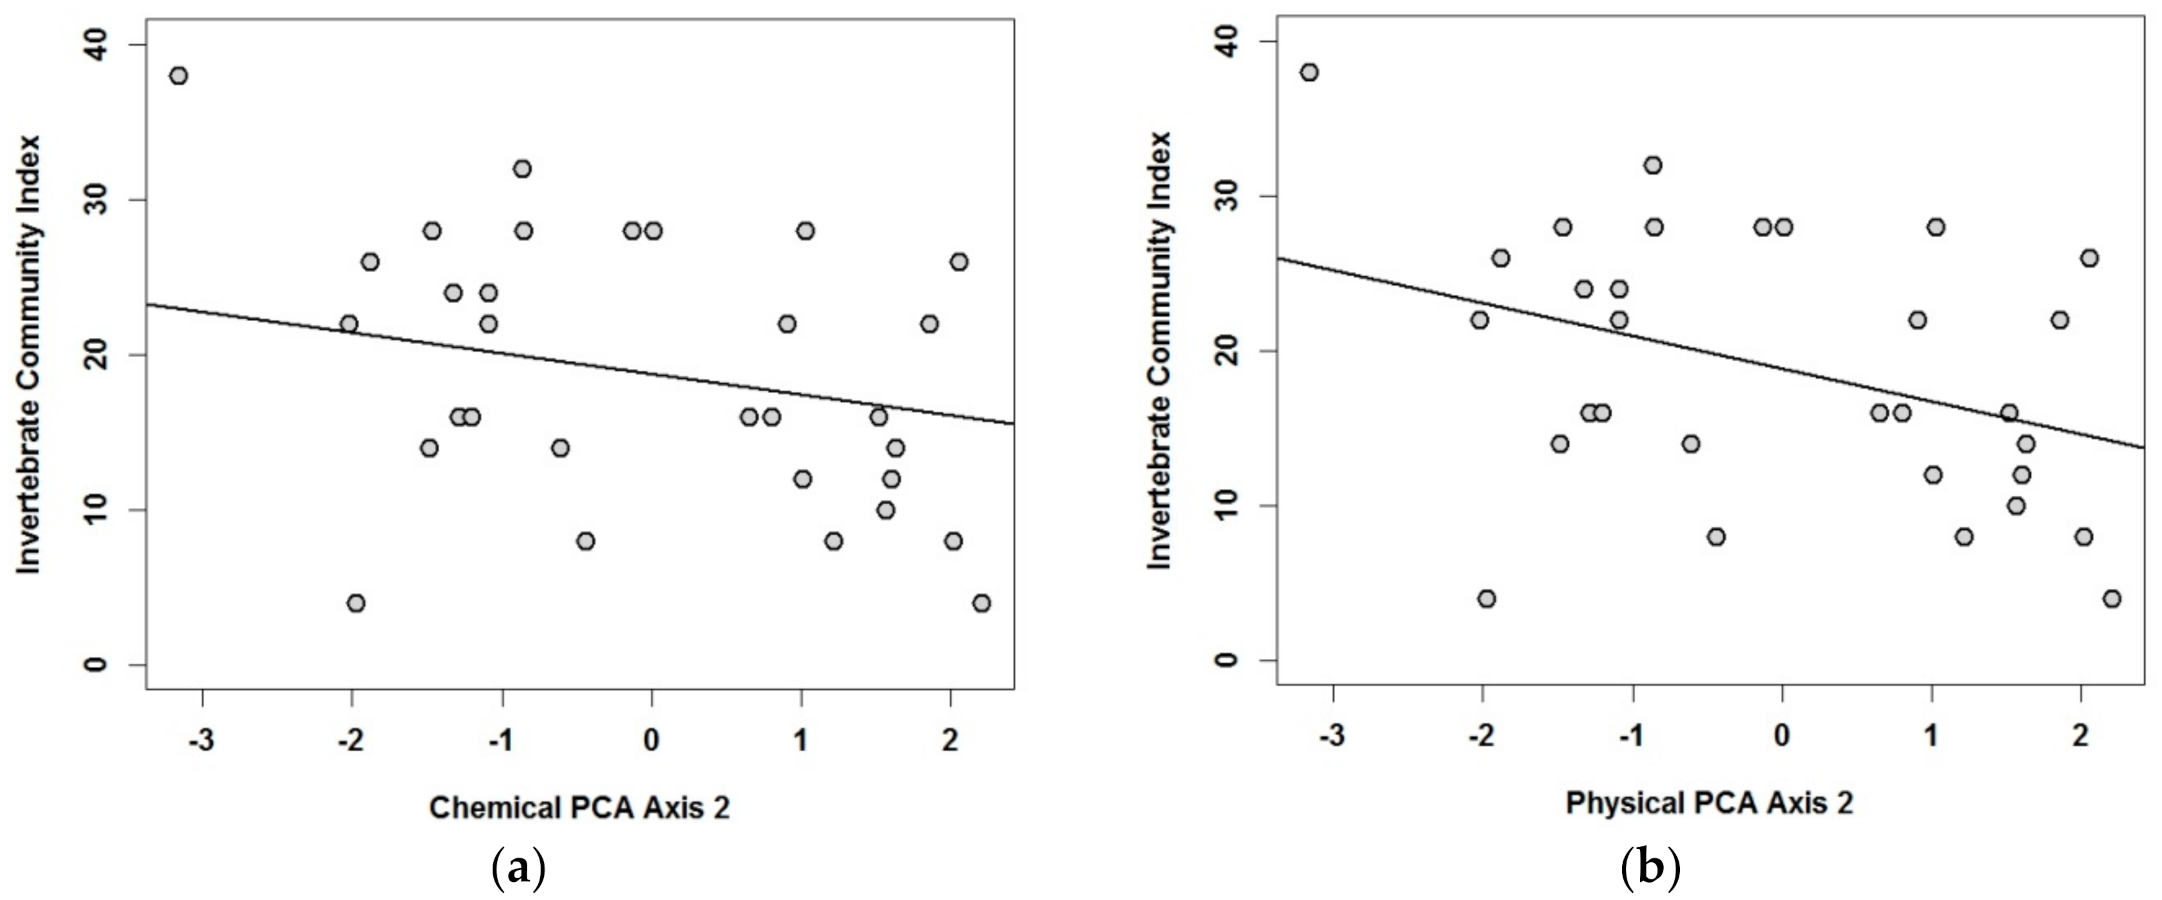
3.2. Relationships of Macroinvertebrate Communities with Sediment’s Physical and Chemical Characteristics

We documented 57 macroinvertebrate taxa from 20,160 individuals during our two-year study (Supplementary Table S4). The five most abundant taxa consisted of Chironomidae, Gastropoda, Elmidae, Amphipoda, and Turbellaria and constituted slightly over 70% of all captures (Supplementary Table S4). Chironomidae comprised over 40% of all individuals (Supplementary Table S4). Macroinvertebrate abundance ranged from 100 to 4002 individuals with a grand mean of 1211.7 individuals from all samples. The Hilsenhoff Biotic Index indicated an overall rating of fairly poor (grand mean 5.86) and ratings ranged from very poor (7.40) to excellent (2.90). Invertebrate Community Index scores indicated an overall rating of fair (grand mean 18.81) with ratings ranging from poor (4) to good (38).
We conducted additional linear mixed effect model analyses to assess the potential influence of the moderate amounts of multicollinearity between the first physical and chemical PCA axes and between the second physical and chemical PCA axes on the macroinvertebrate-sediment relationships observed in the full model containing all five fixed effects. Specifically, we conducted the linear mixed effect model analyses with just the site scores of the three chemical PCA axes (i.e., linear mixed effect model analyses with three fixed effects) and just the site scores of the two physical PCA axes (i.e., linear mixed effect model analyses with two fixed effects). We found that the fixed effect estimates and their associated p values from the full model (Supplementary Table S5) differed from the fixed effect estimates and their associated p values from the reduced chemical and physical models (Supplementary Table S6, Supplementary Table S7). These changes in results that occurred with removing the multicollinearity from the models confirm that the moderate amounts of multicollinearity in our full model affected the results and these results may be spurious. Therefore, we report the linear mixed effect model analysis results with the site scores of the three chemical PCA axes (Supplementary Table S6) and the site scores of the two physical PCA axes (Supplementary Table S7).
Invertebrate Community Index scores were significantly correlated (p < 0.015) with the site scores of the second chemical PCA axis (Supplementary Table S6) and the site scores of the second physical PCA axis (Supplementary Table S7). Invertebrate Community Index scores were negatively correlated (p = 0.014) with increasing simazine concentrations and decreasing calcium concentrations in the sediment and were negatively correlated (p = 0.007) with increasing grain size diversity and decreasing percent sand (Figure 2). Macroinvertebrate abundance, Shannon Diversity Index, the Reciprocal Berger–Parker Dominance Index, percent collector-filterers, percent scrapers, percent Chironomidae, and Hilsenhoff Biotic Index scores were not significantly correlated (p ≥ 0.050) with the three chemical PCA axes (Supplementary Table S6) or the two physical PCA axes (Supplementary Table S7).

4. Discussion

Sediments within most sites were dominated by sand or silt. pH levels were suitable for macroinvertebrates and nitrate, atrazine, metolachlor, simazine, copper, and zinc concentrations observed were below concentration levels anticipated to affect macroinvertebrate survival. Sediment quality benchmarks are not available for inorganic forms of nitrogen that can negatively impact macroinvertebrates [48]. All site averages and minimum values for ammonia-N were greater than 1.21 mg/kg and all minimum site concentrations of ammonia-N, except one site (CLG), were greater than 1.9 mg/kg. At a pH of 7 and water temperature of 20 °C the Indiana aquatic life benchmark for ammonia-N is 1.21 mg/L [49] and the national aquatic life benchmark for ammonia-N is 1.9 mg/L [50], which suggests ammonia concentrations in the sediments may not be suitable for macroinvertebrates. All site averages and maximum values of nitrate-N were below 2.0 mg/kg and 2.0 mg/L is the maximum recommended allowable nitrate-N concentration for protecting sensitive freshwater organisms from nitrate pollution [51]. We acknowledge that comparisons of sediment concentrations to water concentrations are tenable, but these comparisons serve as a screening tool and highlight the need for establishing ammonia and nitrate sediment quality benchmarks. Copper and zinc concentrations from our study never exceeded 1 mg/kg and were well below their sediment quality benchmarks [52] and average concentrations observed by Moran et al. [15] in 99 streams in the Midwestern United States. Our documentation of herbicides in the sediments is consistent with Pappas and Smith [53] who confirmed the presence of atrazine, metolachlor, and glyphosate in the sediments of one of our SJR sites. Our herbicide results were also consistent with Moran et al. [15], who documented that atrazine, metolachlor, and simazine concentrations were below their sediment quality benchmarks in agricultural streams in the Midwestern United States. Additionally, we documented that increases in nutrients occurred with increases in fine sediments, which aligns with expected association between nutrients and fine sediments in agricultural streams [12].
We also found that the Invertebrate Community Index was influenced by a chemical gradient of a herbicide and a nutrient and a physical gradient of percent sand and substrate heterogeneity, which highlights the joint influence of chemical and physical characteristics of sediment on macroinvertebrates within agricultural headwater streams in the Midwestern United States. Although simazine concentrations in the sediment were below sediment quality benchmark levels for macroinvertebrates, we documented decreases in Invertebrate Community Index scores with increasing simazine concentrations and decreasing calcium concentrations in the sediments. Past laboratory bioassays have documented the toxicity of simazine on macroinvertebrates [54]. Lethal effects have occurred in water concentrations as low as 20 µg/L [55], which is below the chronic macroinvertebrate aquatic life benchmark of 40 µg/L for simazine [56]. Other triazine herbicides at concentrations below the aquatic life benchmarks have decreased diversity, decreased abundance, and changed the timing of adult emergence [18,19]. However, our results differ from these results because we observed reductions in macroinvertebrate biotic integrity to a chemical gradient of increasing simazine concentrations and decreasing calcium concentrations, not increasing simazine concentrations alone or decreasing calcium concentrations alone. In SJR and UBWC we also observed decreases in amphibian diversity and abundance with a chemical gradient of increasing acetochlor concentrations and decreasing nitrate + nitrite concentrations (i.e., combined concentration of nitrate and nitrite) in the water [25]. Others [18,19] have noted that triazine herbicides may have indirect effects on macroinvertebrates by reducing food resources and/or loss of aquatic plants that are an important habitat resource. Calcium is an important nutrient for insects and plants [57,58]. Our results suggest an indirect effect of simazine and calcium where increases in simazine and decreases in calcium may have reduced algae and macrophytes, which contributed to decreased Invertebrate Community Index scores.
The observed decreases in Invertebrate Community Index scores with increasing grain size diversity and decreasing percent sand were unexpected because others have documented increases in diversity, abundance, and increases in the abundance of sediment-sensitive taxa with increases in grain size diversity and/or decreases in fine sediments [1,59,60,61]. Additionally, Hrodey et al. [62] documented that decreases in Invertebrate Community Index scores with increasing fine sediment in Indiana warmwater streams were best predicted by the substrate scores of the Qualitative Habitat Evaluation Index, which is based on substrate richness, dominance of large substrate types, amount of silt, and degree of embeddedness. Our Pearson correlation tests found that increases in grain size diversity and decreases in percent sand were associated with increases in simazine concentrations and decreases in calcium concentrations. Thus, we conclude that our results indicate a combined effect of grain size diversity, percent sand, simazine concentrations, and calcium concentrations on Invertebrate Community Index scores.
The relationships between physical and chemical characteristics of sediment also reflect differences in habitat conditions between watersheds as UBWC sites exhibited greater simazine concentrations, lower calcium concentration, greater grain size diversity, and lower percent sand than SJR sites (Table 2). These trends in physical and chemical characteristics of sediment between SJR and UBWC may be reflective of the difference in size between watersheds as SJR sites had larger watershed sizes than UBWC sites (Table 1). Invertebrate Community Index scores were positively correlated with watershed size in Ohio [63]. Thus, watershed size may be an underlying factor influencing our macroinvertebrate-sediment relationships. Piliere et al. [63] found that Invertebrate Community Index scores in Ohio streams were influenced by a combination of physical habitat quality, pH, and nutrients in the water. Sanders et al. [26] documented that fish community structure in SJR and UBWC was correlated with instream habitat and watershed size and that instream habitat and watershed size were correlated with each other. Our findings and those of Piliere et al. [63] and Sanders et al. [26] confirm that macroinvertebrate and fish–habitat relationships in agricultural watersheds in the Midwestern United States are complex and influenced by correlated habitat factors. Despite the potential influence of watershed size on our results, the association of macroinvertebrate biotic integrity with simazine and calcium concentrations is not likely influenced by watershed size. Subsequently, the potential remains that macroinvertebrate responses to the combined changes in simazine and calcium may be an indirect effect.
Given the importance of physical and chemical characteristics of sediment on macroinvertebrates we were surprised that only one of eight macroinvertebrate response variables exhibited a significant correlation with sediment characteristics. Longing et al. [64] also observed a limited macroinvertebrate response to increasing particle size, percent fine sediment, and percent embeddedness within second- and third-order streams in a national forest in Georgia (United States). We postulate our limited macroinvertebrate responses to sediment characteristics is a result of: (1) Chironomidae dominance; (2) reach scale sampling; (3) small sample size; or (4) a combination of these factors. Our sites were numerically dominated by Chironomidae, which is consistent with others evaluating macroinvertebrate-habitat relationships in agricultural streams in the Midwestern United States [59,60,61,62]. Many of the well-documented macroinvertebrate responses to agriculture induced changes in sediment composition involved reductions in the sediment sensitive taxa, and not changes in the abundance of Chironomidae and other tolerant taxa. Some investigators omitted Chironomidae from their assessments of macroinvertebrate responses to sedimentation [65] likely due to its insensitivity to physical characteristics of sediment. Longing et al. [64] conducted reach scale sampling of sediment and macroinvertebrates from multiple microhabitat types over a 100 m reach. We also used reach scale sampling to collect macroinvertebrates and sediment from multiple microhabitat types over a 25 m reach. Longing et al. [64] suggested that the compositing of information from multiple microhabitat types might limit the ability to detect macroinvertebrate responses to sediment characteristics. We concur with this suggestion because macroinvertebrates within different microhabitats can respond differently to disturbances [66]. Thus, agriculturally-induced sediment disturbances might affect macroinvertebrates differently in microhabitats dominated by larger sediment sizes (riffles) than microhabitats dominated by fine sediments (pools). Although we purposefully selected streams to ensure a gradient of physical and chemical characteristics of sediment, our sampling was only conducted in eight streams. Sampling more streams over a larger area would increase the variation in physical and chemical characteristics of sediment and increase the sample size, which would increase the probability of detecting a statistically significant macroinvertebrate response.
In conclusion, our measurements of nutrients, trace metals, and pesticides provided a comprehensive assessment of the sediment conditions within our study streams that indicated that concentrations of trace metals and herbicides were below established sediment quality benchmarks for macroinvertebrates. Our results, a previous study in SJR [53], and a regional Midwestern United States study [15] suggest the potential for herbicide accumulation within the sediments of agricultural headwater streams. As a precaution we recommend that watershed managers, soil and water district personnel, and farmers limit channel maintenance activities within channelized agricultural headwater streams to periods when discharge is below baseflow to reduce the potential of downstream transport of sediment-bound herbicides. Additionally, our novel assessment of the relationships of macroinvertebrate communities with physical and chemical characteristics of sediment in agricultural headwater streams in Indiana, Michigan, and Ohio found that macroinvertebrate biotic integrity was influenced by a herbicide and nutrient gradient and a physical gradient of substrate heterogeneity and percent sand. To our knowledge we are the first to assess the responses of macroinvertebrates to both physical and chemical characteristics of sediment. Our observed macroinvertebrate-sediment relationships suggest that watershed management plans need to address physical and chemical degradation within agricultural headwater streams in the Midwestern United States.

Supplementary Materials

The following are available online at https://www.mdpi.com/2073-4441/12/11/2976/s1: Supplementary Text: Additional details related to laser diffraction particle size, physicochemical, nutrient, trace metal, and pesticide analyses. Table S1: Loadings from principal components analysis of physical characteristics of sediment from eight agricultural headwater streams in Indiana, Michigan, and Ohio. Table S2: Loadings from principal components analysis (PCA) of 20 chemical characteristics of sediment from eight agricultural headwater streams in Indiana, Michigan, and Ohio. Table S3: Best identified random effect and p values from linear mixed effect model analysis of the relationships of site scores from the first three principal components axes of chemical characteristics and the first two principal components axes of physical characteristics of sediment within eight agricultural headwater streams in Indiana, Michigan, and Ohio. Table S4: Number of individuals and relative abundances (percent) of aquatic macroinvertebrates captured from eight agricultural headwater streams in Indiana, Michigan, and Ohio. Table S5: Best identified random effect and p values from linear mixed effect model analysis of the macroinvertebrate-sediment relationships within eight agricultural headwater streams in Indiana, Michigan, and Ohio. Table S6: Best identified random effect and p values from linear mixed effect model analysis of the relationships of macroinvertebrate community response variables with chemical characteristics of sediment within eight agricultural headwater streams in Indiana, Michigan, and Ohio. Table S7: Best identified random effect and p values from linear mixed effect model analysis of the relationships of macroinvertebrate community response variables physical characteristics of sediment within eight agricultural headwater streams in Indiana, Michigan, and Ohio. Figure S1: Map depicting the locations of sampling sites in the Saint Joseph River watershed, Indiana and Michigan. Figure S2: Map depicting the locations of sampling sites in Upper Big Walnut Creek watershed in Ohio. Figure S3: Depiction of stratified random sampling scheme used for collecting sediment samples.

Author Contributions

T.C.S. and R.B.G. conceptualized the research. T.C.S., R.B.G., P.C.S.J. and J.M.G. contributed to developing the sampling design, field sampling methods, and laboratory methods. T.C.S. conducted the field work and T.C.S. and J.M.G. performed the laboratory measurements. T.C.S. and P.C.S.J. statistically analyzed the data. T.C.S., R.B.G., P.C.S.J. and J.M.G. were involved with writing, reviewing, and editing the manuscript. All authors have read and agreed to the published version of the manuscript.

Funding

This research was funded in part by the USDA Conservation Effects Assessment Project.

Acknowledgments

We thank Jordan Marshall for the review of an earlier draft of this manuscript and his guidance on statistical analyses. We thank the numerous current and past USDA-ARS National Soil Erosion Laboratory, USDA-ARS Soil Drainage Research Unit, and Purdue University Fort Wayne personnel for their assistance with collecting water samples and laboratory measurements of nutrients and pesticides. We thank Darren Shoemaker, Deanne Jensen, Roxanne Anderson, Kaitlyn Scott, and Joe Bevan for their help with collecting sediment and macroinvertebrate samples. We thank Janae Bos, Brenda Hoffman, Roxanne Anderson, and Kaitlyn Scott for their help with laboratory measurements of chemical and physical characteristics of sediment. Additionally, we are grateful for Deanne Jensen’s help with macroinvertebrate identifications and Heather Fair’s assistance with principal components analyses. Landowner and site information were provided by Soil and Water Conservation and NRCS districts in Delaware (Ohio), Morrow (Ohio), Allen (Indiana), Dekalb (Indiana), and Noble (Indiana) Counties. We are also grateful to the landowners who provided access to the sites.

Conflicts of Interest

The authors declare no conflict of interest.

References

  1. Vinson, M.R.; Hawkins, C.P. Biodiversity of stream insects: Variation at local, basin, and regional scales. Annu. Rev. Entomol. 1998, 43, 271–293. [Google Scholar] [CrossRef] [Green Version]
  2. Turley, M.D.; Bilotta, G.S.; Chadd, R.P.; Extence, C.A.; Brazier, R.E.; Burnside, N.G.; Pickwell, A.G.G. A sediment-specific family level biomonitoring tool to identify the impacts of fine sediment in temperate rivers and streams. Ecol. Indic. 2016, 70, 151–165. [Google Scholar] [CrossRef] [Green Version]
  3. Cummins, K.W.; Lauff, G.H. The influence of particle size on the microdistribution of stream macrobenthos. Hydrobiologia 1969, 34, 145–181. [Google Scholar] [CrossRef]
  4. Southwood, T.R.E. Habitat, the templet for ecological strategies. J. Anim. Ecol. 1977, 46, 337–365. [Google Scholar] [CrossRef]
  5. Minshall, G.W. Aquatic insect substratum relationships. In The Ecology of Aquatic Insects; Resh, V.H., Rosenberg, D.M., Eds.; Praeger: New York, NY, USA, 1984; pp. 358–400. [Google Scholar]
  6. Jowett, I. A method for objectively identifying pool, run, and riffle habitats from physical measurements. N. Zealand J. Mar. Freshw. Res. 1993, 27, 241–248. [Google Scholar] [CrossRef]
  7. Haeur, C.; Leitner, P.; Unfer, G.; Pulg, U.; Habersack, H.; Graf, W. The role of sediment and sediment dynamics in the aquatic environment. In Riverine Ecosystem Management; Schumutz, S., Sendzimir, J., Eds.; Springer: Cham, Switzerland, 2018; pp. 151–169. [Google Scholar]
  8. Townsend, C.R.; Scarsbrook, M.R. Quantifying disturbance in streams: Alternative measures of disturbance in relation to macroinvertebrate species traits and species richness. J. N. Am. Benthol. Soc. 1997, 16, 531–544. [Google Scholar] [CrossRef]
  9. Lepori, F.; Hjerdt, N. Disturbance and aquatic biodiversity: Reconciling contrasting views. Bioscience 2006, 56, 809–818. [Google Scholar] [CrossRef]
  10. Burdon, F.J.; McIntosh, A.R.; Harding, J.S. Habitat loss drives threshold response of benthic invertebrate communities to deposited sediment in agricultural streams. Ecol. Appl. 2013, 23, 1036–1047. [Google Scholar] [CrossRef]
  11. Wood, P.J.; Armitage, P.D. Biological effects of fine sediment in the lotic environment. Environ. Manag. 1997, 21, 203–217. [Google Scholar] [CrossRef] [PubMed]
  12. Jones, J.L.; Murphy, J.F.; Collins, A.L.; Sear, D.A.; Naden, P.S.; Armitage, P.D. The impact of fine sediment on macro-invertebrates. River Res. Appl. 2012, 28, 1055–1071. [Google Scholar] [CrossRef]
  13. Lemly, A.D. Modification of benthic insect communities in polluted streams: Combined effects of sedimentation and nutrient enrichment. Hydrobiologia 1982, 87, 229–245. [Google Scholar] [CrossRef]
  14. Megahan, W.F. Sediment pollution. In Environmental Geology. Encyclopedia of Earth Science; Springer: Dordrecht, The Netherlands, 1999. [Google Scholar]
  15. Moran, P.W.; Nowell, L.H.; Kemble, N.E.; Mahler, B.J.; Waite, I.R.; Van Metre, P.C. Influence of sediment chemistry and sediment toxicity on macroinvertebrate communities across 99 wadeable streams of the Midwestern USA. Sci. Total Environ. 2017, 2017, 1469–1478. [Google Scholar] [CrossRef] [PubMed]
  16. Moran, P.W.; Kemble, N.E.; Waite, I.R.; Mahler, B.J.; Nowell, L.H.; Van Metre, P.C. Legacy and current-use contaminants in sediments alter macroinvertebrate communities in southeastern US streams. Environ. Toxicol. Chem. 2020, 39, 1219–1232. [Google Scholar] [CrossRef] [PubMed]
  17. Burton, G.A., Jr. Sediment quality criteria in use around the world. Limnology 2002, 3, 65–75. [Google Scholar] [CrossRef]
  18. Dewey, S.L. Effects of the herbicide atrazine on aquatic insect community structure and emergence. Ecology 1986, 67, 148–162. [Google Scholar] [CrossRef]
  19. Huber, W. Ecotoxicological relevance of atrazine in aquatic systems. Environ. Toxicol. Chem. 1993, 12, 1865–1881. [Google Scholar] [CrossRef]
  20. Riseng, C.M.; Wiley, M.J.; Black, R.W.; Munn, M.D. Impacts of agricultural land use on biological integrity: A causal analysis. Ecol. Appl. 2011, 21, 3128–3146. [Google Scholar] [CrossRef] [Green Version]
  21. Clements, W.H.; Kahsian, D.R.; Kiffney, P.M.; Zuellig, R.E. Perspectives on the context-dependency of stream community responses to contaminant. Freshw. Biol. 2016, 61, 2162–2170. [Google Scholar] [CrossRef]
  22. Wohl, E.; Bledsoe, B.P.; Jacobson, R.B.; Poff, N.L.; Rathburn, S.L.; Walters, D.M.; Wilcox, A.C. The natural sediment regime in rivers: Broadening the foundation for ecosystem management. BioScience 2015, 65, 358–371. [Google Scholar] [CrossRef] [Green Version]
  23. Smiley, P.C., Jr.; Gillespie, R.B. Influence of physical habitat and agricultural contaminants on fishes within agricultural drainage ditches. In Agricultural Drainage Ditches: Mitigation Wetlands for the 21st Century; Moore, M.T., Kroger, R., Eds.; Research Signpost: Kerala, India, 2010; pp. 37–73. [Google Scholar]
  24. Smiley, P.C., Jr.; Gillespie, R.B.; King, K.W.; Huang, C.H. Contribution of habitat and water quality to the integrity of fish communities in agricultural drainage ditches. J. Soil Water Conserv. 2008, 63, 218A–219A. [Google Scholar] [CrossRef]
  25. Jordan, M.A.; Castañeda, A.; Smiley, P.C., Jr.; Gillespie, R.B.; Smith, D.R.; King, K.W. Influence of instream habitat and water chemistry on amphibians in channelized agricultural headwater streams. Agric. Ecosyst. Environ. 2016, 230, 87–97. [Google Scholar] [CrossRef] [Green Version]
  26. Sanders, K.E.; Smiley, P.C., Jr.; Gillespie, R.B.; King, K.W.; Smith, D.R.; Pappas, E.A. Conservation implications of fish-habitat relationships in channelized agricultural headwater streams. J. Environ. Qual. 2020. [Google Scholar] [CrossRef]
  27. Wood, T.C.; Smiley, P.C., Jr.; Gillespie, R.B.; Gonzalez, J.M.; King, K.W. Injury frequency and severity in crayfish communities as indicators of physical habitat quality and water quality within agricultural headwater streams. Environ. Monit. Assess. 2020, 192, 227. [Google Scholar] [CrossRef] [PubMed]
  28. St Joseph River Watershed Initiative. St. Joseph River Watershed Management Plan; St. Joseph River Watershed Initiative: Fort Wayne, IN, USA, 2006. [Google Scholar]
  29. Ohio EPA. Total Maximum Daily Loads for the Big Walnut Creek Watershed; Final Report; Division of Surface Water, State of Ohio Environmental Protection Agency: Columbus, OH, USA, 2005. [Google Scholar]
  30. Miller, B.A.; Schaetzl, R.J. Precision of soil particle size analysis using laser diffractometry. Soil Sci. Soc. Am. J. 2012, 76, 1719–1727. [Google Scholar] [CrossRef] [Green Version]
  31. Magurran, A.E. Ecological Diversity and Its Measurement; Croom Helm: London, UK, 1988. [Google Scholar]
  32. Hofer, S. Determination of Ammonia (Salicylate) in 2 M KCl Soil Extracts by Flow Injection Analysis; QuikChem Method 12-107-06-2-A; Lachat Instruments: Loveland, CO, USA, 2003. [Google Scholar]
  33. Knepel, K. Determination of Nitrate in 2M KCl Soil Extracts by Flow Injection Analysis; QuikChem Method 12-107-04-1-B; Lachat Instruments: Loveland, CO, USA, 2003. [Google Scholar]
  34. Mehlich, A. Mehlich 3 soil test extractant: A modification of Mehlich 2 extractant. Commun. Soil Sci. Plant Anal. 1984, 15, 1409–1416. [Google Scholar] [CrossRef]
  35. Vonberg, D.; Hofmann, D.; Vanderborght, J.; Lelickens, A.; Köppchen, S.; Pütz, T.; Burauel, P.; Vereecken, H. Atrazine soil core residue analysis from an agricultural field 21 years after its ban. J. Environ. Qual. 2014, 43, 1450–1459. [Google Scholar] [CrossRef] [PubMed]
  36. Brinkhurst, C.; McCormick, S.; Williamson, S. The Bug Book: A Guide to the Identification of Common Aquatic Benthic Macroinvertebrate Families of California and Western North America; Friends of Deer Creek: Nevada City, CA, USA, 2009. [Google Scholar]
  37. Merrit, R.W.; Cummins, K.W. An Introduction to the Aquatic Insects of North America; Kendall/Hunt: Dubuque, IA, USA, 1996. [Google Scholar]
  38. Merritt, R.W.; Cummins, K.W.; Berg, M.B. An Introduction to the Aquatic Insects of North America; Kendall/Hunt Publishing Company: Dubuque, IA, USA, 2008. [Google Scholar]
  39. Thorp, J.H.; Rogers, D.C. Field Guide to Freshwater Invertebrates of North America; Academic Press: Oxford, UK, 2011. [Google Scholar]
  40. Hilsenhoff, W.L. Rapid field assessment of organic pollution with a family-level biotic index. J. N. Am. Benthol. Soc. 1988, 7, 65–68. [Google Scholar] [CrossRef]
  41. Ohio EPA. Biological Criteria for the Protection of Aquatic Life. Volume II; State of Ohio Environmental Protection Agency: Columbus, OH, USA, 1988. [Google Scholar]
  42. McCune, B.; Mefford, M.J. PC-ORD. Multivariate Analysis of Ecological Data; Version 5.0 for Windows; MjM Software: Gleneden Beach, OR, USA, 2006. [Google Scholar]
  43. Bates, D.; Mächler, M.; Bolker, B.; Walker, S. Fitting linear mixed-effects models using lme4. J. Stat. Softw. 2015, 6, 1–48. [Google Scholar]
  44. R Core Team. R: A Language and Environment for Statistical Computing; Foundation for Statistical Computing: Vienna, Austria, 2020. [Google Scholar]
  45. Kuznetsova, A.; Brockhoff, P.B.; Christensen, R.H.B. lmerTest package: Tests in linear mixed effects models. J. Stat. Softw. 2017, 82, 1–26. [Google Scholar] [CrossRef] [Green Version]
  46. Fox, J.; Weisberg, S. An R Companion to Applied Regression; Sage: Thousand Oaks, CA, USA, 2019. [Google Scholar]
  47. RStudio Team. RStudio: Integrated Development for R; RStudio, PBC: Boston, MA, USA, 2020. [Google Scholar]
  48. Carmago, J.A.; Alonso, A. Ecological and toxicological effects of inorganic nitrogen pollution in aquatic ecosystems: A global assessment. Environ. Int. 2006, 32, 831–849. [Google Scholar]
  49. Indiana Legislative Services Agency. Indiana Administrative Code. 327 IAC 2-1.5-8. 2020. Available online: http://www.in.gov/legislative/iac/ (accessed on 2 September 2020).
  50. US EPA. Aquatic Life Ambient Water Quality Criteria for Ammonia—Freshwater; Report Number EPA-822-R-13-001; U.S. Environmental Protection Agency: Washington, DC, USA, 2013.
  51. Carmago, J.A.; Alonso, A.; Salamanca, A. Nitrate toxicity to aquatic animals: A review with new data for freshwater invertebrates. Chemosphere 2005, 38, 1255–1267. [Google Scholar]
  52. MacDonald, D.D.; Ingersoll, C.G.; Berger, T.A. Development and evaluation of consensus-based sediment quality guidelines for freshwater ecosystems. Arch. Environ. Contam. Toxicol. 2000, 39, 20–31. [Google Scholar] [CrossRef] [PubMed]
  53. Pappas, E.A.; Smith, D.R. Effects of dredging an agricultural drainage ditch on water column herbicide concentration, as predicted by fluvarium techniques. J. Soil Water Conserv. 2007, 62, 262–268. [Google Scholar]
  54. Johnson, W.W.; Finley, M.T. Handbook of Acute Toxicity of Chemicals to Fish and Aquatic Invertebrates; Summaries of Toxicity Tests Conducted at Columbia National Fisheries Research Laboratory, 1965–1978; United States Department of the Interior, Fish and Wildlife Service: Washington, DC, USA, 1980.
  55. Gunasekara, A.S.; Troiano, J.; Goh, K.S.; Tjeerdema, R.S. Chemistry and fate of simazine. Rev. Environ. Contam. Toxicol. 2007, 189, 1–23. [Google Scholar] [PubMed]
  56. US EPA. Aquatic Life Benchmarks and Ecological Risk Assessments for Registered Pesticides. 2020. Available online: https://www.epa.gov/pesticide-science-and-assessing-pesticide-risks/aquatic-life-benchmarks-and-ecological-risk#aquatic-benchmarks (accessed on 20 August 2020).
  57. Clark, E.W. A review of literature on calcium and magnesium in insects. Ann. Entomol. Soc. Am. 1958, 51, 142–154. [Google Scholar] [CrossRef]
  58. White, P.J.; Broadley, M.R. Calcium in plants. Ann. Bot. 2003, 92, 487–511. [Google Scholar] [CrossRef] [PubMed]
  59. Stone, M.L.; Whiles, M.R.; Webber, J.A.; Williard, W.J.; Reeve, J.D. Macroinvertebrate communities in agriculturally impacted southern Illinois streams: Patterns with riparian vegetation, water quality, and in-stream habitat quality. J. Environ. Qual. 2005, 34, 907–917. [Google Scholar] [CrossRef]
  60. Hutchens, J.J., Jr.; Schuldt, J.A.; Richards, C.; Johnson, L.B.; Host, G.E.; Breneman, D.H. Multi-scale mechanistic indicators of midwestern USA stream macroinvertebrates. Ecol. Indic. 2009, 9, 1138–1150. [Google Scholar] [CrossRef]
  61. Herringshaw, C.J.; Stewart, T.W.; Thompson, J.R.; Anderson, P.F. Land use, stream habitat, and benthic invertebrate assemblages in a highly altered Iowa watershed. Am. Midl. Nat. 2011, 165, 274–293. [Google Scholar] [CrossRef] [Green Version]
  62. Hrodey, P.J.; Sutton, T.M.; Frimpong, E.A. Land-use impacts on watershed health and integrity in Indiana warmwater streams. Am. Midl. Nat. 2009, 161, 76–95. [Google Scholar] [CrossRef]
  63. Pilière, A.; Schipper, A.M.; Breure, T.M.; Posthuma, L.; de Zwart, D.; Dyer, S.D.; Huijbregts, M.A.J. Unraveling the relationships between freshwater invertebrate assemblages and interacting environmental factors. Freshw. Sci. 2014, 33, 1148–1158. [Google Scholar]
  64. Longing, S.D.; Voshell, J.R., Jr.; Dolloff, C.A.; Roghair, C.N. Relationship of sedimentation and benthic macroinvertebrate assemblages in headwater streams using systematic longitudinal sampling at the reach scale. Environ. Monit. Assess. 2010, 161, 517–530. [Google Scholar] [CrossRef]
  65. Lamberti, G.A.; Berg, M.B. Invertebrates and other benthic features as indicators of environmental change in Juday Creek, Indiana. Nat. Area. J. 1995, 15, 249–258. [Google Scholar]
  66. Bossley, J.P.; Smiley, P.C., Jr. Impact of student-induced disturbance on stream macroinvertebrates differs among habitat types. Sci. Rep. 2019, 9, 1447. [Google Scholar] [CrossRef]
Figure 1. Relationship of the site scores of the first chemical PCA (principal components analysis) axis with site scores of first physical PCA axis in eight agricultural headwater streams in Indiana, Michigan, and Ohio, 2017 to 2018. The straight line in the figure is the predicted relationship calculated based on the equation y = 0.092 + 0.766 (physical PCA axis 1).
Water 12 02976 g001
Figure 2. Relationship of Invertebrate Community Index scores with the site scores of second chemical principal components analysis axis (PCA Axis 2) (a) and the site scores of second physical principal components analysis axis (PCA Axis 2) (b) in eight agricultural headwater streams in Indiana, Michigan, and Ohio, 2017 to 2018. The straight line in 2a is the predicted relationship based on the equation y = 18.747 + 0.713 (chemical PCA axis 1) + −1.325 (chemical PCA axis 2) + −0.327 (chemical PCA axis 3) using a range of values for the chemical PCA axis 2 and values of the chemical PCA axes 1 and 3 as 0. The straight line in 2b is the predicted relationship based on the equation y = 18.813 + −0.009 (physical PCA axis 1) + −2.108 (physical PCA axis 2) using a range of values for physical PCA axis 2 and values of physical PCA axis 1 as 0.
Water 12 02976 g002
Table 1. Watershed size, percent agriculture land use in watershed, mean percent riparian canopy cover, and stream type of four sites in the Saint Joseph River watershed (SJR) and four sites in the Upper Big Walnut Creek watershed (UBWC).
SiteWatershedWatershed Size (km2)Percent AgriculturePercent Canopy CoverStream Type
EBSJSJR21.629.321.3Unchannelized
ALGSJR20.460.70.0Channelized
BLGSJR13.869.00.0Channelized
CLGSJR14.071.50.0Channelized
C1UBWC4.455.786.5Unchannelized
MS1UBWC9.763.51.7Channelized
B1UBWC3.875.10.3Channelized
NR1UBWC7.086.913.3Channelized
Table 2. Mean values and minimum–maximum values (in parentheses) of eight physical characteristics of sediment from eight agricultural headwater streams in Indiana, Michigan, and Ohio, 2017 to 2018. Abbreviations are loss-on-ignition percent organic matter-LOI %OC and grain size diversity-GSD.
Site% Large Gravel% Small Gravel% Sand%Silt% ClayLOI
%OC
Grain Size RichnessGSD
EBSJ21.61 (4.70–38.00)30.73 (19.84–38.58)39.64 (24.16–62.66)6.67 (3.65–10.75)1.36 (0.86–2.05)2.38 (1.30–4.80)5.0 (5–5)1.22 (1.08–1.33)
ALG5.43 (0.00–10.33)28.05 (17.20–34.44)35.64 (27.72–46.83)22.67 (18.16–26.11)8.2 (6.31–12.64)3.8 (2.40–6.00)4.8 (4–5)1.38 (1.27–1.45)
BLG0.86 (0.00–2.93)13.83 (6.77–19.8)46.84 (41.48–49.15)26.82 (23.05–32.40)11.64 (10.98–12.53)2.63 (1.90–3.10)4.5 (4–5)1.25 (1.16–1.31)
CLG1.06 (0.00–2.63)28.19 (23.07–38.14)43.08 (39.44–47.64)19.17 (13.17–24.14)8.49 (5.36–11.48)1.78 (1.10–2.20)4.8 (4–5)1.27 (1.21–1.33)
C119.56 (13.54–25.2)38.33 (30.75–51.65)16.85 (10.83–23.04)16.35 (7.90–22.21)8.91 (3.87–11.89)2.33 (1.80–2.90)5.0 (5–5)1.46 (1.28–1.54)
MS10.20 (0.00–0.81)14.7 (0.00–24.44)24.31 (21.48–27.55)38.83 (33.04–49.82)21.96 (20.60–23.90)7.48 (6.40–8.90)4.0 (3–5)1.28 (1.04–1.37)
B116.72 (13.54–23.55)37.40 (34.08–39.57)12.78 (3.98–22.99)19.43 (15.23–23.86)13.67 (7.26–20.79)3.75 (3.40–4.20)5.0 (5–5)1.48 (1.44–1.54)
NR17.13 (0.00–17.57)20.58 (4.06–41.88)15.56 (10.72–17.78)31.82 (21.32–42.07)24.91 (16.56–36.09)3.68 (3.20–3.90)4.8 (4–5)1.40 (1.17–1.54)
Table 3. Mean values and minimum–maximum alues (in parentheses) of two physicochemical and eight nutrient characteristics of sediment from eight agricultural headwater streams in Indiana, Michigan, and Ohio, 2017 to 2018. Abbreviations are % TC—percent total carbon and % TN—percent total nitrogen.
SiteConductivity (dS/m)pH% TC% TNNH3–N
(mg/kg)
NO3–N (mg/kg)Ca
(mg/kg)
K
(mg/kg)
P
(mg/kg)
S
(mg/kg)
EBSJ0.261 (0.221–0.316)7.70 (7.55–8.04)1.71 (1.29–2.35)0.10 (0.02–0.18)6.77 (3.45–10.39)0.07 (0.01–0.25)4060 (3460–4890)30 (20–30)20 (20–20)50 (40–60)
ALG0.486 (0.306–0.710)7.58 (7.30–7.77)4.00 (2.82–4.57)0.14 (0.09–0.18)43.57 (26.59–60.89)0.34 (0.01–0.73)4410 (3870–5380)70 (0.05–0.09)30 (20–40)180 (60–410)
BLG0.479 (0.247– 0.721)8.18 (7.25–9.98)3.00 (2.77–3.27)0.10 (0.04–0.17)15.59 (3.62–21.55)0.23 (0.01–0.61)3450 (3090–4080)60 (50–80)40 (20–50)130 (50–210)
CLG0.472 (0.272–0.659)7.59 (7.28–7.9)2.60 (2.15–3.29)0.10 (0.05–0.13)15.37 (1.36–30.35)0.01 (0.01–0.01)3560 (3000–4000)60 (40–70)30 (20–50)110 (60–160)
C10.189 (0.086–0.344)8.05 (7.65–8.41)1.58 (1.10–1.87)0.08 (0.00–0.16)9.25 (5.56–16.70)0.35 (0.01–0.76)2150 (1360–3220)50 (30–70)10 (10–20)20 (0–60)
MS10.616 (0.433–0.736)6.94 (6.74–7.11)3.2 (2.15–3.95)0.21 (0.11–0.31)39.26 (17.7–62.23)0.21 (0.01–0.80)2890 (1590–4230)110 (60–170)20 (20–20)140 (90–210)
B10.432 (0.199–0.709)7.69 (7.47–8.15)2.98 (2.06–3.58)0.14 (0.05–0.19)11.70 (5.28–22.11)0.75 (0.01–2.09)3150 (1850–3760)90 (50–120)20 (10–30)110 (30–220)
NR10.263 (0.213–0.350)7.91 (7.62–8.21)1.74 (1.51–1.93)0.08 (0.06–0.11)9.02 (7.90–10.71)0.45 (0.01–1.02)2480 (1720–3370)80 (60–100)10 (0–20)40 (10–90)
Table 4. Mean values and minimum–maximum values (in parentheses) of one nutrient, five trace metals, three herbicides, and one herbicide metabolite from eight agricultural headwater streams in Indiana, Michigan, and Ohio, 2017 to 2018. Abbreviations are 2hyat-2-hydroxyatrazine and Meta -s-metolachlor.
SiteMg
(mg/kg)
Al
(mg/kg)
Cu
(mg/kg)
Fe
(mg/kg)
Mn
(mg/kg)
Zn
(mg/kg)
Atrazine (µg/kg)2hyat
(µg/kg)
Simazine (µg/kg)Meta
(µg/kg)
EBSJ160 (130–200)30 (10–60)0 (0–0)590 (460–820)200 (90–270)0 (0–0)0.77 (0.35–1.6)3.69 (2.71–4.69)0.05 (0.00–0.16)0.35 (0.00–0.59)
ALG200 (140–280)60 (10–140)0 (0–0)650 (530–810)160 (110–240)10 (0–10)6.04 (3.78–9.49)21.94 (13.2–27.54)0.58 (0.34–0.72)1.81 (1.18–2.77)
BLG140 (100–180)70 (10–160)0 (0–0)1450 (860–1840)110 (50–170)0 (0–10)8.26 (4.89–9.97)16.28 (12.73–21.72)0.49 (0.36–0.59)1.76 (0.86–2.98)
CLG150 (110–180)70 (30–120)0 (0–0)1240 (490–2290)100 (40–120)0 (0–10)5.82 (2.1–8.03)14.38 (9.68–23.67)0.39 (0.3–0.62)2.16 (0.27–5.59)
C1200 (130–240)130 (70–190)0 (0–10)300 (170–410)110 (60–170)0 (0–0)6.07 (2.95–8.03)21.5 (14.41–28.21)1.27 (0.75–1.85)5.59 (2.21–9.21)
MS1350 (180–480)340 (190–460)0 (0–0)2200 (1110–3430)90 (40–160)0 (0–10)11.64 (7.05–16.06)52.52 (44.52–62.48)0.63 (0.28–1.23)8.33 (5.75–13.96)
B1300 (180–460)160 (50–230)0 (0–0)880 (630–1120)90 (30–130)0 (0–10)14.08 (9.22–18.61)53.18 (33.41–77.05)0.38 (0.23–0.72)15.13 (10.02–24.68)
NR1290 (220–380)260 (130–380)0 (0–0)520 (430–570)140 (110–180)0 (0–10)12.75 (7.40–18.47)64.22 (26.95–99.95)2.69 (1.60–4.79)8.39 (0.00–13.46)
Publisher’s Note: MDPI stays neutral with regard to jurisdictional claims in published maps and institutional affiliations.

