The Impact of Land Use Changes on Soil Erosion in the River Basin of Miocki Potok, Montenegro

 ,
,  and
and
Abstract
:1. Introduction
2. Materials
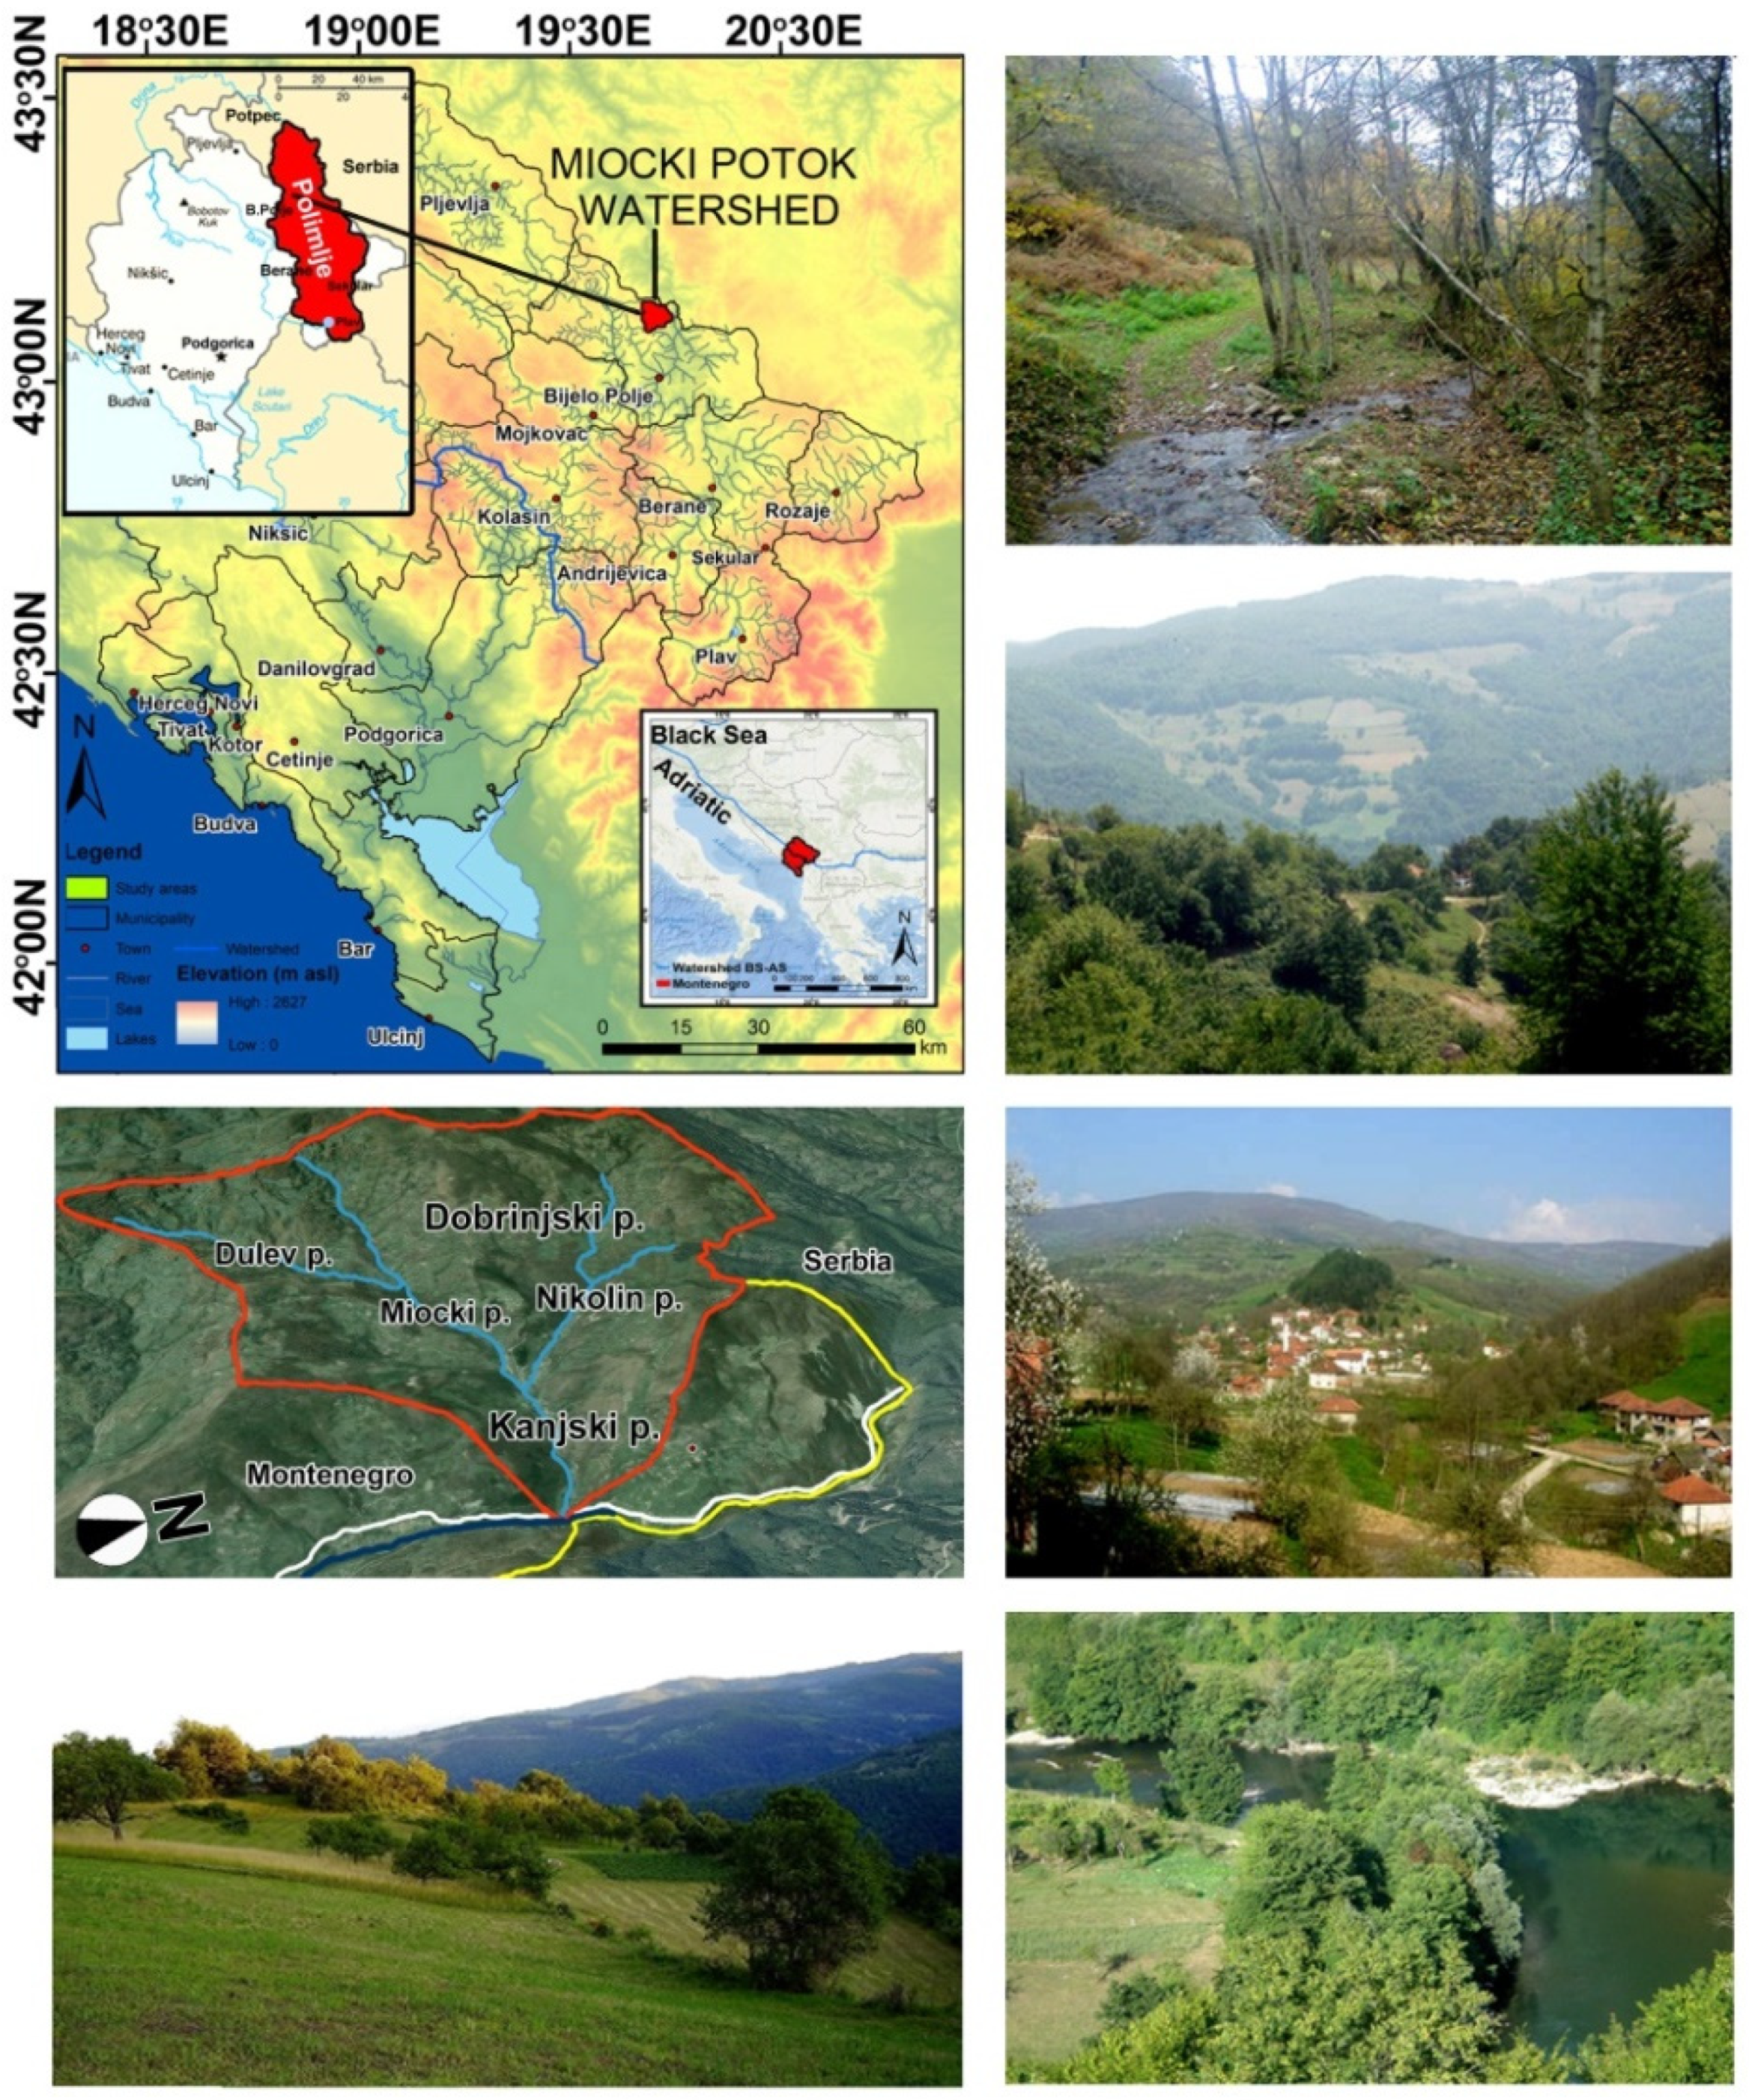
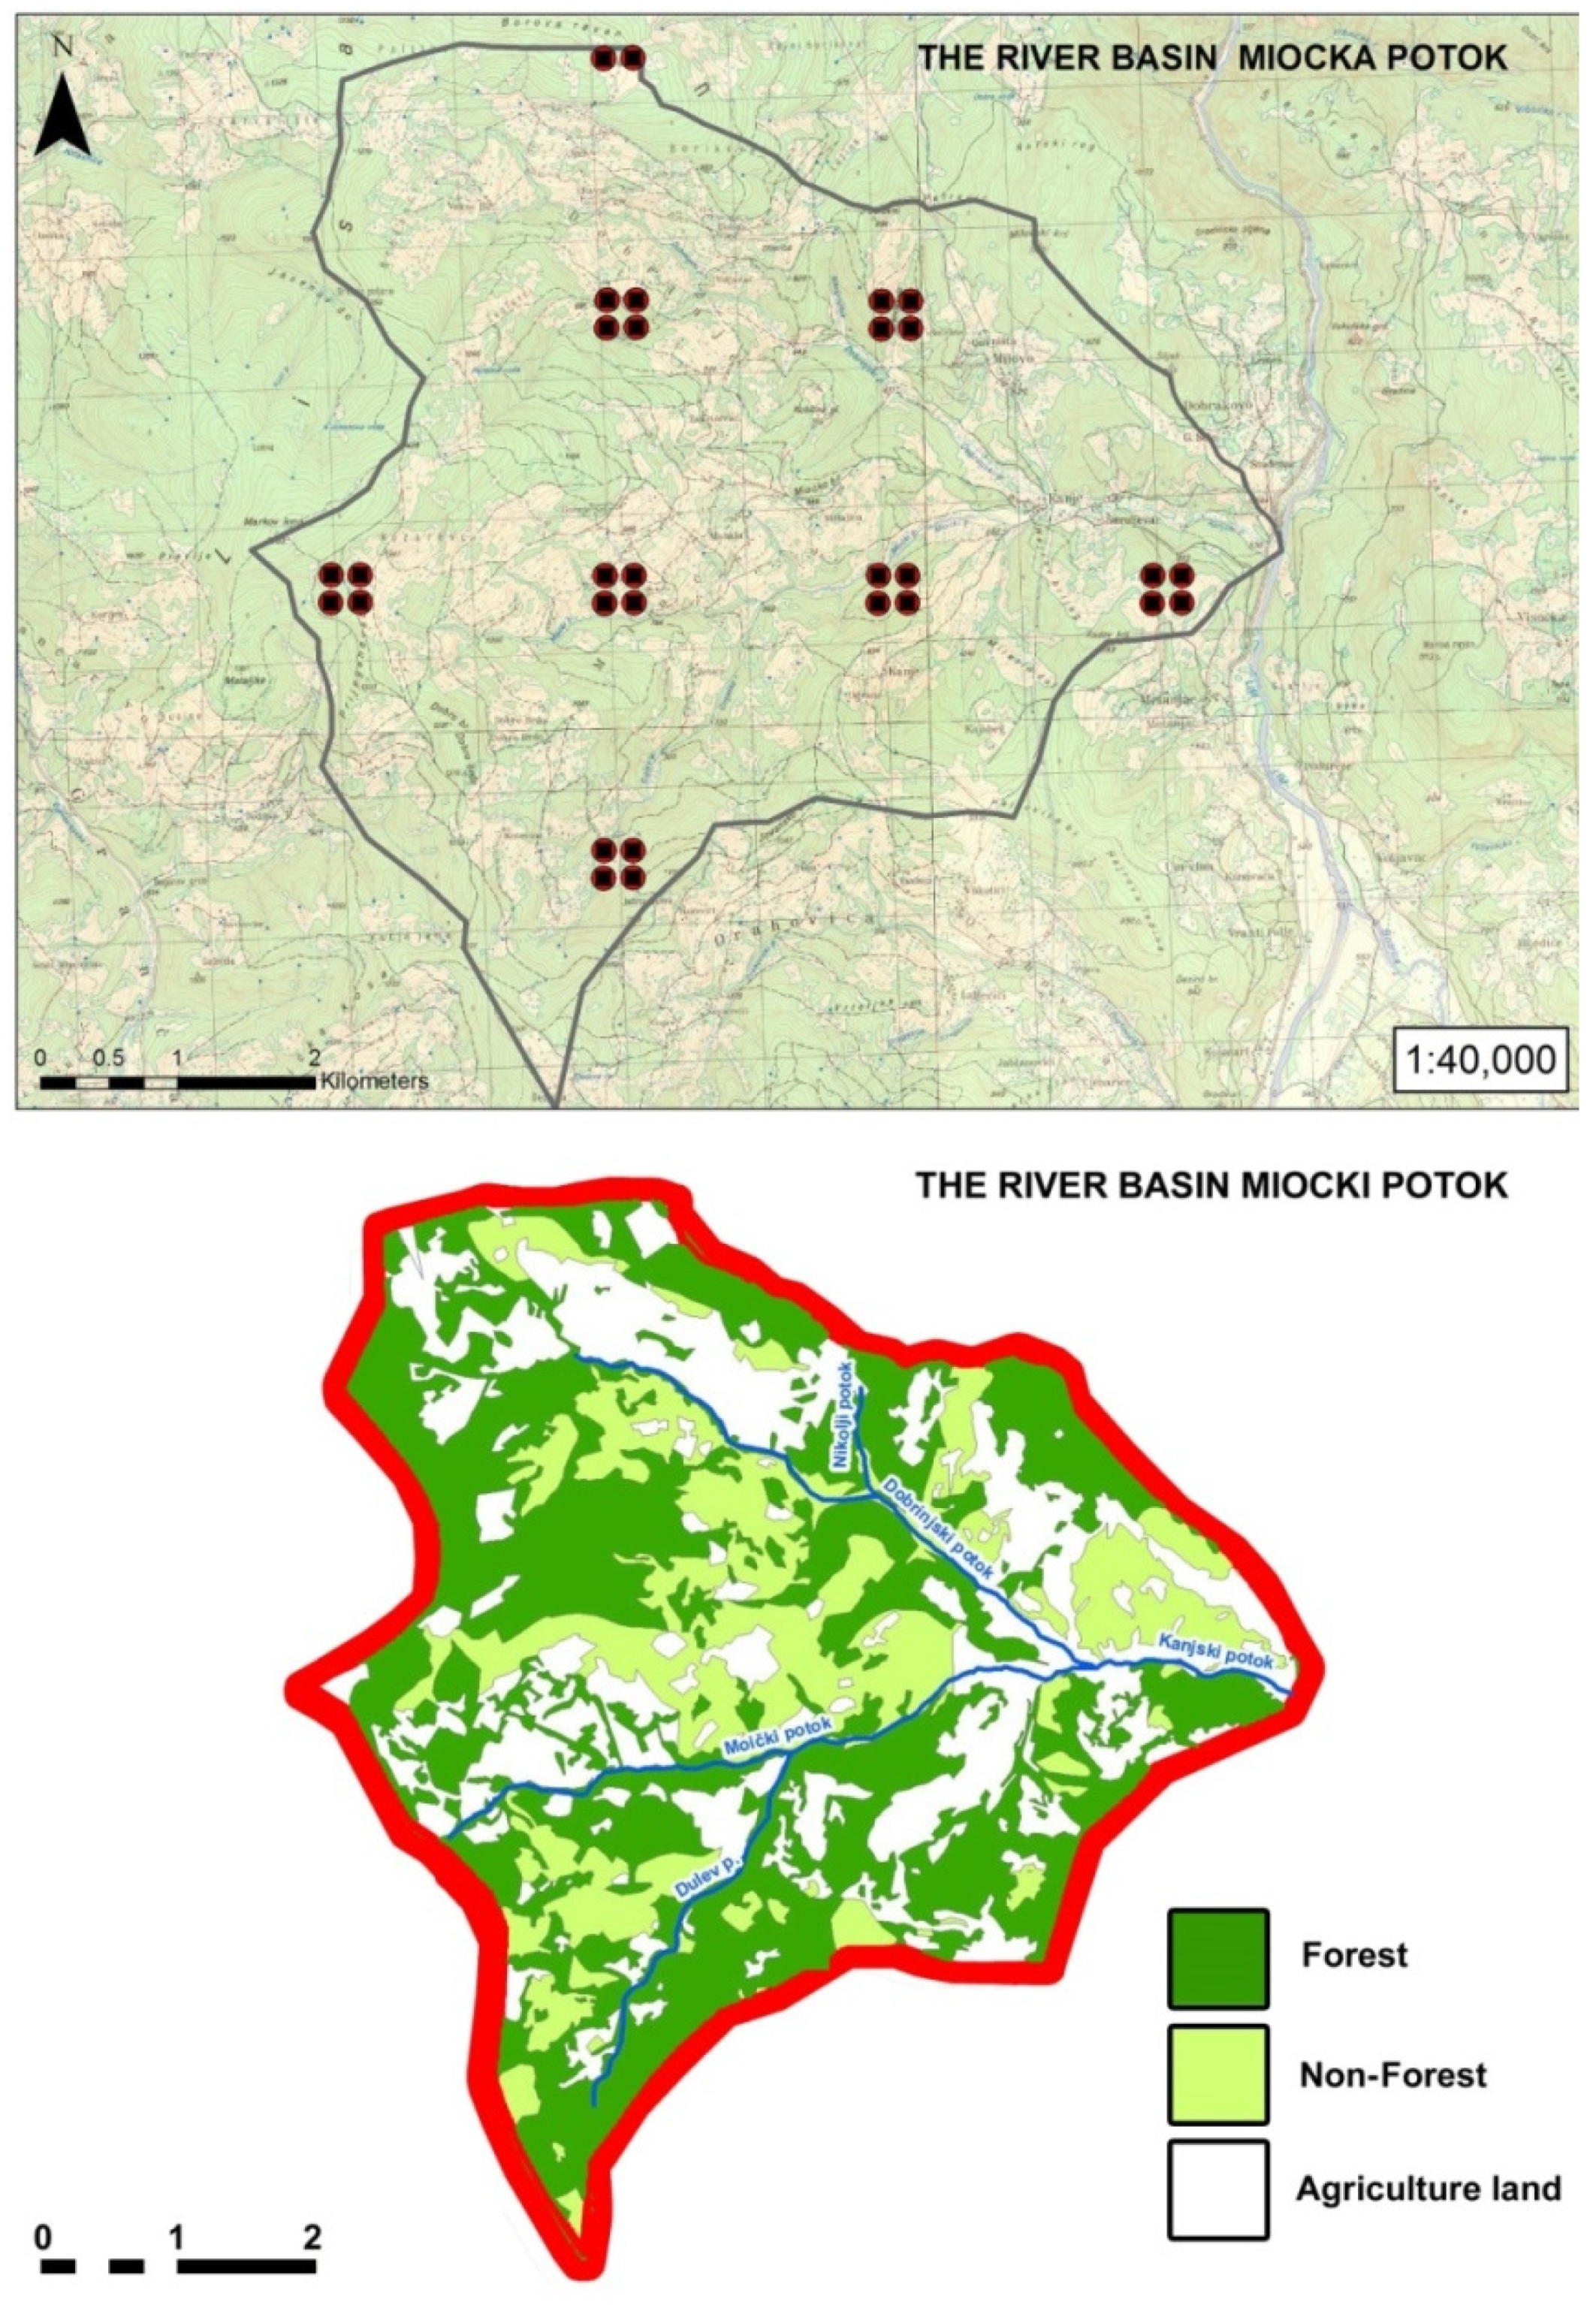
2.1. Study Area
2.2. The Geological Structure and Soils of the Area
3. Methods
3.1. The IntErO Model
- P is the annual average rainfall in mm.
- T is the temperature coefficient, calculated from the following equation:
3.2. IntEro Model Verification
4. Results
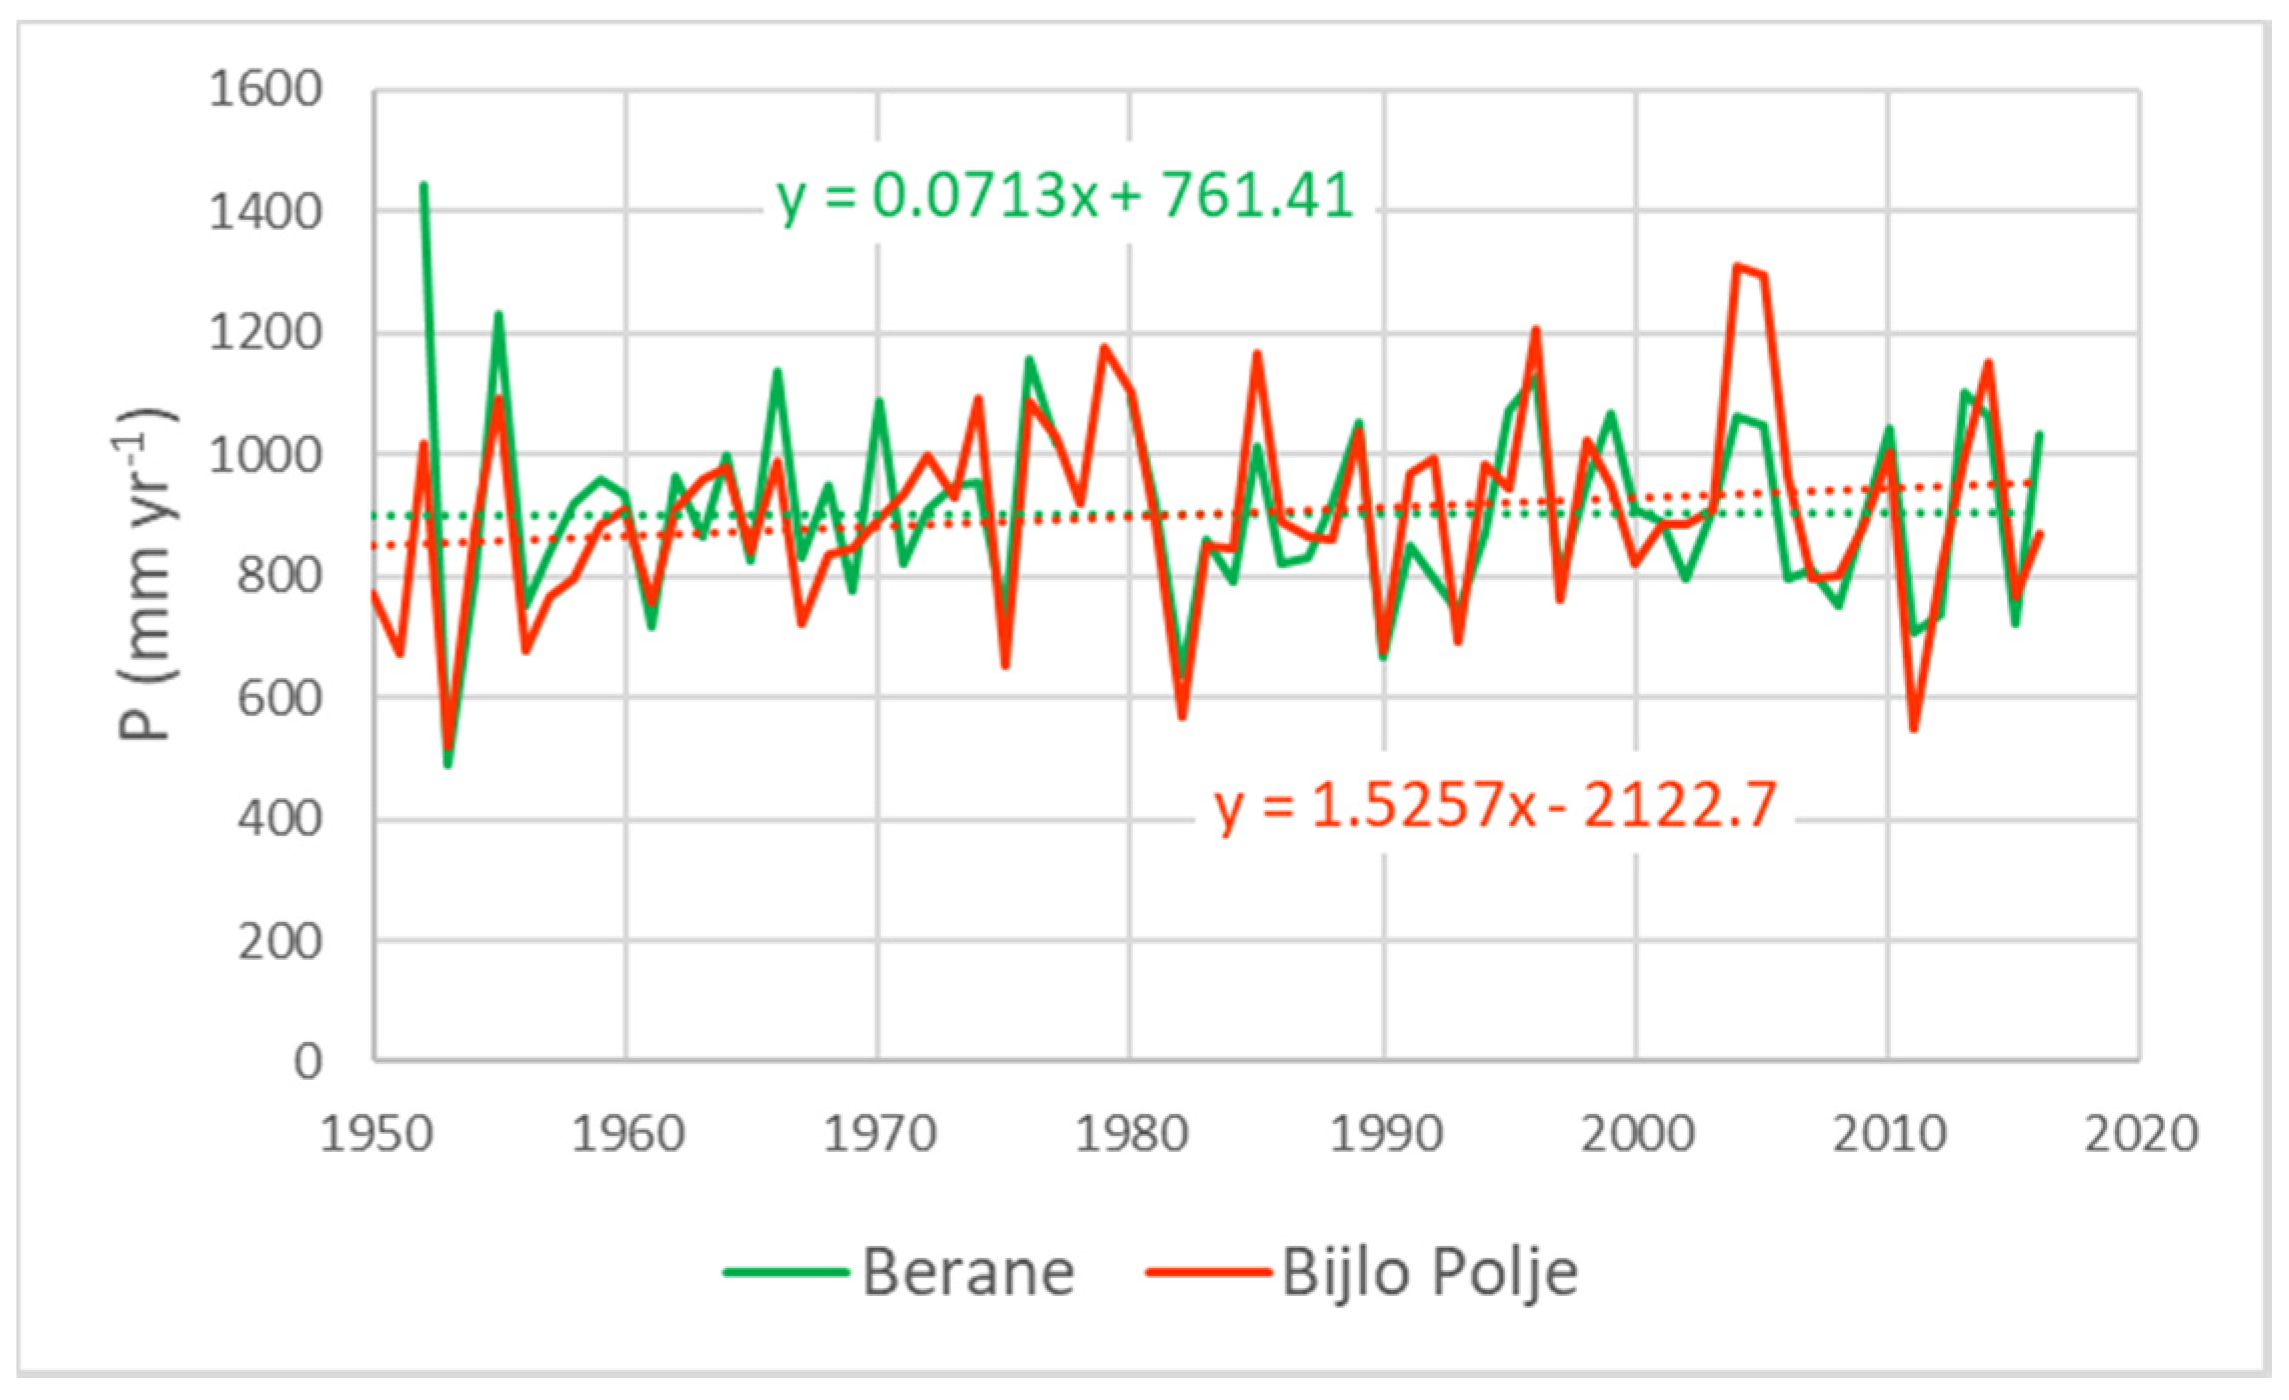
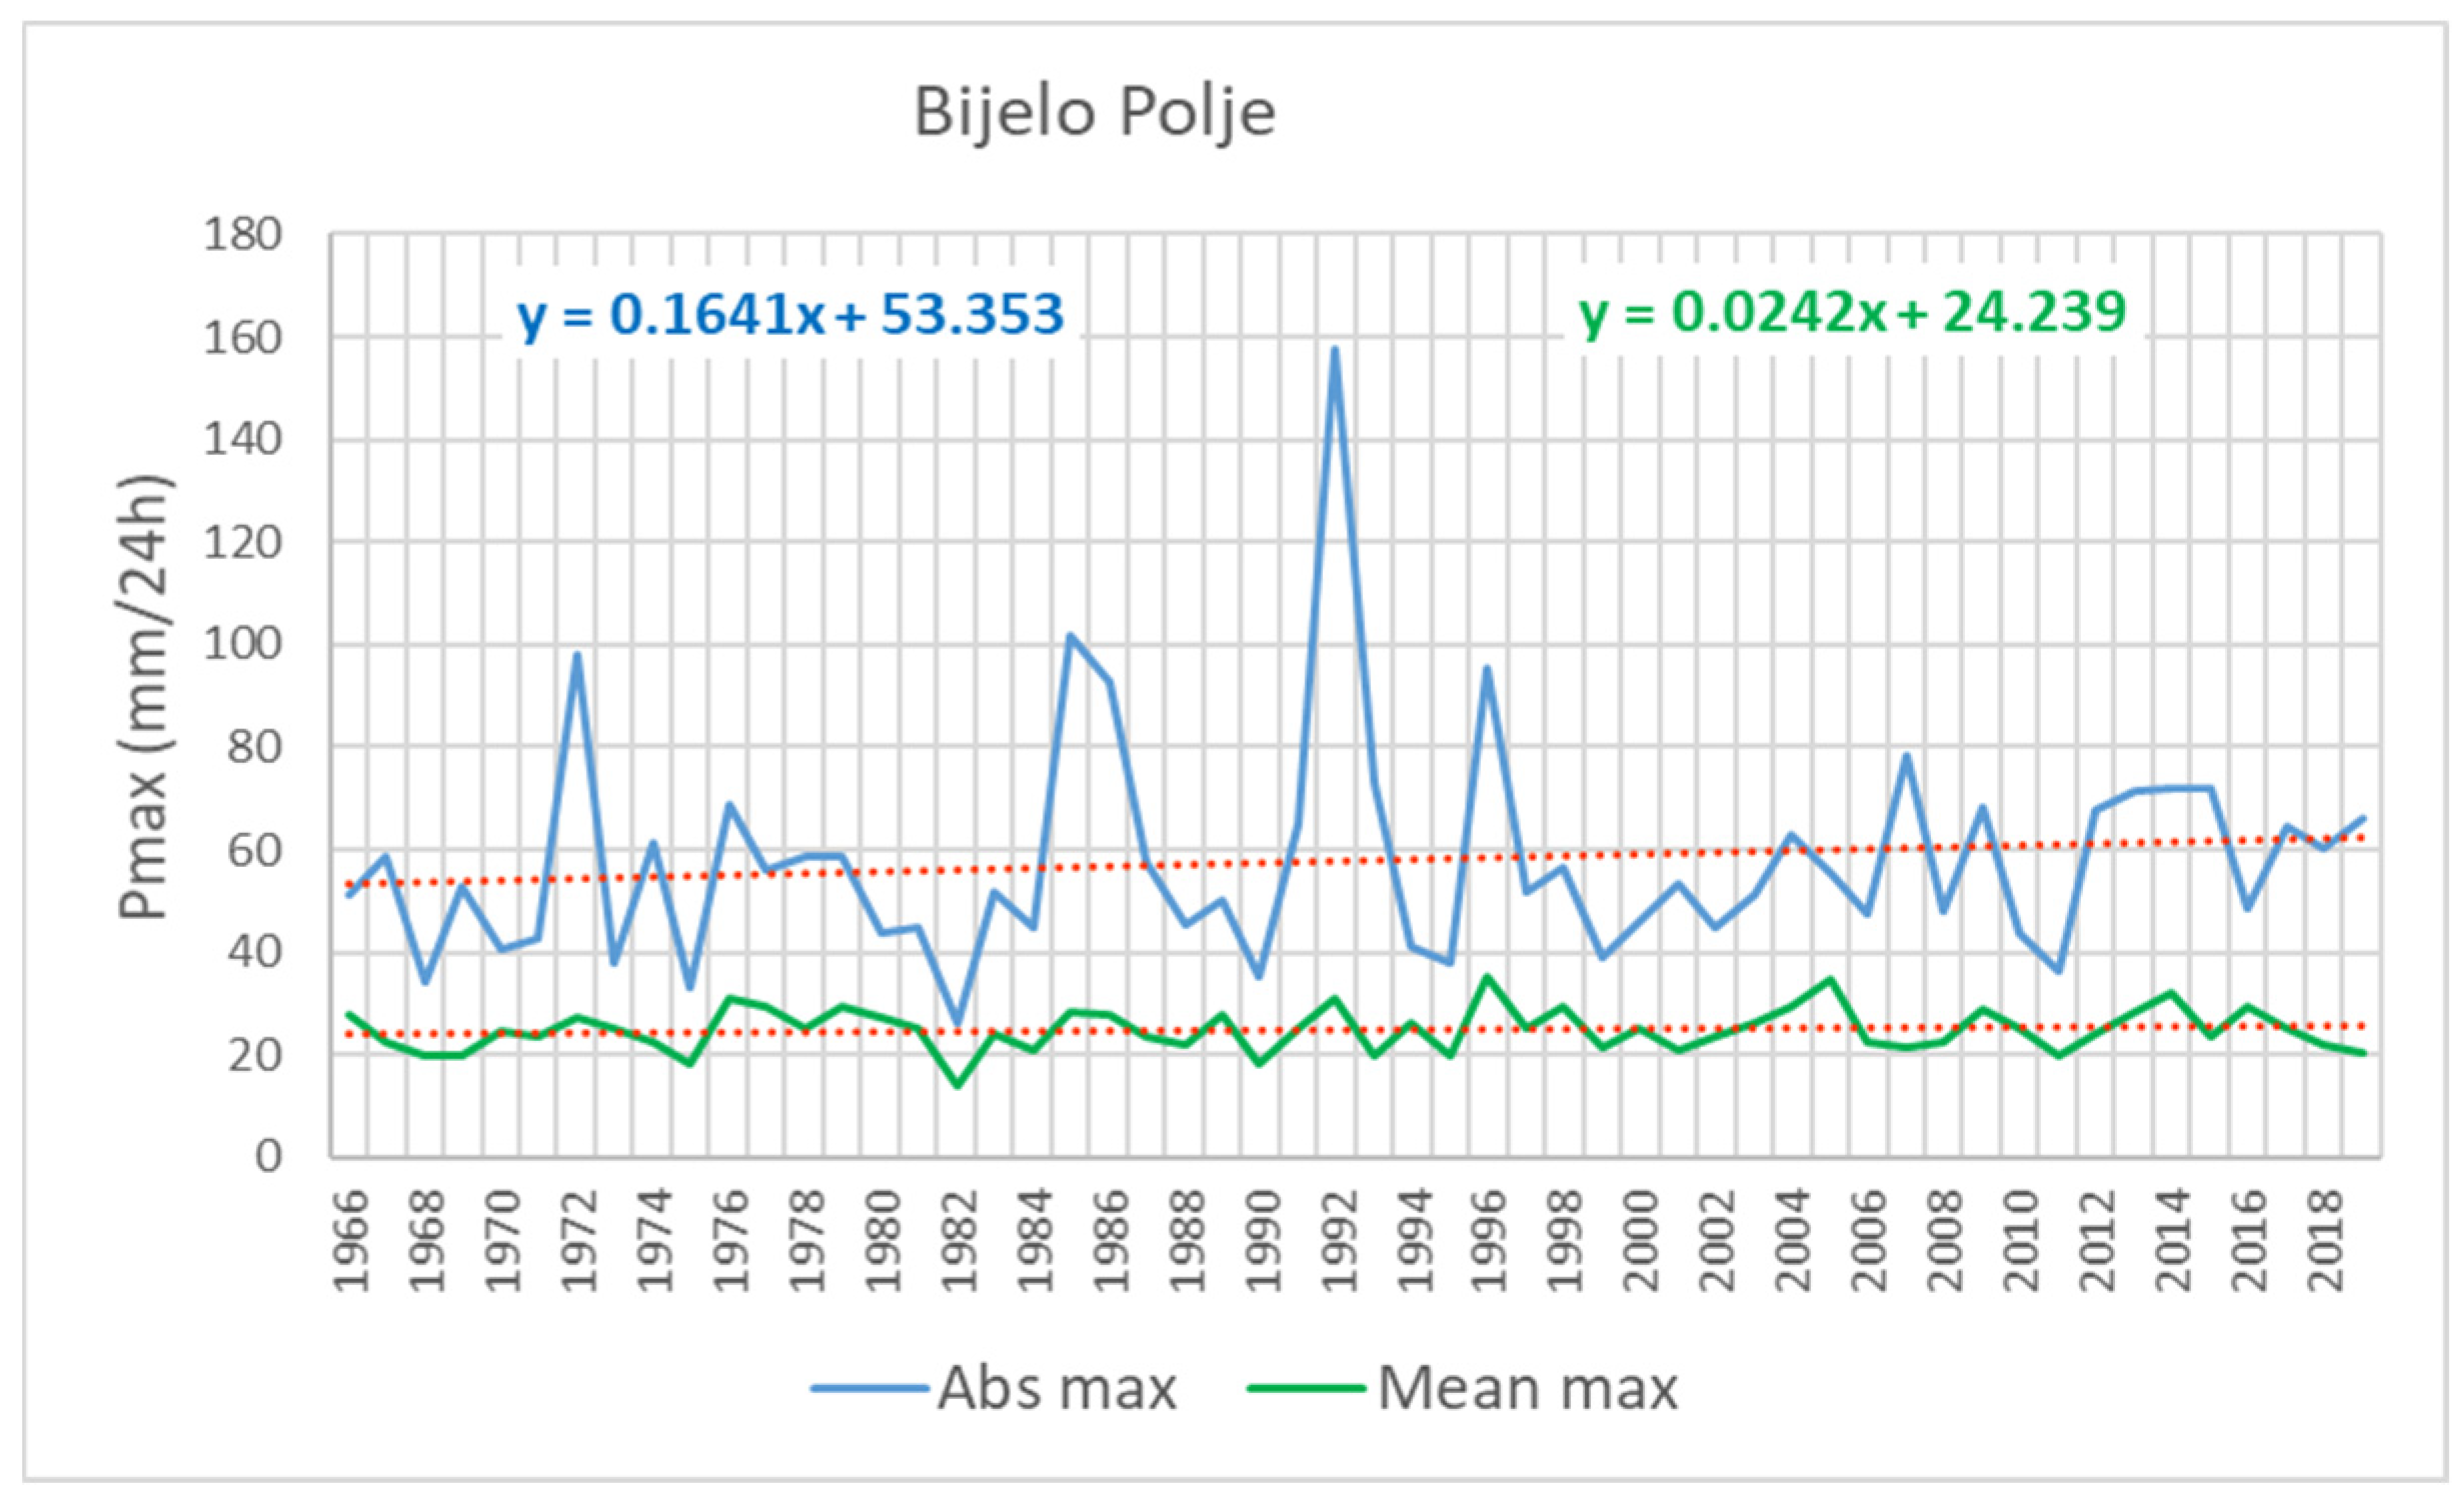
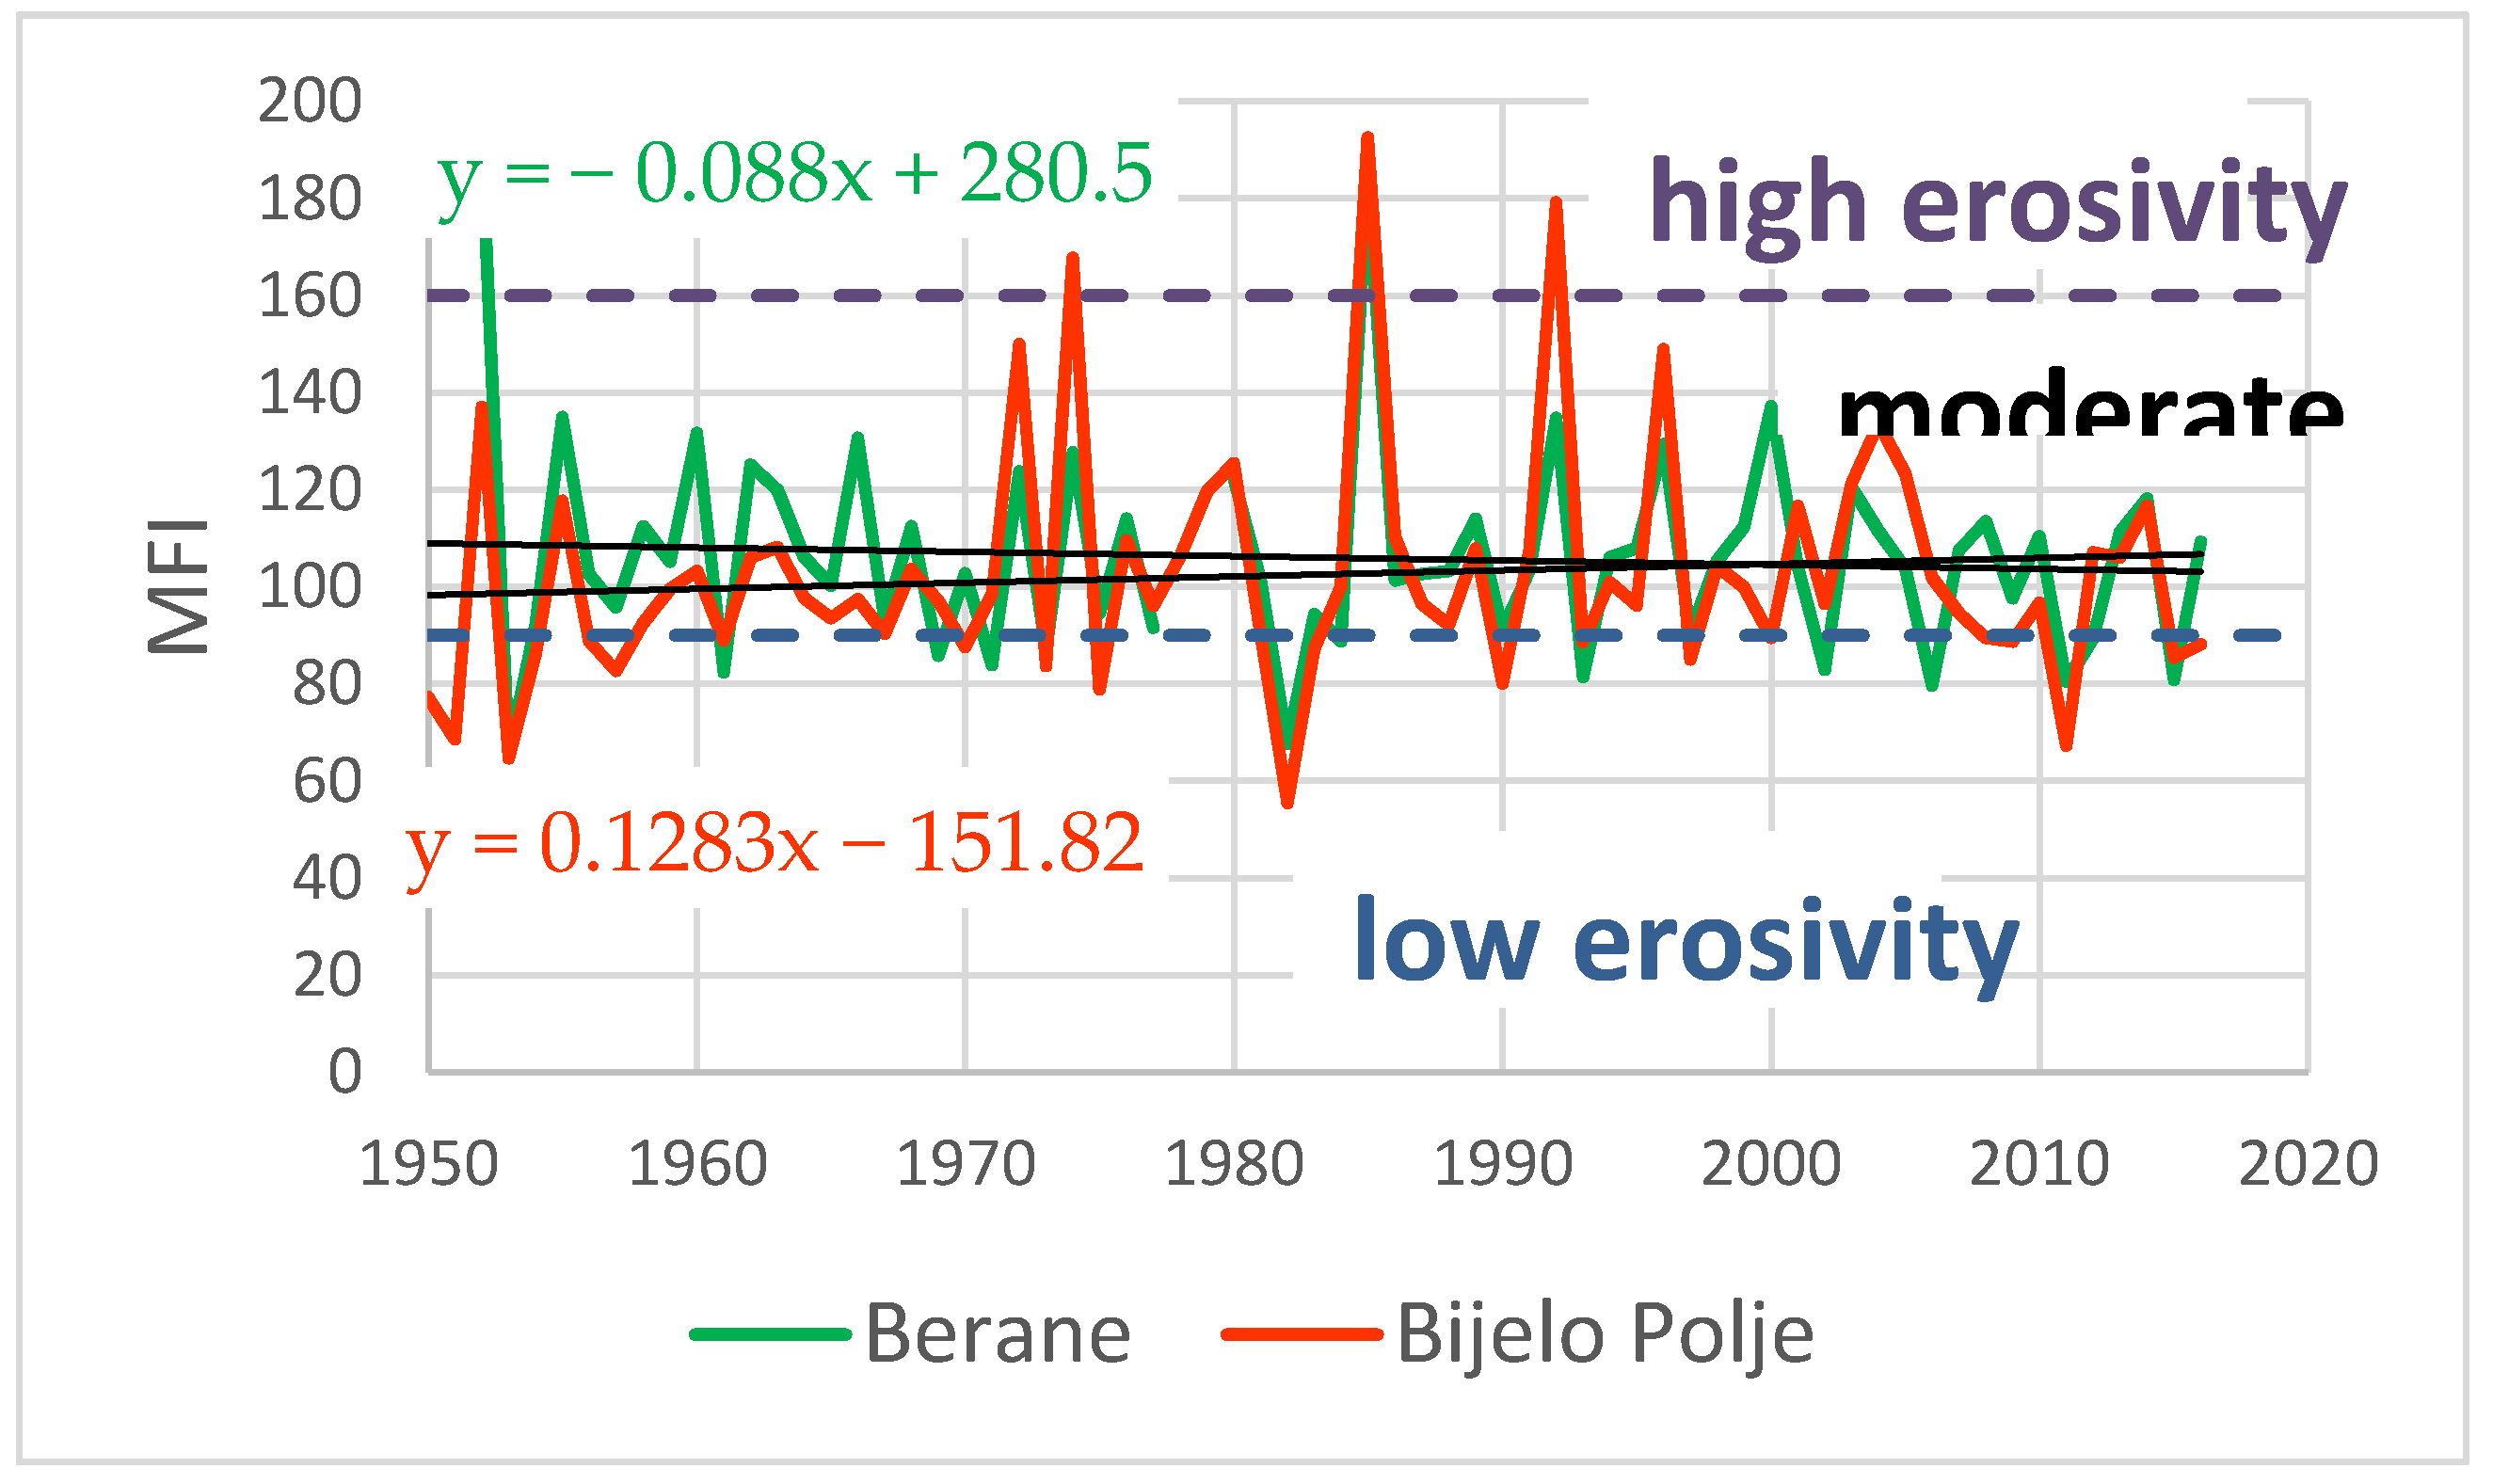
4.1. Rainfall Change
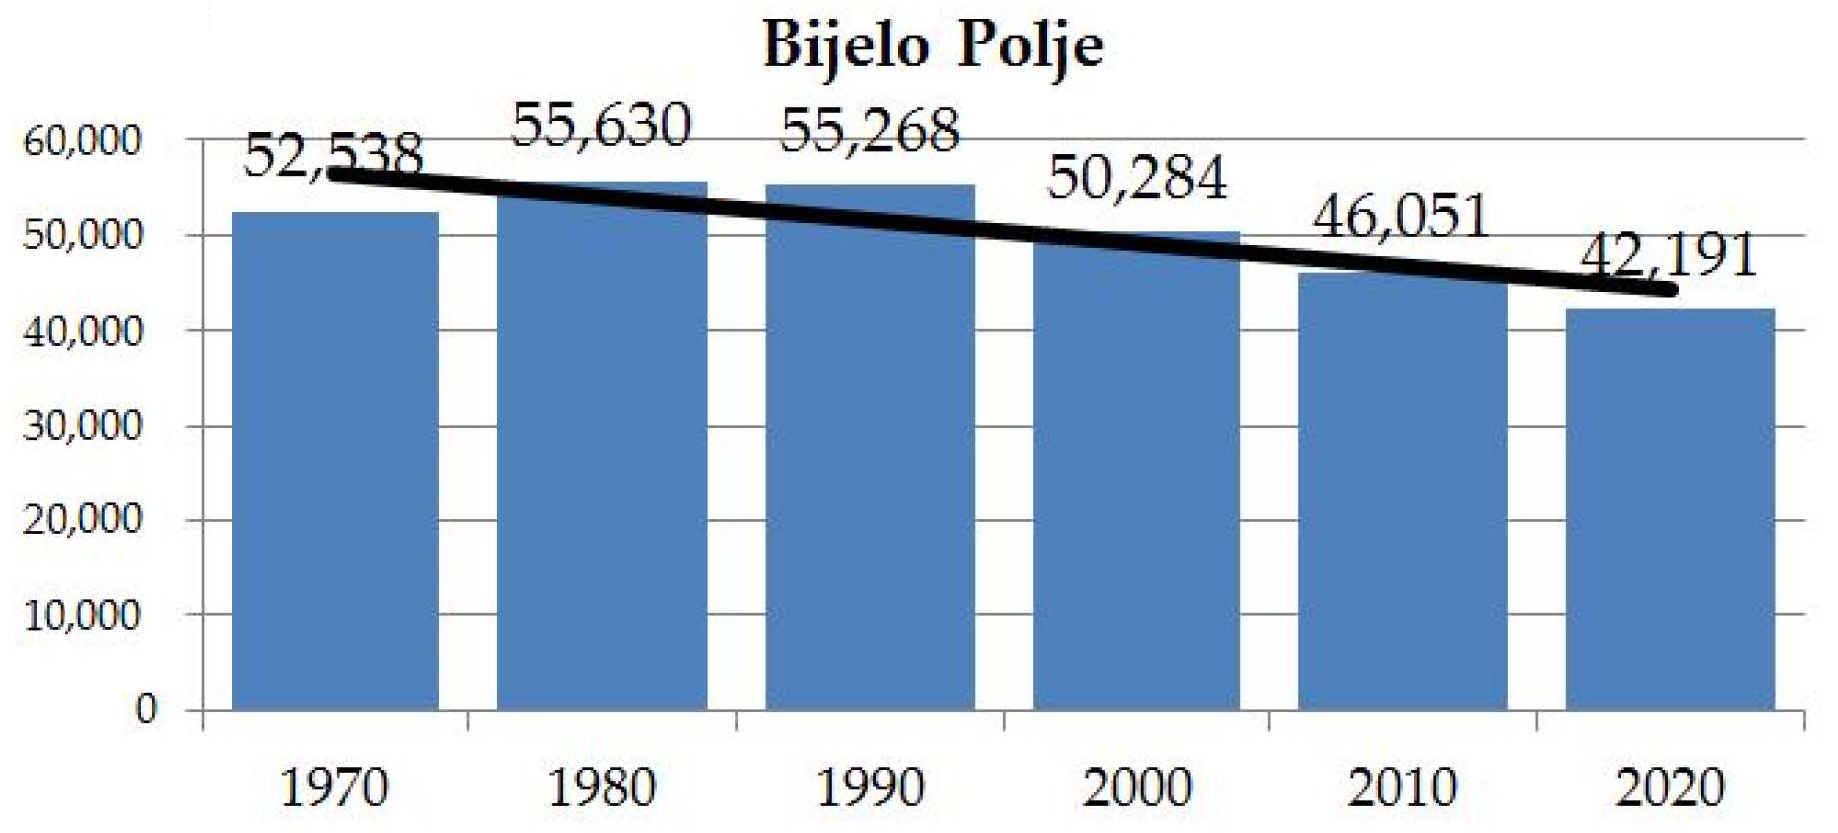
4.2. Demographic Changes in the River Basin of Miocki Potok
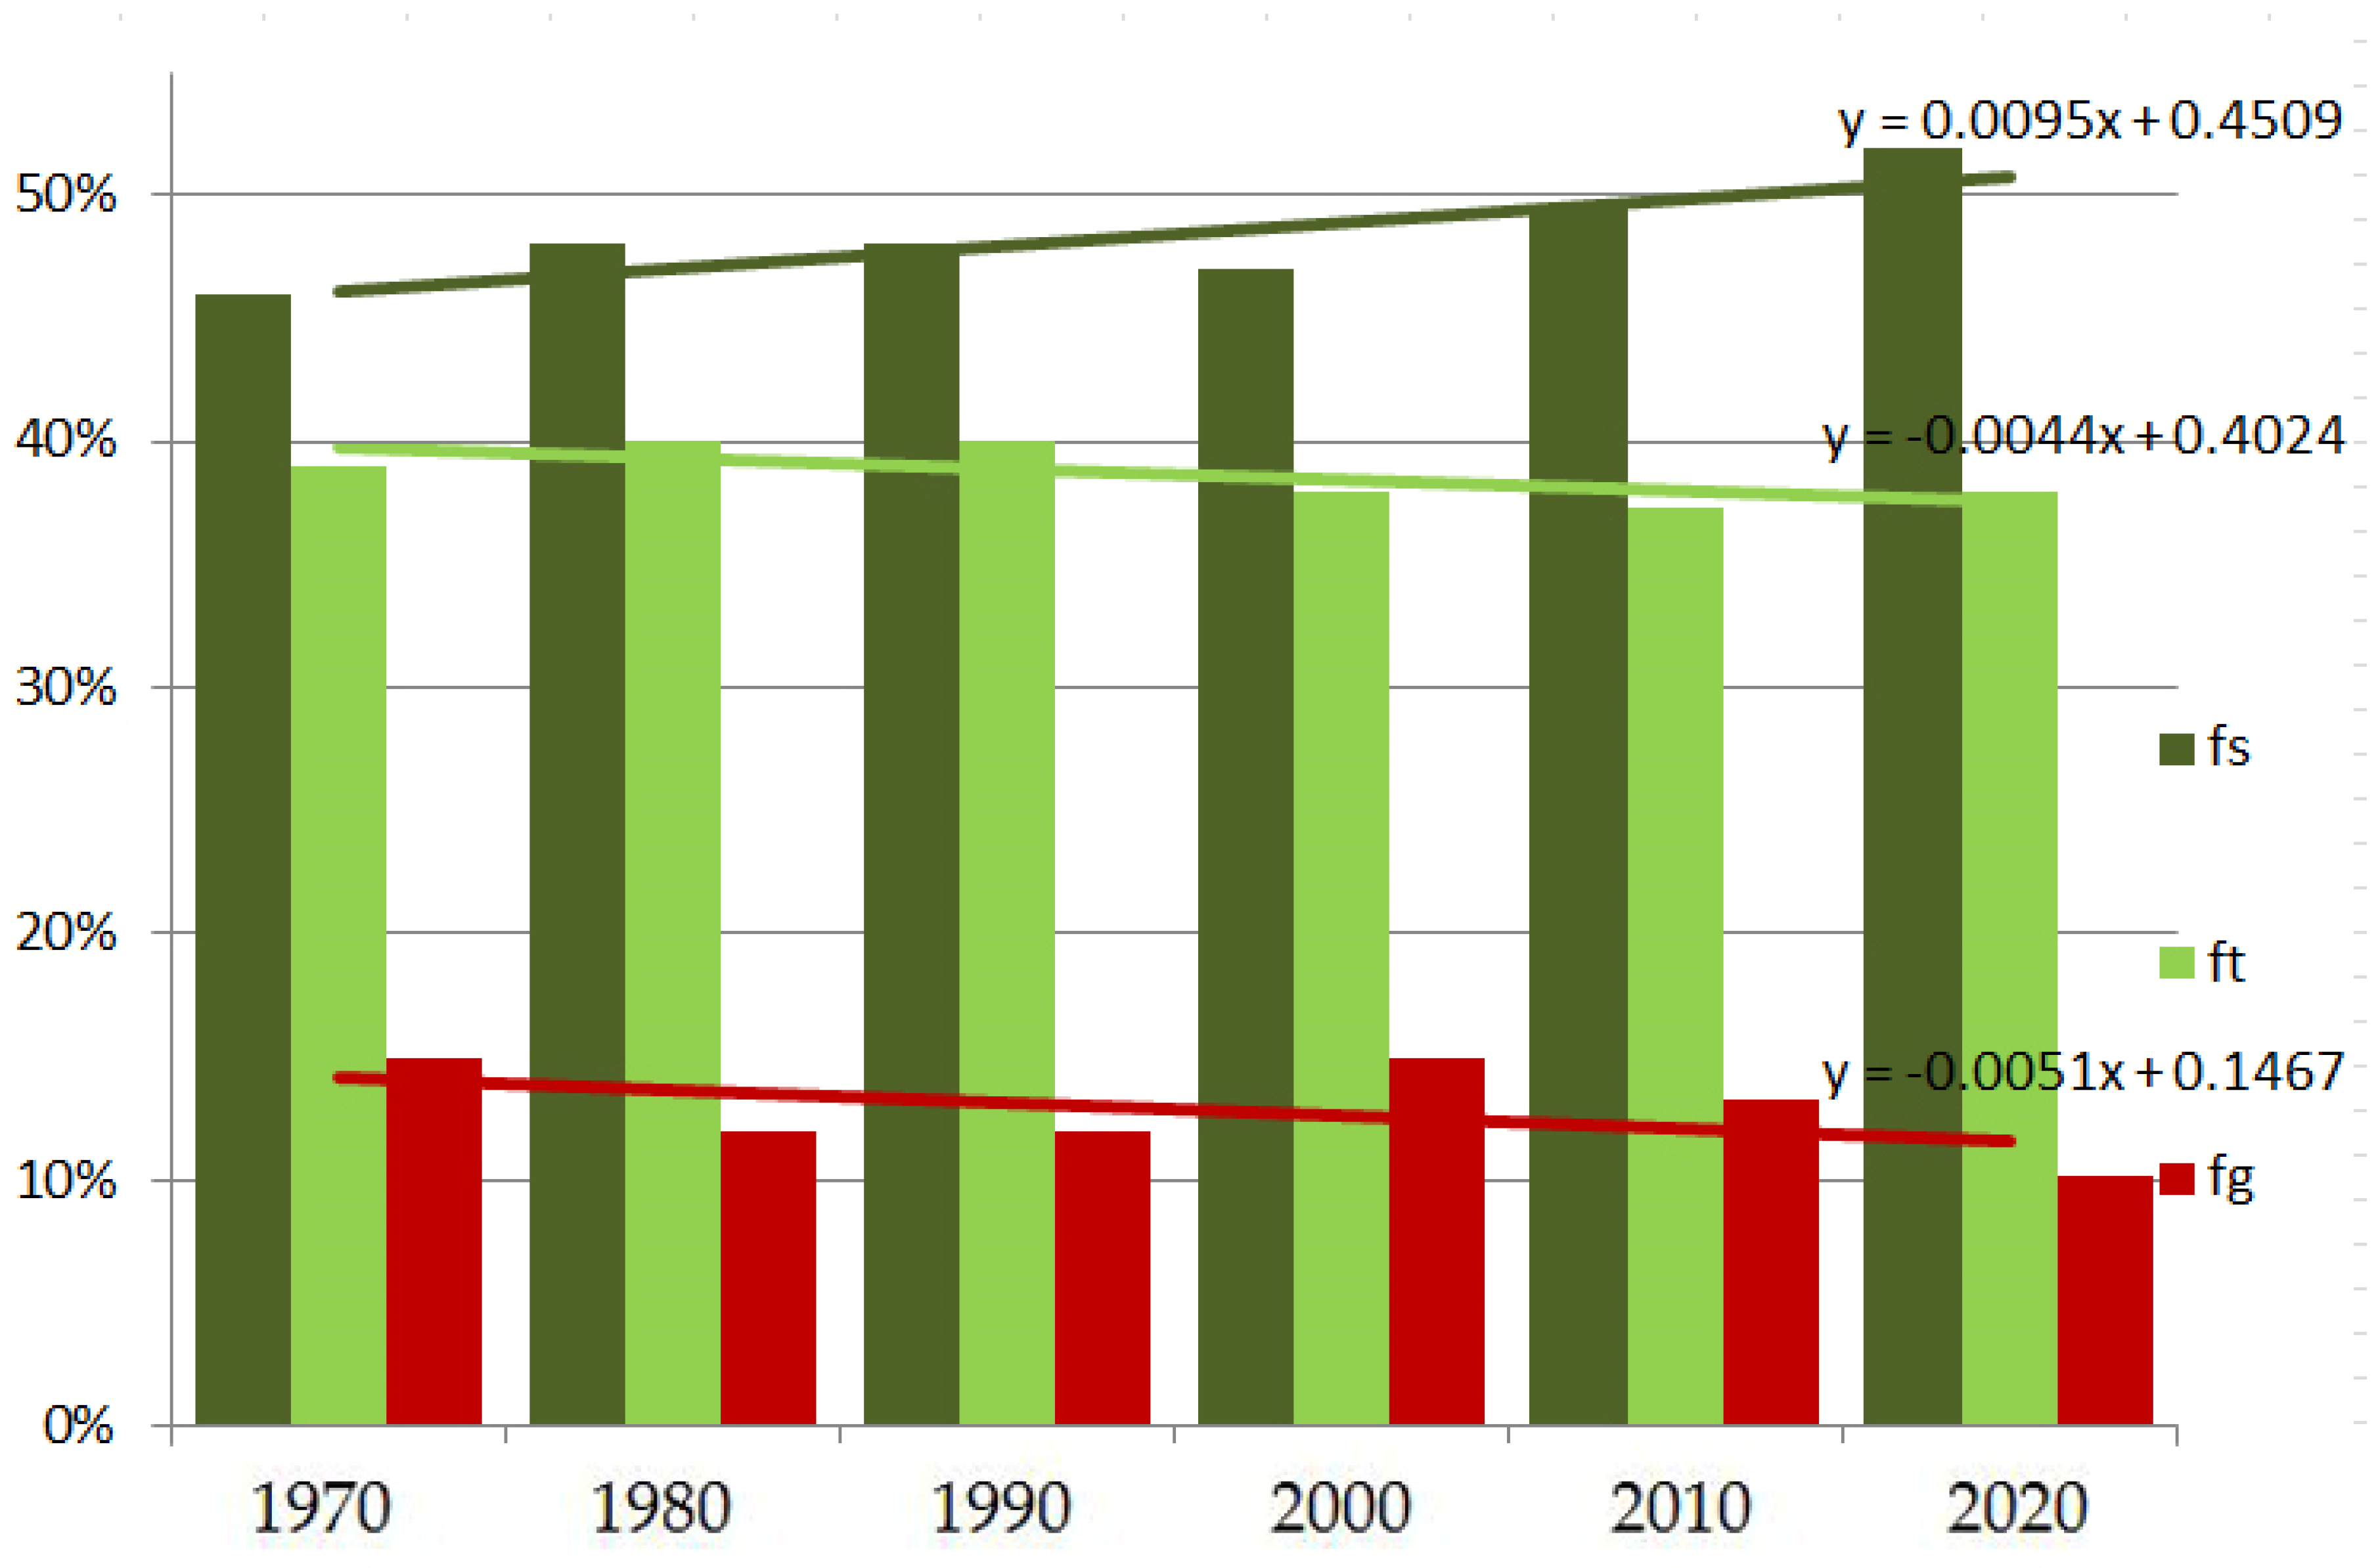
4.3. Vegetation and Land Use
4.4. Current Erosion and the Impact of Land Use on Soil Erosion Intensity
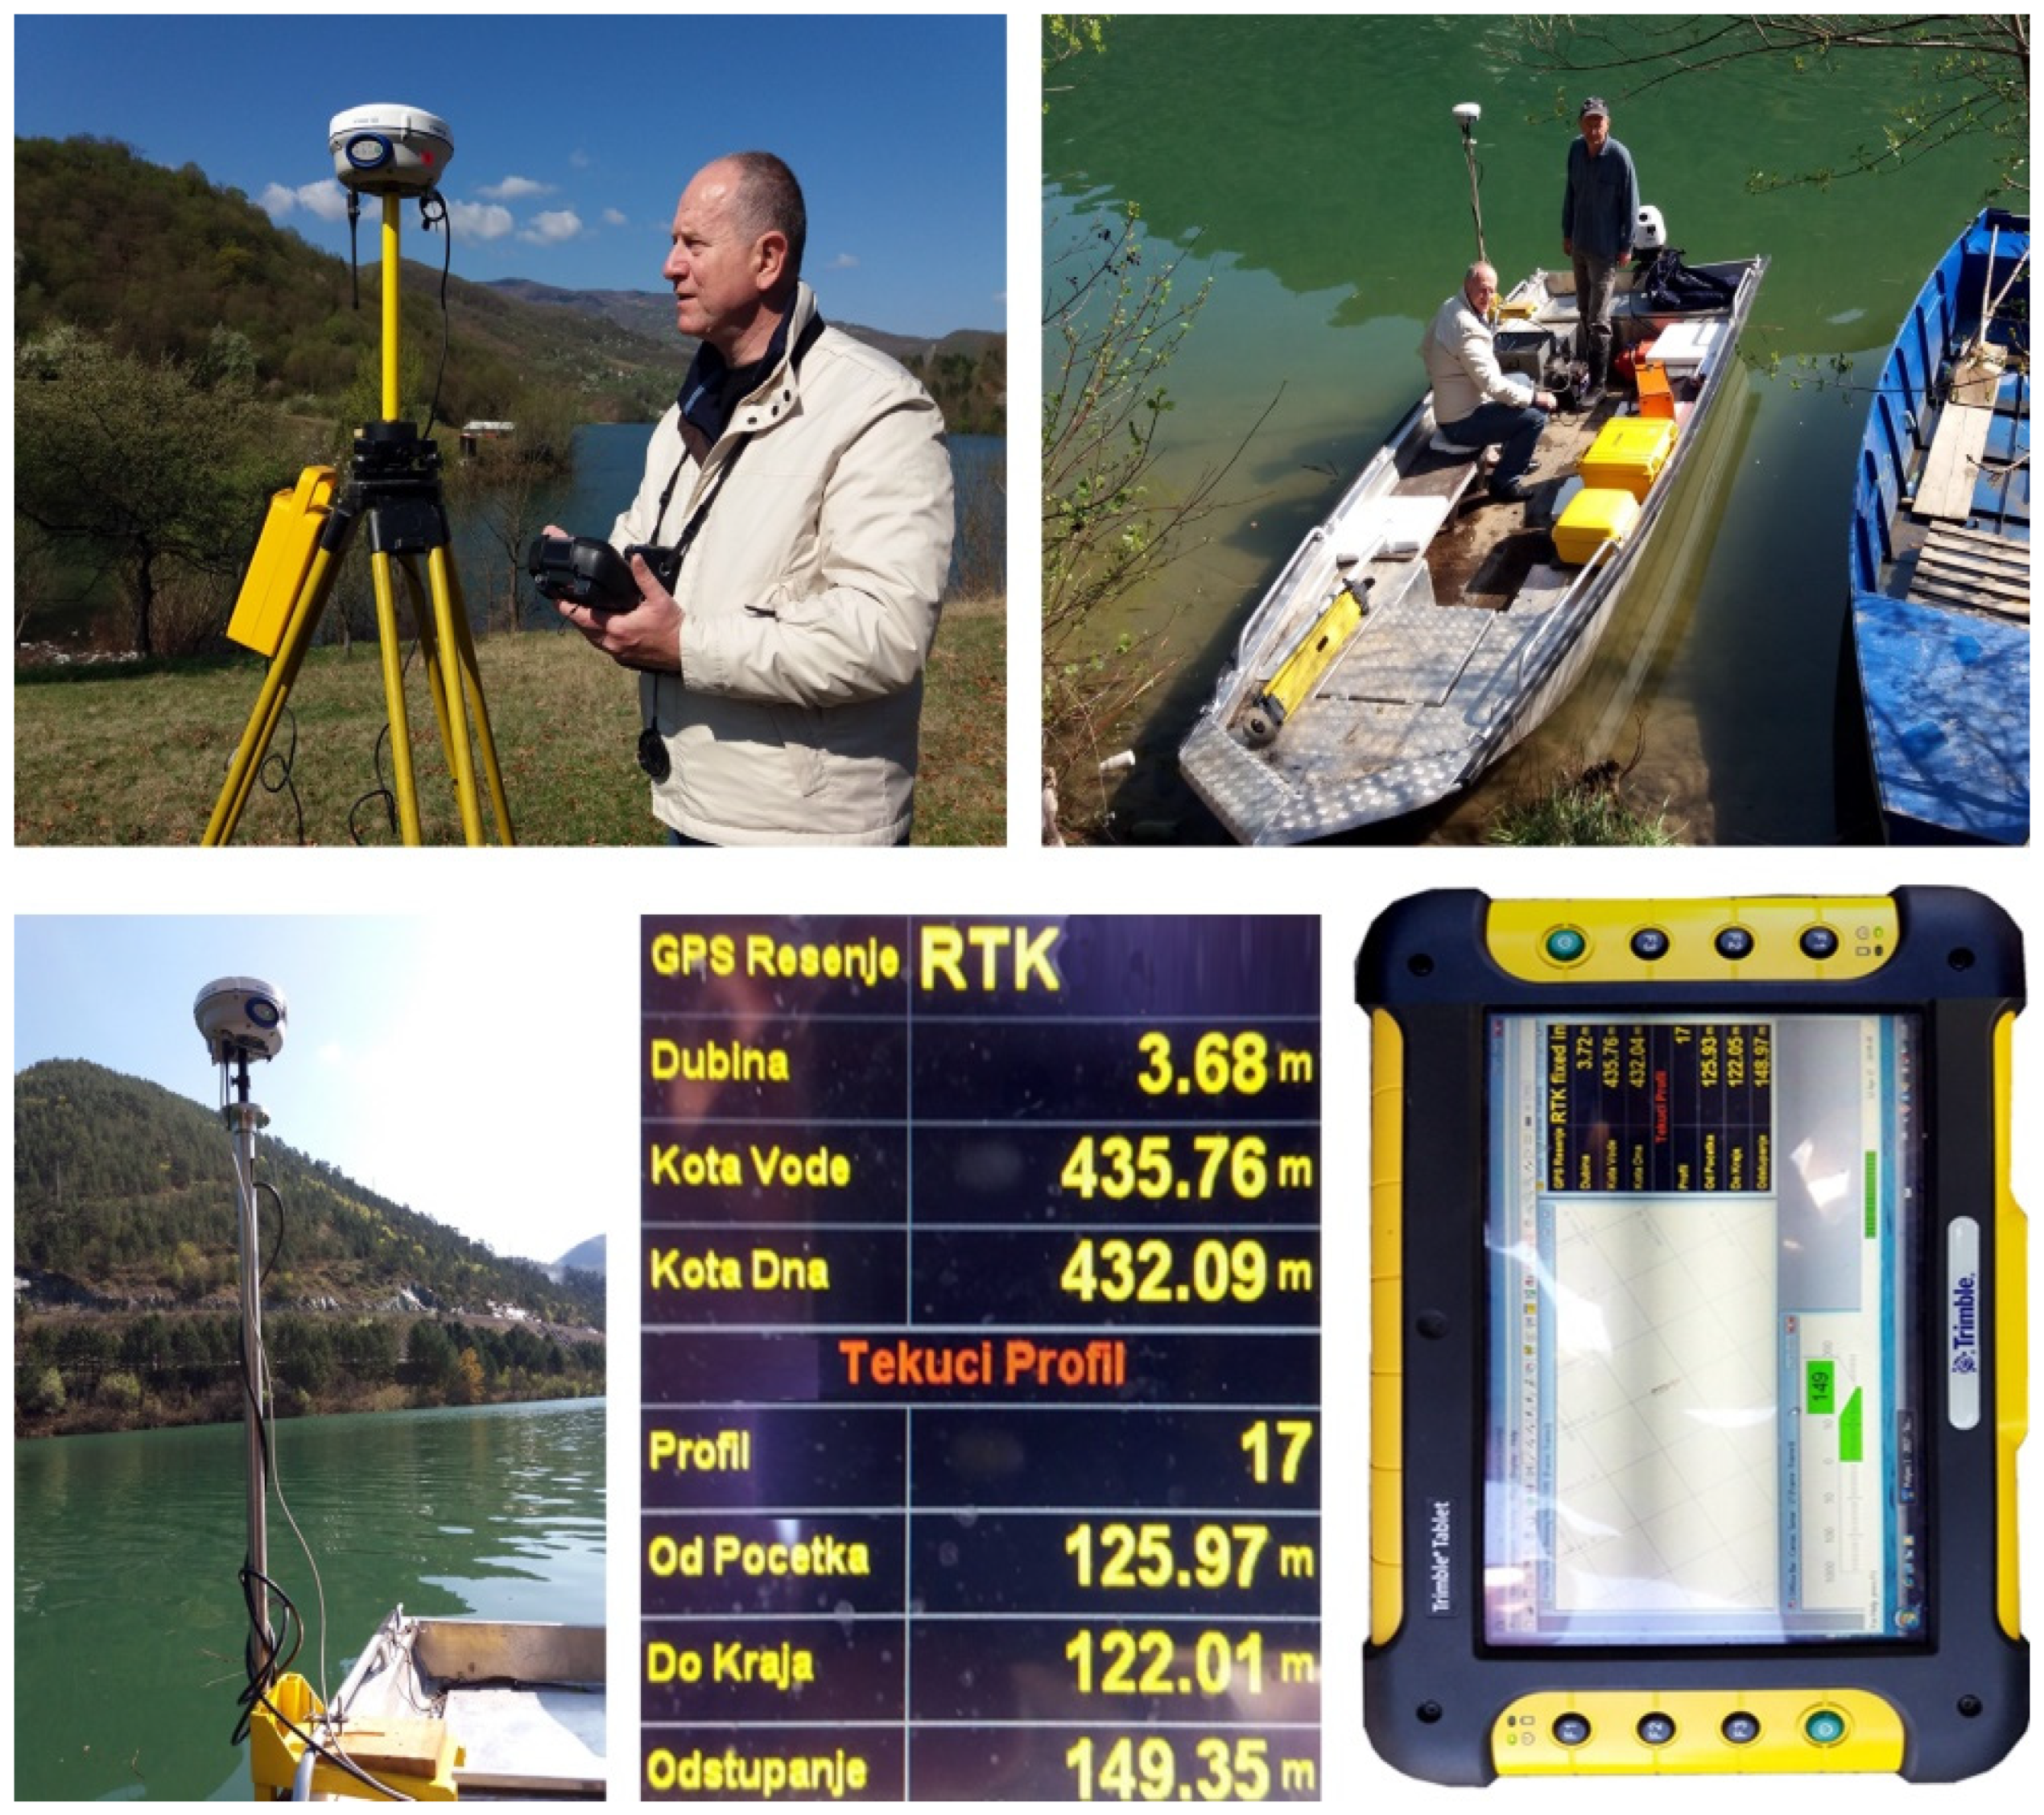
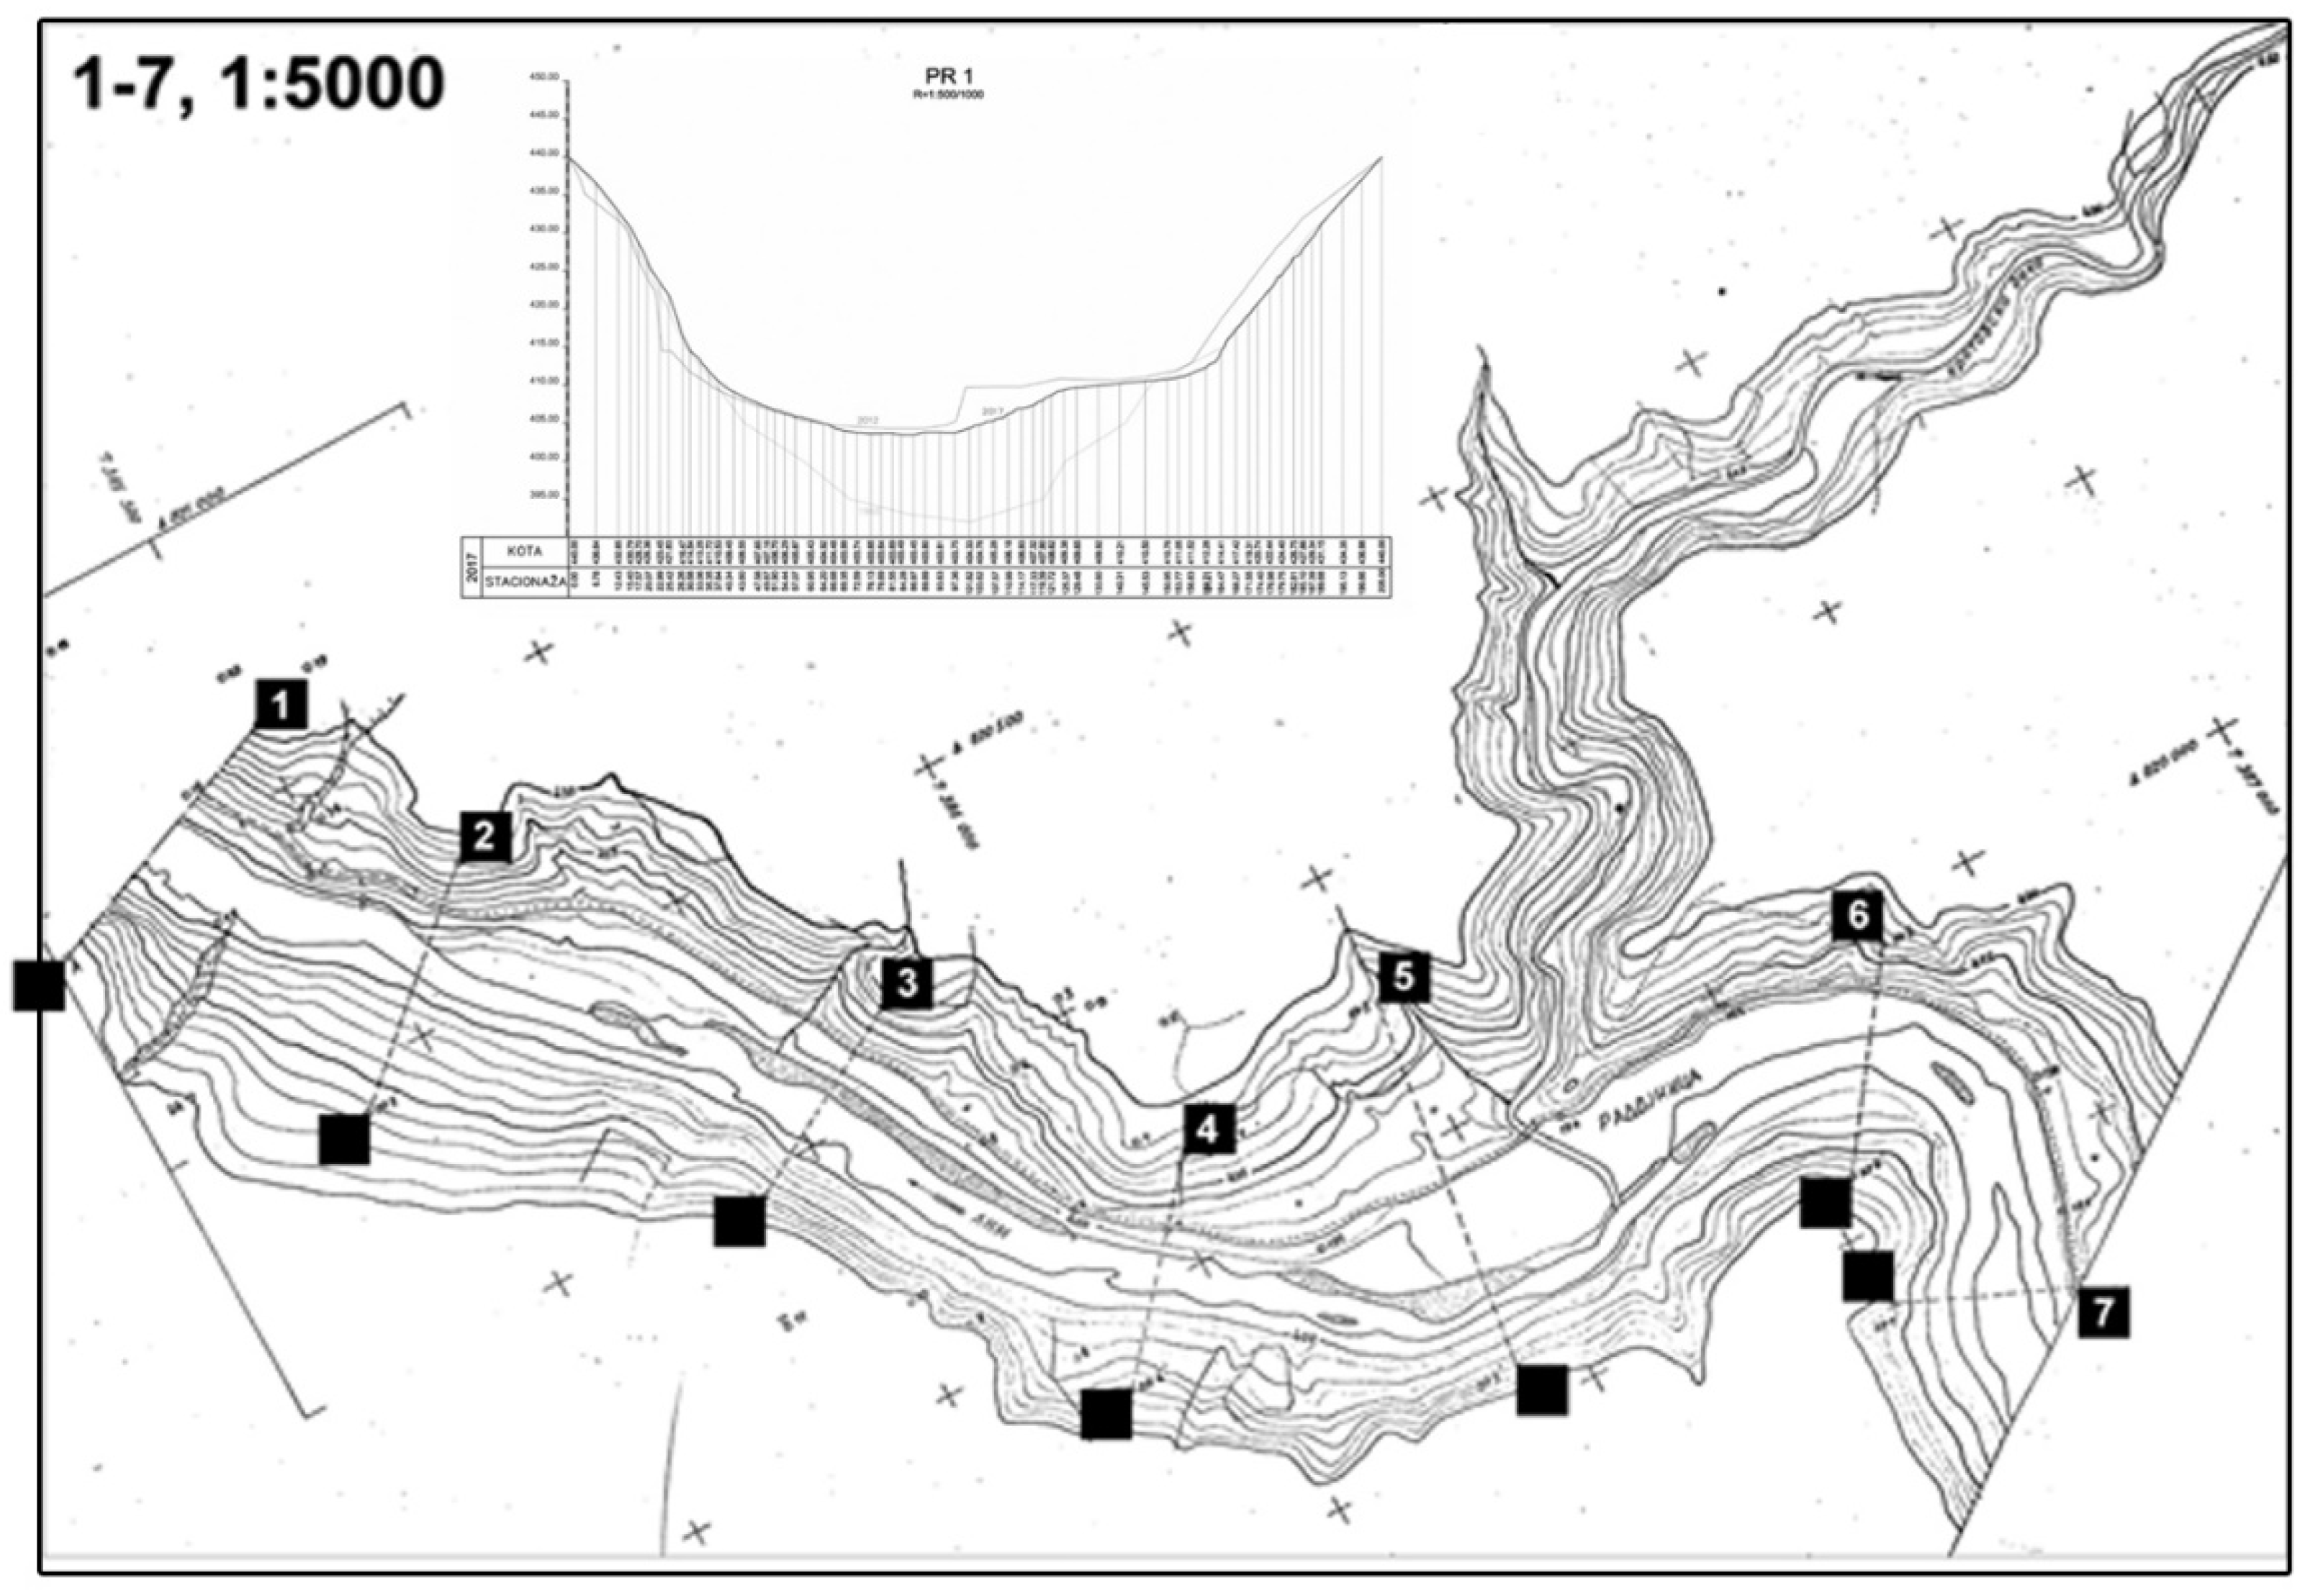
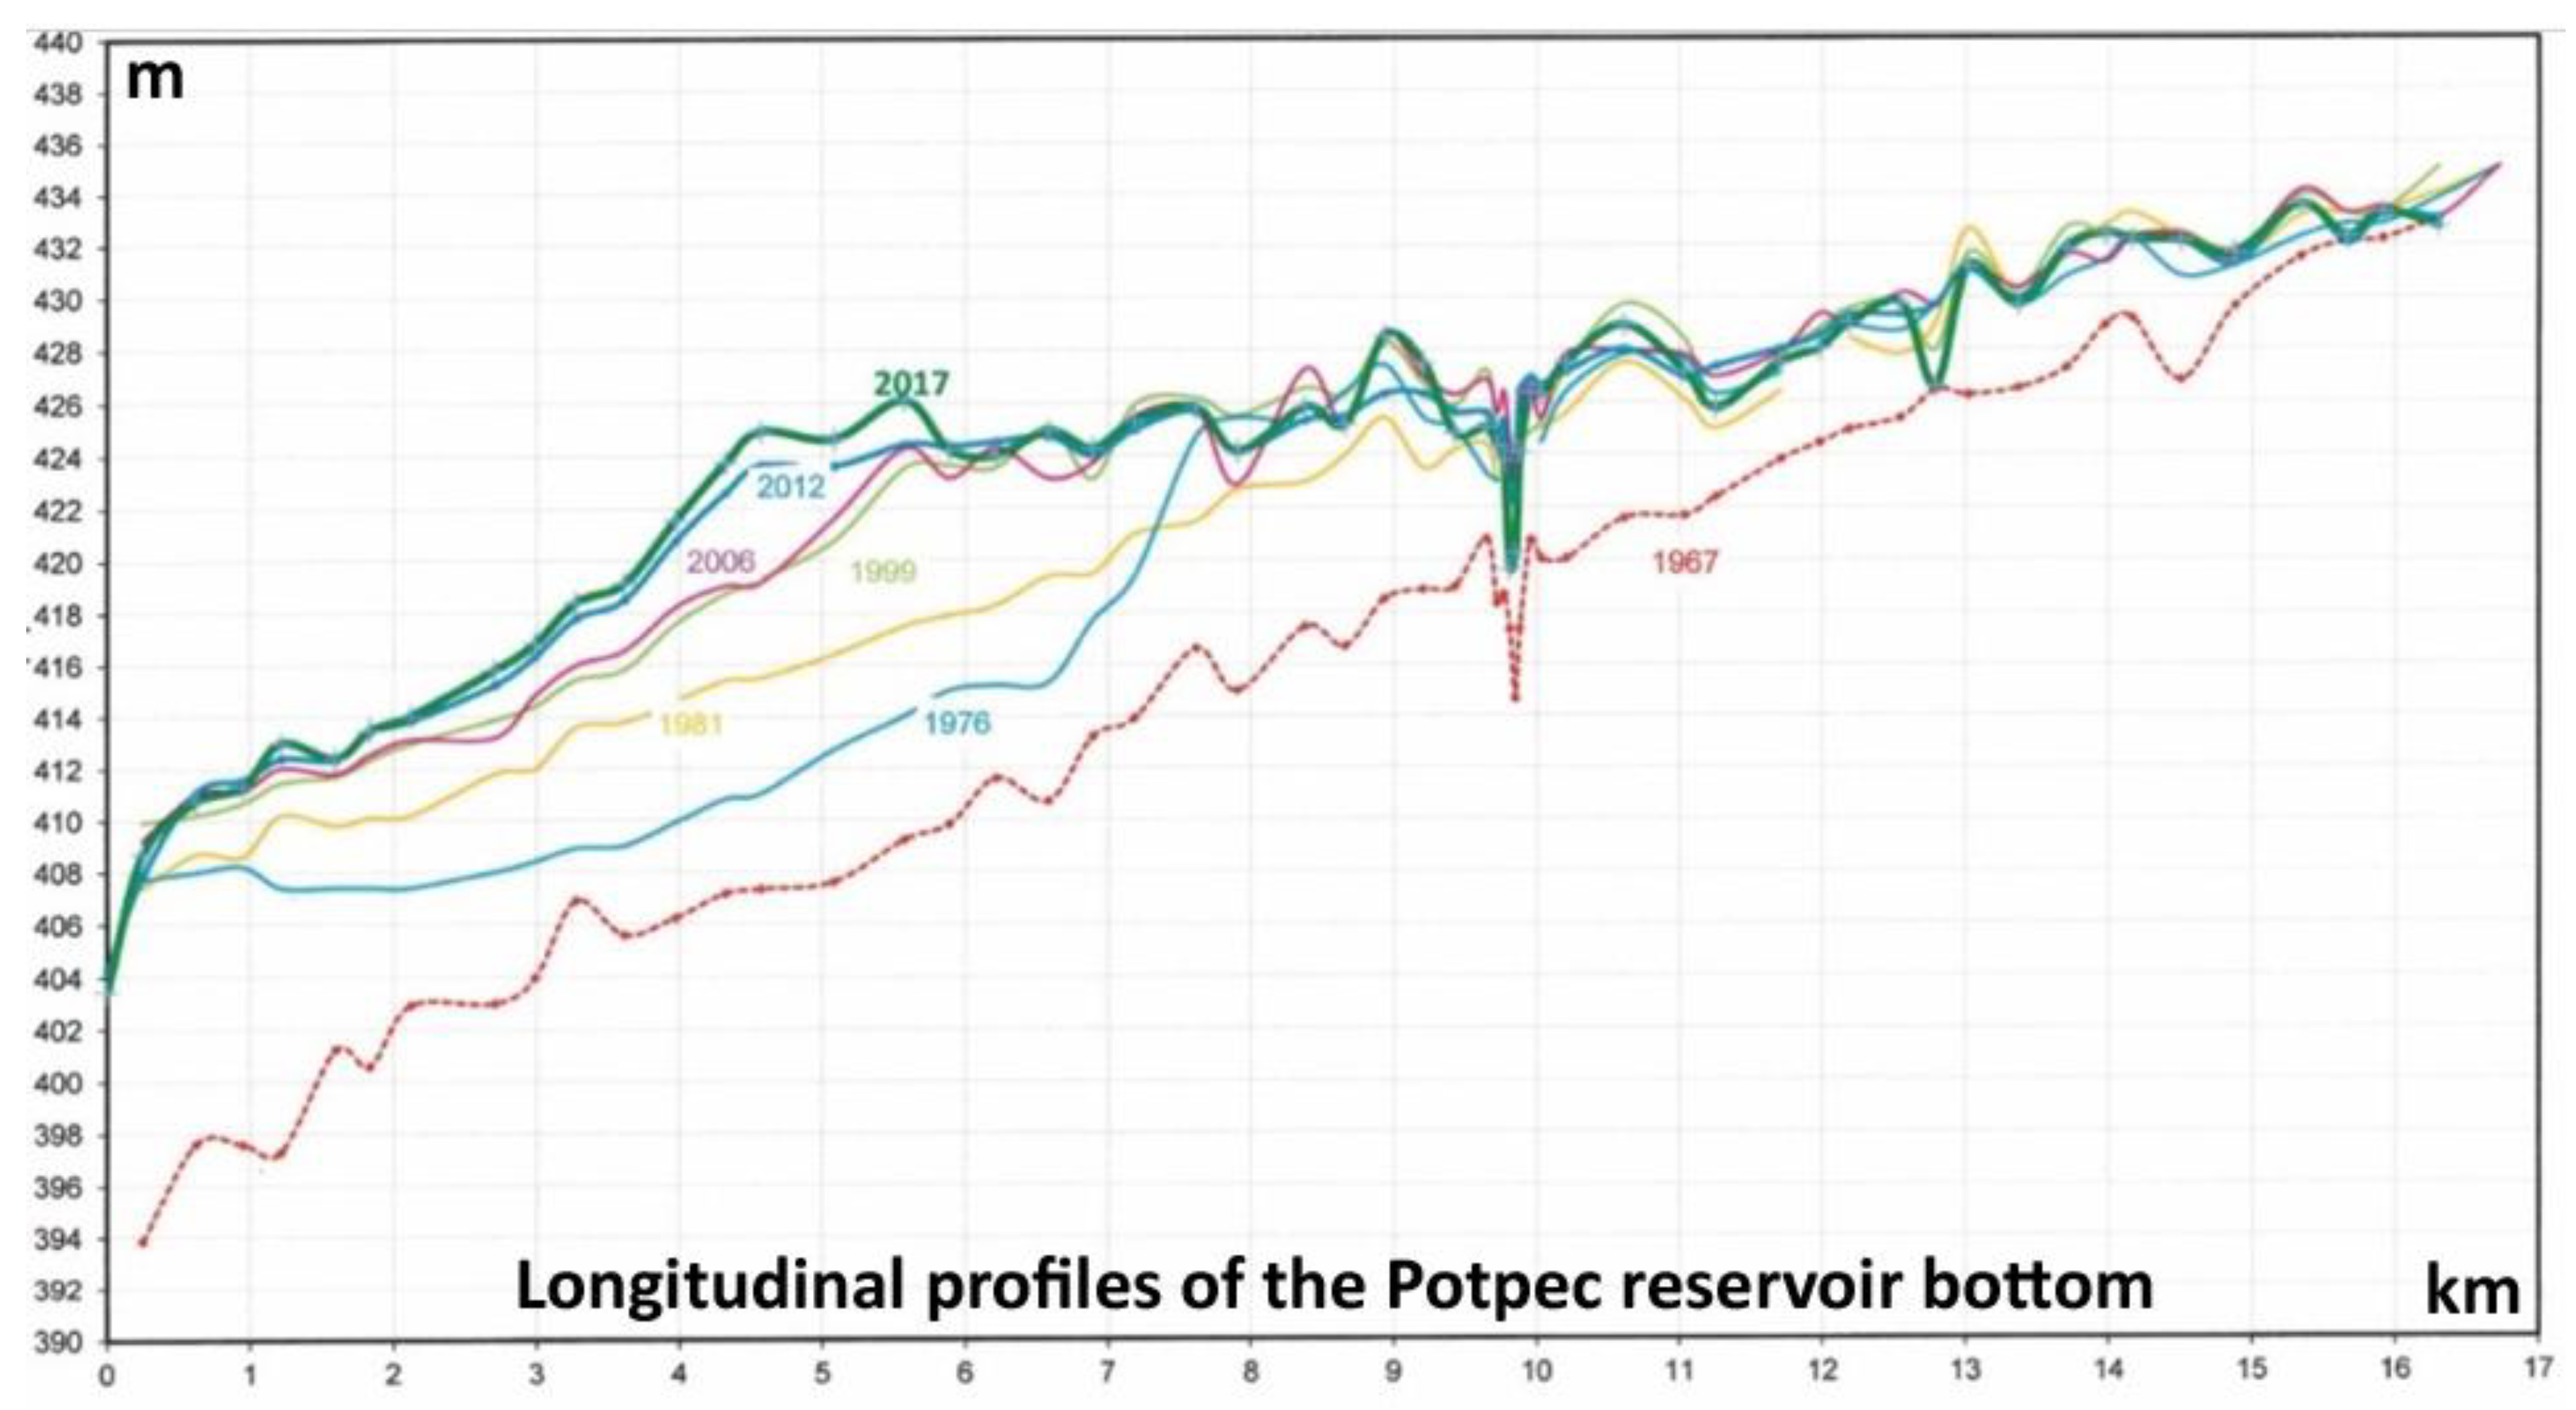
4.5. Lim River Reservoir Sedimentation Survey
5. Discussion
6. Conclusions
Supplementary Materials
Author Contributions
Funding
Acknowledgments
Conflicts of Interest
References
- Gudino-Elizondo, N.; Biggs, T.W.; Bingner, R.L.; Langendoen, E.J.; Kretzschmar, T.; Taguas, E.V.; Taniguchi-Quan, K.T.; Liden, D.; Yuan, Y. Modelling Runoff and Sediment Loads in a Developing Coastal Watershed of the US-Mexico Border. Water 2019, 11, 1024. [Google Scholar] [CrossRef] [PubMed] [Green Version]
- Dimotta, A.; Cozzi, M.; Romano, S.; Lazzari, M. Soil Loss, Productivity and Cropland Values GIS-Based Analysis and Trends in the Basilicata Region (Southern Italy) from 1980 to 2013; ICCSA 2016, Part IV, Lecture Notes in Computer Science, 9789; Gervasi, O., Ed.; Springer: Cham, Switzerland, 2016; pp. 29–45. [Google Scholar] [CrossRef]
- Dimotta, A.; Lazzari, M.; Cozzi, M.; Romano, S. Soil Erosion Modelling on Arable Lands and Soil Types in Basilicata, Southern Italy; ICCSA 2017, Part V, Lecture Notes in Computer Science LNCS, 10408; Gervasi, O., Ed.; Springer: Cham, Switzerland, 2017; pp. 57–72. [Google Scholar] [CrossRef]
- Chalise, D.; Kumar, L.; Spalevic, V.; Skataric, G. Estimation of Sediment Yield and Maximum Outflow Using the IntErO Model in the Sarada River Basin of Nepal. Water 2019, 11, 952. [Google Scholar] [CrossRef] [Green Version]
- Hazbavi, Z.; Sadeghi, S.H.; Gholamalifard, M. Dynamic analysis of soil erosion-based watershed health. Geogr. Environ. Sustain. 2019, 12, 43–59. [Google Scholar]
- Nikolic, G.; Spalevic, V.; Curovic, M.; Khaledi Darvishan, A.; Skataric, G.; Pajic, M.; Kavian, A.; Tanaskovik, V. Variability of Soil Erosion Intensity Due to Vegetation Cover Changes: Case Study of Orahovacka Rijeka, Montenegro. Not. Bot. Horti Agrobot. Cluj-Napoca 2018, 47, 237–248. [Google Scholar] [CrossRef] [Green Version]
- Ballesteros-Cánovas, J.A.; Czajka, B.; Janecka, K.; Lempa, M.; Kaczka, R.J.; Stoffel, M. Flash floods in the Tatra Mountain streams: Frequency and triggers. Sci. Total Environ. 2015, 511, 639–648. [Google Scholar] [CrossRef]
- Verheijen, F.G.A.; Jones, R.J.A.; Rickson, R.J.; Smith, C.J. Tolerable versus actual soil erosion rates in Europe. Earth Sci. Rev. 2009, 94, 23–38. [Google Scholar] [CrossRef] [Green Version]
- Dragicevic, N.; Karleusa, B.; Ozanic, N. Different Approaches to Estimation of Drainage Density and Their Effect on the Erosion Potential Method. Water 2019, 11, 593. [Google Scholar] [CrossRef] [Green Version]
- Kisic, I.; Basic, F.; Nestroy, O.; Sabolic, M. Global Change-Challenges for soil management, Advances in Geoecology. In Soil Erosion under Different Tillage and Cropping Systems in Central Croatia; Catena Verlag GMBH: Reiskirchen, Germany, 2010; pp. 141–150. [Google Scholar]
- Glavan, M.; Milicic, V.; Pintar, M. Finding options to improve catchment water quality Lessons learned from historical land use situations in a Mediterranean catchment in Slovenia. Ecol. Model. 2013, 261, 58–73. [Google Scholar] [CrossRef]
- Volk, M.; Liersch, S.; Schmidt, G. Towards the implementation of the European Water Framework Directive? Lessons learned from water quality simulations in an agricultural watershed. Land Use Policy 2009, 26, 580–588. [Google Scholar] [CrossRef]
- Spalevic, V. Impact of Land Use on Runoff and Soil Erosion in Polimlje. Ph.D. Thesis, Faculty of Agriculture, University of Belgrade, Belgrade, Serbia, 2011; pp. 1–260. [Google Scholar]
- Kostadinov, S.; Braunović, S.; Dragićević, S.; Zlatić, M.; Dragović, N.; Rakonjac, N. Effects of Erosion Control Works: Case Study—Grdelica Gorge, the South Morava River (Serbia). Water 2018, 10, 1094. [Google Scholar] [CrossRef] [Green Version]
- Gocić, M.; Dragićević, S.; Radivojević, A.; Martić Bursać, N.; Stričević, L.; Đorđević, M. Changes in Soil Erosion Intensity Caused by Land Use and Demographic Changes in the Jablanica River Basin, Serbia. Agriculture 2020, 10, 345. [Google Scholar] [CrossRef]
- Gavrilovic, S. Engineering of Torrential Flows and Erosion; Izgradnja: Beograd, Serbia, 1972; 272p. [Google Scholar]
- Dragicevic, S.; Pripuzic, M.; Zivkovic, N.; Novkovic, I.; Kostadinov, S.; Langovic, M.; Milojkovic, B.; Cvorovic, Z. Spatial and Temporal Variability of Bank Erosion during the Period 1930–2016: Case Study-Kolubara River Basin (Serbia). Water 2017, 9, 748. [Google Scholar] [CrossRef] [Green Version]
- Tosic, R.; Dragicevic, S.; Zlatic, M.; Todosijevic, M.; Kostadinov, S. The impact of socio-demographic changes on land use and soil erosion (case study: Ukrina River catchment). Geogr. Rev. 2012, 46, 69–78. [Google Scholar]
- Kaloper, S.E.; Čadro, S.; Uzunović, M.; Cherni-Čadro, S. Determination of erosion intensity in Brka watershed, Bosnia and Herzegovina. Agric. For. 2020, 66, 79–92. [Google Scholar] [CrossRef]
- Dragičević, N.; Karleuša, B.; Ožanić, N. GIS based monitoring database for Dubračina river catchment area as a tool for mitigation and prevention of flash flood and erosion. In Proceedings of the thirteenth International Symposium on Water Management and Hydraulic Engineering, Bratislava, Sovakia, 9–12 September 2013; pp. 553–565. [Google Scholar]
- Milevski, I.; Blinkov, I.; Trendafilov, A. Soil erosion processes and modelling in the upper Bregalnica catchment. In Proceedings of the Conference of the Danubial Countries on the Hydrological Forecasting and Hydrological Bases of Water Management (XXIV), Bled, Slovenia, 2–4 June 2008; pp. 1–10. [Google Scholar]
- Tazioli, A. Evaluation of erosion in equipped basins: Preliminary results of a comparison between the Gavrilovic model and direct measurements of sediment transport. Environ. Geol. 2009, 56, 825–831. [Google Scholar] [CrossRef]
- Zorn, M.; Komac, B. The importance of measuring erosion processes on the example of Slovenia. Hrvat. Geogr. Glas. 2011, 73, 19–34. [Google Scholar] [CrossRef] [Green Version]
- Kayimierski, L.D.; Irigoyen, M.; Re, M.; Menendey, A.N.; Spalletti, P.; Brea, J.D. Impact of climate change on sediment yield from the upper Plata basin. Int. J. River Basin Manag. 2013, 11, 411–421. [Google Scholar]
- Tavares, A.S.; Spalevic, V.; Avanzi, J.C.; Nogueira, D.A.; Silva, M.L.N.; Mincato, R.L. Modeling of water erosion by the erosion potential method in a pilot subbasin in southern Minas Gerais. Semin. Ciências Agrárias 2019, 40, 555–572. [Google Scholar] [CrossRef] [Green Version]
- Ouallali, A.; Aassoumi, H.; Moukhchane, M.; Moumou, A.; Houssni, M.; Spalevic, V.; Keesstra, S. Sediment mobilization study on Cretaceous, Tertiary and Quaternary lithological formations of an external Rif catchment, Morocco. Hydrol. Sci. J. 2020, 65, 1568–1582. [Google Scholar] [CrossRef]
- Ali, S.S.; Al-Umary, F.A.; Salar, S.G.; Al-Ansari, N.; Knutsson, S. GIS Based Soil Erosion Estimation Using EPM Method, Garmiyan Area, Kurdistan Region, Iraq. J. Civ. Eng. Archit. 2016, 10, 291–308. [Google Scholar] [CrossRef] [Green Version]
- Hazbavi, Z.; Azizi, E.; Sharifi, Z.; Alaei, N.; Mostafazadeh, R.; Behzadfar, M.; Spalevic, V. Comprehensive estimation of erosion and sediment components using IntErO model in the KoozehTopraghi Watershed, Ardabil Province. Environ. Eros. Res. J. 2020, 10, 92–110. [Google Scholar]
- Barovic, G.; Silva, M.L.N.; Batista, P.V.G.; Vujacic, D.; Soares Souza, W.; Avanzi, J.C.; Behzadfar, M.; Spalevic, V. Estimation of sediment yield using the IntErO model in the S1-5 Watershed of the Shirindareh River Basin, Iran. Agric. For. 2015, 61, 233–243. [Google Scholar] [CrossRef] [Green Version]
- Behzadfar, M.; Tazioli, A.; Vukleic-Shutoska, M.; Simunic, I.; Spalevic, V. Calculation of Sediment yield in the S1-1 watershed, Shirindareh watershed, Iran. Agric. For. 2014, 60, 207–216. [Google Scholar]
- Moradi, S.; Limaei, S.M.; Khanmohammadi, M. Calculation of sediment yield in the Zemkan River Basin of Iran using analytical methods and GIS concept. Agric. For. 2015, 61, 157–171. [Google Scholar] [CrossRef]
- Amini, H.; N’Jalaliyan, A.H.; Khalilizadeh, M.; Baharlouie, J. A comparison of EPM and WEPP models for estimating soil erosion of Marmeh Watershed in the South Iran. Agric. For. 2014, 60, 299–315. [Google Scholar]
- Kouhpeima, A.; Hashemi, S.A.A.; Feiznia, S. A study on the efficiency of erosion potential model (EPM) using reservoir sediments. Elixir Pollut. 2011, 38, 4135–4139. [Google Scholar]
- Sadeghi, S.H. Semi-Detailed Technique for Soil Erosion Mapping Based on BLM and Satellite Image Applications. J. Agric. Sci. Technol. 2005, 7, 133–142. [Google Scholar]
- Poornazari, N.; Khalilimoghadam, B.; Hazbavi, Z.; Bagheri, M. Land degradation assessment in the dust hotspot of southeastern Ahvaz, Iran. Land Degrad. Dev. 2020. Accepted Author Manuscript. [Google Scholar] [CrossRef]
- Jorda-Capdevila, D.; Casals, L.C. Water Management in the Media and Research: Dissemination in Catalonia and Its Capture by Private Companies. Int. Multidiscip. J. Soc. Sci. 2019, 8, 267–288. [Google Scholar] [CrossRef]
- Dimitrijevic, M.D. Coloured map of the Geology of Serbia, with overlay and legend. In Geological Atlas of Serbia, 1:2,000,000; Grafimex: Belgrade, Serbia, 1992. [Google Scholar]
- Zivaljevic, M. Tumac Geoloske Karte SR Crne Gore, 1:200 000; Posebna izdanja Geoloskog Glasnika, Knjiga VIII; Titograd, Montenegro, 1989. [Google Scholar]
- Fustic, B.; Djuretic, G. Soils of Montenegro [Zemljista Crne Gore]; Spalevic, V., Ed.; Biotechnical Institute, University of Montenegro: Podgorica, Montenegro, 2000; pp. 1–626. [Google Scholar]
- Chang, A.Y.; Parrales, M.E.; Jimenez, J.; Sobieszczyk, M.E.; Hammer, S.M.; Copenhaver, D.J.; Kulkarni, R.P. Combining Google Earth and GIS mapping technologies in a dengue surveillance system for developing countries. Int. J. Health Geogr. 2009, 8, 49. [Google Scholar] [CrossRef] [PubMed] [Green Version]
- Karkanis, P.G.; Au, K.; Schaalje, G.B. Comparison of 4 measurement schedules for determination of soil particle-size distribution by the hydrometer method. Can. Agric. Eng. 1991, 33, 211–215. [Google Scholar]
- Thun, R.; Herrmann, R. Die Untersuchung von Boden; Neumann Velag: Radebeul/Berlin, Germany, 1949; pp. 15–28. [Google Scholar]
- Jakovljevic, M.; Pantovic, M.; Blagojevic, S. Laboratory Manual of Soil and Water Chemistry (in Serbian); Faculty of Agriculture: Belgrade, Serbia, 1995. [Google Scholar]
- Egner, H.H.; Domingo, W.R. Untersuchungen über die chemische Bodenanalyse als Grundlage für die Beurteilung des Nährstoffzustandes der Böden. II. Chemische Extraktionsmethoden zur Phosphor-und Kaliumbes-timmung. Kungliga Lantbrukshˆgskolans Annaler 1960, 26, 199–215. [Google Scholar]
- Kappen, H. Die Bodenazidität; Springer: Berlin/Heidelberg, Germany, 1929; 363p. [Google Scholar]
- Blinkov, I.; Kostadinov, S. Applicability of various erosion risk assessment methods for engineering purposes. In Proceedings of the BALWOIS 2010 Conference, Ohrid, North Macedonia, 25–29 May 2010. [Google Scholar]
- Ristic, R.; Radic, B.; Vasiljevic, N.; Nikic, Z. Land use change for flood protection—A prospective study for the restoration of the river Jelasnica watershed. Bull. Fac. For. 2011, 103, 115–130. [Google Scholar] [CrossRef]
- Spalevic, V. Application of Computer-Graphic Methods in the Studies of Draining Out and Intensities of Ground Erosion in the Berane Valley. Master’s Thesis, Faculty of Agriculture of the University of Belgrade, Belgrade, Serbia, 1999; 135p. [Google Scholar]
- Vujacic, D.; Barovic, G.; Tanaskovikj, V.; Kisic, I.; Song, X.; Silva, M.L.N.; Spalevic, V. Calculation of runoff and sediment yield in the Pisevska Rijeka Watershed, Polimlje, Montenegro. Agric. For. 2015, 61, 225–234. [Google Scholar] [CrossRef]
- Vujacic, D.; Spalevic, V. Assessment of Runoff and Soil Erosion in the Radulicka Rijeka Watershed, Polimlje, Montenegro. Agric. For. 2016, 62, 283–292. [Google Scholar] [CrossRef] [Green Version]
- Spalevic, V.; Dlabac, A.; Spalevic, B.; Fustic, B.; Popovic, V. Application of computer—Graphic methods in the research of runoff and intensity of ground erosion—I program “River basins”. Agric. For. 2000, 46, 19–36. [Google Scholar]
- Efthimiou, N.; Lykoudi, E. Soil erosion estimation using the EPM model. In Proceedings of the 14th International Conference of the Geological Society of Greece, Thessaloniki, Greece, 25–27 May 2016; Volume L. [Google Scholar]
- Shahabi, H.; Salari, M.; Bin Ahmad, B.; Mohammadi, A. Soil Erosion Hazard Mapping in Central Zab Basin Using EPM Model in GIS Environment. Int. J. Geogr. Geol. 2016, 5, 224–235. [Google Scholar] [CrossRef]
- Noori, H.; Siadatmousavi, S.M.; Mojaradi, B. Assessment ofsediment yield using RS and GIS at two sub-basins of Dez Watershed, Iran. Int. Soil Water Conserv. Res. 2016, 4, 199–206. [Google Scholar] [CrossRef] [Green Version]
- Kojchevska, T. EPM for Soil Loss Estimation in Different Geomorphologic Conditions and Data Conversion by Using GIS. Ph.D. Thesis, Mediterranean Agronomic Institute, Chania, Greece, 2014. [Google Scholar]
- Dragicevic, N.; Karleusa, B.; Ozanic, N. Erosion Potential Method (Gavrilovic method) sensitivity analysis. Soil Water Res. 2017, 12, 51–59. [Google Scholar] [CrossRef] [Green Version]
- Milanesi, L.; Pilotti, M.; CleriCi, A.; GavriloviC, Z. Application of an improved version of the Erosion Potential Method in Alpine areas. Ital. J. Eng. Geol. Environ. 2015, 1, 17–30. [Google Scholar] [CrossRef]
- Gavrilovic, Z. Use of an empirical method (Erosion Potential Method) for calculating sediment production and transportation in unstudied or torrential streams. In International Conference on River Regime; Hydraulics Research Ltd.: Wallingford, UK, 1988; pp. 411–422. [Google Scholar]
- Staut, M. Recent Erosional Processes in the Catchment of the Dragonja River. Ph.D. Thesis, University of Ljubljana, Ljubljana, Slovenia, 2004. Unpublished. [Google Scholar]
- Langbein, W.B.; Schumm, S.A. Yield of sediment in relation to mean annual precipitation. Eos Trans. Am. Geophys. Union 1958, 39, 1076–1084. [Google Scholar] [CrossRef] [Green Version]
- Walling, D.E. Sediment yields and sediment budgets. In Encyclopaedia of Hydrological Sciences; Anderson, M.G., McDonnell, J.J., Eds.; Wiley: Hoboken, NJ, USA, 2005; pp. 1283–1304. [Google Scholar]
- White, S. Sediment yield prediction and modelling. In Encyclopaedia of Hydrological Sciences; Anderson, M.G., McDonnell, J.J., Eds.; Wiley: Hoboken, NJ, USA, 2005; pp. 1315–1326. [Google Scholar]
- Dunkerley, D. How is overland flow produced under intermittent rain? An analysis using plot-scale rainfall simulation on dryland soils. J. Hydrol. 2018, 556, 119–130. [Google Scholar] [CrossRef]
- Arnoldus, H.M.J. An approximation of the rainfall factor in the Universal Soil Loss Equation. In Assessment of Erosion; Wiley: Hoboken, NJ, USA, 1980; pp. 127–132. [Google Scholar]
- Wraber, T. Map of Natural Potential Vegetation of SFR Yugoslavia, Scale 1:1 000 000; Jovan Hadzi Biological Institute ZRC SAZU: Skopje, North Macedonia, 1983. [Google Scholar]
- Dees, M.; Andjelic, M.; Fetic, A.; Jokanovic, B.; Tepavcevic, V.; Borota, D.; Vasiljevic, A.; Weinreih, A.; Hahn, N.; Markovic, D.; et al. The First National Forest Inventory of Montenegro; Ministry of Agriculture and Rural Development, Government of Montenegro: Podgorica, Montenegro, 2013; pp. 1–347.
- Nyssen, J.; Van den Branden, J.; Spalevic, V.; Frankl, A.; Van de Velde, L.; Curovic, M.; Billi, P. Twentieth century land resilience in Montenegro and consequent hydrological response. Land Degrad. Dev. 2014, 25, 336–349. [Google Scholar] [CrossRef] [Green Version]
- Grimes, A.P.; Latif, M.A.; Vujadinovic-Colic, J.; Buskovic, V. Biodiversity Assessment Update for Serbia and Montenegro; USAID/Serbia-Montenegro: Belgrade, Serbia, 2005. [Google Scholar]
- Spalevic, V.; Barovic, G.; Fikfak, A.; Kosanovic, S.; Djurovic, M.; Popovic, S. Sediment yield and Land use changes in the Northern Montenegrin Watersheds: Case study of Seocki Potok of the Polimlje Region. J. Environ. Prot. Ecol. 2016, 17, 990–1002. [Google Scholar]
- Spalevic, V.; Curovic, M.; Tanaskovic, V.; Djurovic, N.; Lenaerts, T.; Nyssen, J. Application of the IntErO model for the assessment of the soil erosion intensity and runoff of the river basin Dragovo Vrelo, Montenegro. Turk. J. Agric. Sci. 2015, 1, 1072–1079. [Google Scholar]
- Spalevic, V.; Radanovic, D.; Behzadfar, M.; Djekovic, V.; Andjelkovic, A.; Milosevic, N. Calculation of the sediment yield of the Trebacka Rijeka, Polimlje, Montenegro. Agric. For. 2014, 60, 259–272. [Google Scholar]
- Spalevic, V.; Grbovic, K.; Gligorevic, K.; Curovic, M.; Billi, P. Calculation of runoff and soil erosion on the Tifran watershed, Polimlje, North-East of Montenegro. Agric. For. 2013, 59, 5–17. [Google Scholar]
- Spalevic, V.; Mahoney, W.; Djurovic, N.; Üzen, N.; Curovic, M. Calculation of soil erosion intensity and maximum outflow from the Rovacki river basin, Montenegro. Agric. For. 2012, 58, 7–21. [Google Scholar]
- Brune, G.M. Trap efficiency of reservoirs. Trans. Am. Geophys. Union 1953, 34, 407–418. [Google Scholar] [CrossRef]
- Churchill, M.A. Analysis and Use of Reservoir Sedimentation Data. In Proceedings of the Federal Interagency Sedimentation Conference (FIASC), Denver, CO, USA, 6–8 May 1947; Gottschalk, L.C., Ed.; pp. 139–140. [Google Scholar]
- Roberts, C.P.R. Flow Profile Calculations; Hydro 82; University of Pretoria: Pretoria, South Africa, 1982. [Google Scholar]
- Kostadinov, S.; Zlatic, M.; Dragovic, N.; Gavrilovic, Z. Soil Erosion in Serbia and Montenegro, Soil Erosion in Europe; Bordman, J., Poesen, J., Eds.; John Wiley & Sons, Ltd.: Hoboken, NJ, USA, 2006; pp. 271–277. [Google Scholar]
- Bagherzadeh, A.; Daneshvae, M.R.M. Sediment yield assessment by EPM and PSIAC models using GIS data in semi-arid region. Front. Earth Sci. 2011, 5, 207. [Google Scholar] [CrossRef]
- Haghizadeh, A.; Shui, L.T.; Godarzi, E. Forecasting sediment with erosion potential method with emphasis on Land use changes at basin, electronic. J. Geotech. Eng. 2009, 14, 1–12. [Google Scholar]
- Bemporad, G.A.; Alterach, J.; Amighetti, F.F.; Peviani, M.; Saccardo, I. A distributed approach for sediment yield evaluation in Alpine regions. J. Hydrol. 1997, 197, 370–392. [Google Scholar] [CrossRef]
- Abadi, L.Z.; Ahmadi, H. Comparison of EPM and geomorphology methods for erosion and sediment yield assessment in Kasilian Watershed, Mazandaran Province, Iran. Desert 2011, 16, 103–109. [Google Scholar]
- Ghobadi, Y.; Pirasteh, S.; Pradhan, B.; Ahmad, N.B.; Shafri, H.Z.B.M.; Sayyad, G.A.; Kabiri, K. Determine of correlation coefficient between EPM and MPSIAC models and generation of erosion maps by GIS techniques in Baghmalek watershed, Khuzestan, Iran. In Proceedings of the 5th Symposium on Advances in Science and Technology SAStech, Mashhad, Iran, 12 May 2011; pp. 1–12. [Google Scholar]
- Silva, M.A.; Silva, M.L.N.; Curi, N.; Oliveira, A.H.; Avanzi, J.C.; Norton, L.D. Water erosion risk prediction in eucalyptus plantation. Ciência Agrotecnol. 2014, 38, 160–172. [Google Scholar] [CrossRef] [Green Version]
- Silva, M.A.; Silva, M.L.N.; Curi, N.; Avanzi, J.C.; Leite, F.P. Sistemas de manejo em plantios florestais de eucalipto e perdas de solo e água na região do Vale do Rio Doce, MG. Ciência Florest. 2011, 21, 765–776. [Google Scholar] [CrossRef] [Green Version]
- Avanzi, J.C.; Silva, M.L.N.; Curi, N.; Norton, L.D.; Beskow, S.; Martins, S.G. Spatial distributed model for assessing soil erosion risk in a small watershed. Ciência Agrotecnol. 2013, 37, 427–434. [Google Scholar] [CrossRef] [Green Version]
- Avanzi, J.C. Soil Properties, Conditions and Soil Losses for South and East Brazilian Forest Areas. Ph.D. Thesis, Federal University of Lavras, Lavras, Brazil, 2009; pp. 1–76. [Google Scholar]
- Melovic, B.; Cirovic, D.; Dudic, B.; Vulic, T.B.; Gregus, M. The Analysis of Marketing Factors Influencing Consumers’ Preferences and Acceptance of Organic Food Products—Recommendations for the Optimization of the Offer in a Developing Market. Foods 2020, 9, 259. [Google Scholar] [CrossRef] [Green Version]
- B Babic Mladenovic, M.; Obuskovic, Z.; Knezevic, Z. Zasipanje akumulacija u Srbiji-Problemi i pravci resavanja [Siltation in Serbia-Problems and directions of solving]. Vodoprivreda 2003, 35, 387–393. [Google Scholar]
- Preciso, E.; Salemi, E.; Billi, P. Land use changes, torrent control works and sediment mining: Effects on channel morphology and sediment flux, case study of the Reno River (Northern Italy). Hydrol. Process. 2012, 26, 1134–1148. [Google Scholar] [CrossRef]


| Jan | Feb | Mar | Apr | May | Jun | Jul | Aug | Sep | Oct | Nov | Dec | |
|---|---|---|---|---|---|---|---|---|---|---|---|---|
| Max. daily precipitation in mm | ||||||||||||
| Max. | 68.6 | 92.8 | 73 | 93.3 | 42.6 | 58.5 | 97.8 | 55.8 | 95.6 | 157.6 | 101.6 | 79.4 |
| Aver. | 23.4 | 22.8 | 21.5 | 24 | 21.9 | 20.6 | 21.7 | 21.1 | 25.3 | 29 | 29 | 23.5 |
| St.D. | 15.6 | 18.6 | 13 | 15 | 9.9 | 12.4 | 15.2 | 11.9 | 17.2 | 24.6 | 16.2 | 14.7 |
| Mean monthly temperatures in °C | ||||||||||||
| Max. | 2.9 | 5.8 | 7.8 | 12.6 | 15.8 | 18.2 | 20.8 | 20.9 | 17.7 | 12.6 | 8.6 | 4.4 |
| Min. | −5.6 | −5.2 | −0.7 | 6.1 | 9.8 | 14.1 | 16.2 | 14.3 | 11.3 | 6.2 | −1.6 | −4.7 |
| Aver. | −1.6 | 0.8 | 4.6 | 8.9 | 13.3 | 16.3 | 18.1 | 17.7 | 14.3 | 9.4 | 4.5 | 0.1 |
| St.D. | 2.2 | 2.7 | 2.1 | 1.3 | 1.3 | 1 | 1.1 | 1.4 | 1.5 | 1.4 | 2.1 | 2.2 |
| Max. daily temperatures in °C | ||||||||||||
| Max. | 15.4 | 20.9 | 25.6 | 28.1 | 32.4 | 35.5 | 36.8 | 39.2 | 36 | 29.5 | 23 | 19.2 |
| Aver. | 11.7 | 14.5 | 20.1 | 23.6 | 27.6 | 30.4 | 32.8 | 32.8 | 29.4 | 24.8 | 18.6 | 13.6 |
| St.D. | 2.8 | 3 | 3.1 | 2.3 | 2.2 | 2.5 | 2 | 2.5 | 2.6 | 2.6 | 2.8 | 3.3 |
| Min. daily temperatures in °C | ||||||||||||
| Min. | −27.6 | −24.5 | −16.5 | −7.5 | −4 | 0 | 1.2 | 2.6 | −4 | −7.2 | −15.4 | −21.7 |
| Aver. | −15.1 | −13 | −8.4 | −2.8 | 0.9 | 4.8 | 6.5 | 6.1 | 2.3 | −2.5 | −7.3 | −12.6 |
| St.D. | 5.3 | 4.7 | 4.1 | 1.8 | 2 | 1.8 | 2.1 | 1.5 | 2.5 | 2.3 | 3.7 | 4.6 |
| Categories | Erosion Intensity | Erosion Coefficient (Z) | Average of Z |
|---|---|---|---|
| I | Very Severe | Z > 1.00 | Z = 1.25 |
| II | Severe | 0.71 < Z < 1.00 | Z = 0.85 |
| III | Moderate | 0.41 < Z < 0.70 | Z = 0.55 |
| IV | Weak | 0.20 < Z < 0.40 | Z = 0.30 |
| V | Very Weak | Z < 0.19 | Z = 0.10 |
| Coefficient of Soil Cover | X Value |
| Areas Without Vegetal Cover (Bare Land, Building Area, Water) | 0.8–0.9 |
| Crop Fields, Meadows, Grasslands | 0.6–0.8 |
| Built-up Areas and Crops, Degraded Shrublands | 0.4–0.6 |
| Arboricultural Lands, Clear Shrublands | 0.2–0.4 |
| Reforested Areas, Dense Forests, Dense Shrublands | 0.05–0.2 |
| Coefficient of Soil Resistance | Y Value |
| Marls, Clays, Poorly Consolidated Yellow Sands and Other Rock With Little Resistance | 1.3–1.7 |
| Weak Rock, Fine Clayey Pelites With Microbereccia Beds, Recent Quaternary Scree | 1–1.3 |
| Rock With Moderate Erosion Resistance, Limestone, Quaternary Fluvial Terraces | 0.6–1 |
| Hard Rock, Sandstone of the Numidian Nappe | 0.5–0.6 |
| Coefficient of Type and Extent of Erosion | Φ Value |
| Deep Ravines, Landslides, Badlands Areas, and Bank Undercutting | 0.8–0.9 |
| Sheet Erosion, Less than 50% of the Catchment Area With Rill and Gullies Erosion | 0.6–0.7 |
| 20% of the Area Attacked by Surface Erosion, Minor Slips in Stream Channels | 0.3–0.5 |
| Land Surface Without Visible Erosion, Mostly Crop Fields | 0.1–0.2 |
| Land Use Type | 1970 | 1980 | 1990 | 2000 | 2010 | 2020 |
|---|---|---|---|---|---|---|
| Forests-fs (sume) | 0.46 | 0.48 | 0.48 | 0.47 | 0.50 | 0.52 |
| Grass-ft (trave) | 0.39 | 0.40 | 0.40 | 0.38 | 0.37 | 0.38 |
| Bare Lands-fg (goleti) | 0.15 | 0.12 | 0.12 | 0.15 | 0.13 | 0.10 |
| Input | Symbol | Value | Unit |
|---|---|---|---|
| River Basin Area | F | 41.06 | km2 |
| The Length of the Watershed | O | 30.7 | km |
| Natural Length of the Main Watercourse | Lv | 6.33 | km |
| The Shortest Distance (the Fountainhead and Mouth) | Lm | 6.03 | km |
| The Total Length of the Main Watercourse With Tributaries | ΣL | 13.88 | km |
| River Basin Length Measured by A Series of Parallel Lines | Lb | 11.12 | km |
| The Area of the Bigger River Basin Part | Fv | 26.2 | km2 |
| The Area of the Smaller River Basin Part | Fm | 14.86 | km2 |
| Altitude of the First Contour Line | h0 | 600 | m |
| Equidistance | Δh | 100 | m |
| The Lowest River Basin Elevation | Hmin | 535 | m |
| The Highest River Basin Elevation | Hmax | 1553 | m |
| Very Permeable Products From Rocks (Limestone, Gravel) | fp | 0.12 | |
| Medium Permeable Rocks (Slates, Marls, Brownstone) | fpp | 0.04 | |
| Poor Water Permeability (Heavy Clay, Compact Eruptive) | fo | 0.84 | |
| The Volume of the Torrent Rain | hb | 84.7 | mm |
| Average Annual Air Temperature | t0 | 8.9 | °C |
| Average Annual Precipitation | H yr | 873.7 | mm |
| Types of Soil Products and Related Types | Y | 1.1 | |
| Numeral Equivalents of Clearly Exposed Erosion Process | φ | 0.33 |
| 1970 | 1980 | 1990 | 2000 | 2010 | 2020 | ||
|---|---|---|---|---|---|---|---|
| A Part of the River Basin Under Forests [-] | fs | 0.46 | 0.48 | 0.48 | 0.47 | 0.49 | 0.52 |
| Grass, Meadows, Pastures and Orchards [-] | ft | 0.39 | 0.40 | 0.40 | 0.38 | 0.37 | 0.38 |
| Bare Land, Plow-Land, Without Grass [-] | fg | 0.15 | 0.12 | 0.12 | 0.15 | 0.13 | 0.10 |
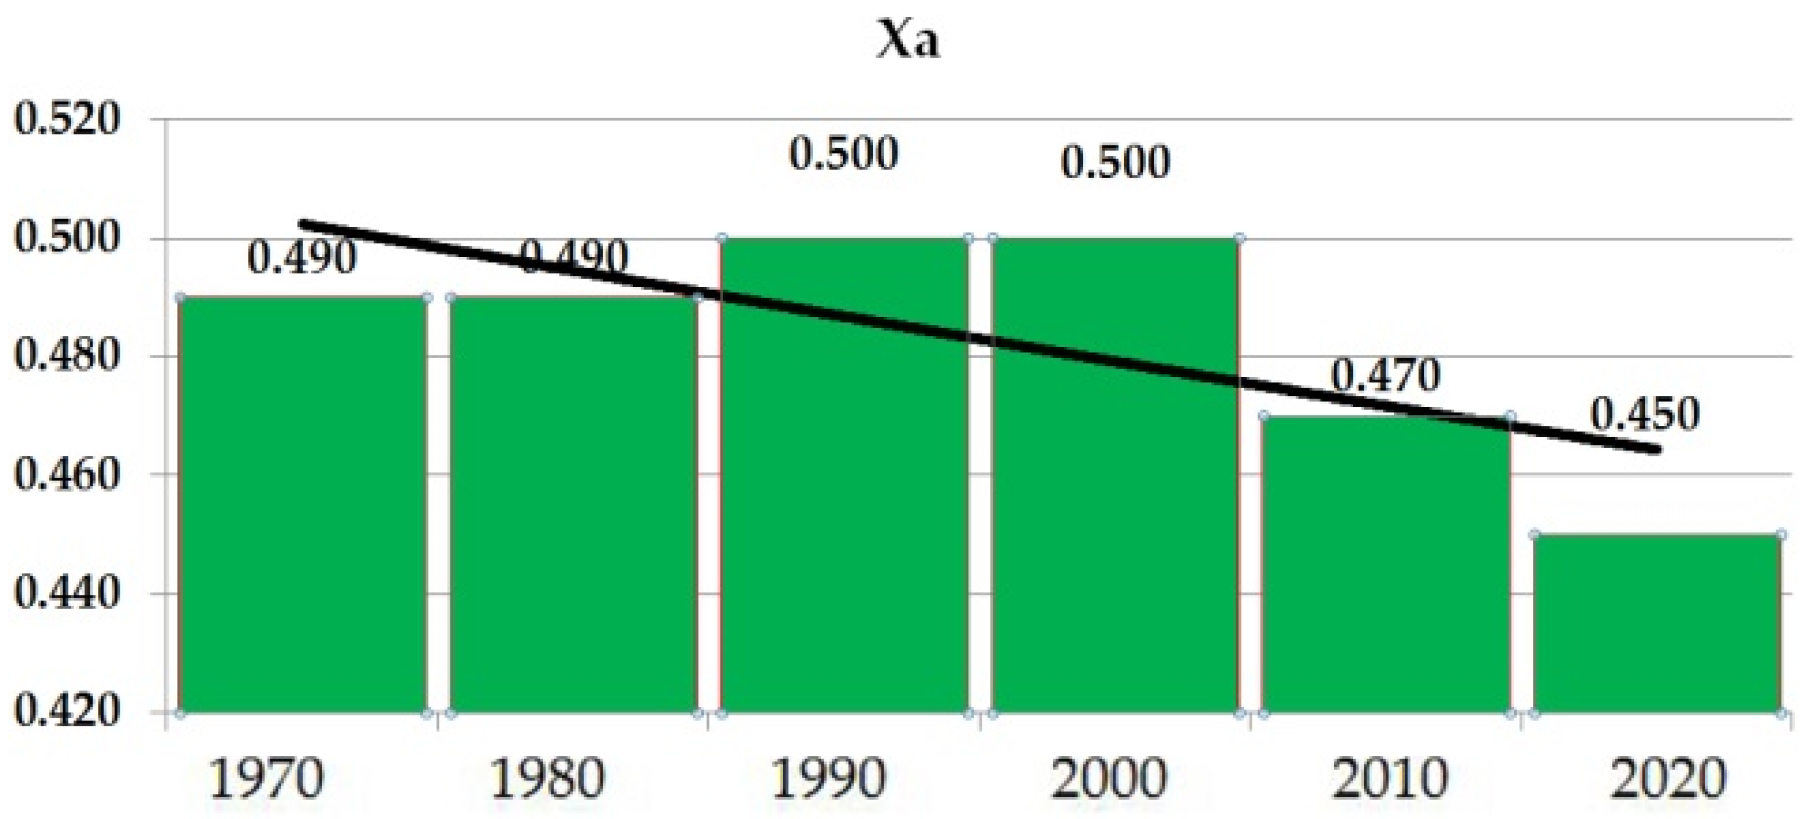
| Coefficient of the Basin Planning [-] | Xa | 0.49 | 0.49 | 0.50 | 0.50 | 0.47 | 0.45 |
| Coefficient of the River Basin Form [-] | A | 0.95 | 0.95 | 0.95 | 0.95 | 0.95 | 0.95 |
| Coefficient of the Watershed Development [-] | m | 0.28 | 0.28 | 0.28 | 0.28 | 0.28 | 0.28 |
| Average River Basin Width [km] | B | 3.69 | 3.69 | 3.69 | 3.69 | 3.69 | 3.69 |
| (A)symmetry of the River Basin [-] | a | 0.55 | 0.55 | 0.55 | 0.55 | 0.55 | 0.55 |
| Density of the River Network of the Basin [-] | G | 0.34 | 0.34 | 0.34 | 0.34 | 0.34 | 0.34 |
| Coefficient of the River Basin Tortuousness [m] | K | 1.05 | 1.05 | 1.05 | 1.05 | 1.05 | 1.05 |
| Average River Basin Altitude [m] | Hsr | 917.81 | 917.81 | 917.81 | 917.81 | 917.81 | 917.81 |
| Average Elevation Difference of the Basin [m] | D | 382.81 | 382.81 | 382.81 | 382.81 | 382.81 | 382.81 |
| Average River Basin Decline [%] | Isr | 31.76 | 31.76 | 31.76 | 31.76 | 31.76 | 31.76 |
| The Height of the Local Erosion Base of Basin [m] | Hleb | 1018 | 1018 | 1018 | 1018 | 1018 | 1018 |
| Coefficient of Erosion Energy of Basin’s Relief [-] | Er | 128.01 | 128.01 | 128.01 | 128.01 | 128.01 | 128.01 |
| Coefficient of the Region’s Permeability [-] | S1 | 0.91 | 0.91 | 0.91 | 0.91 | 0.91 | 0.91 |
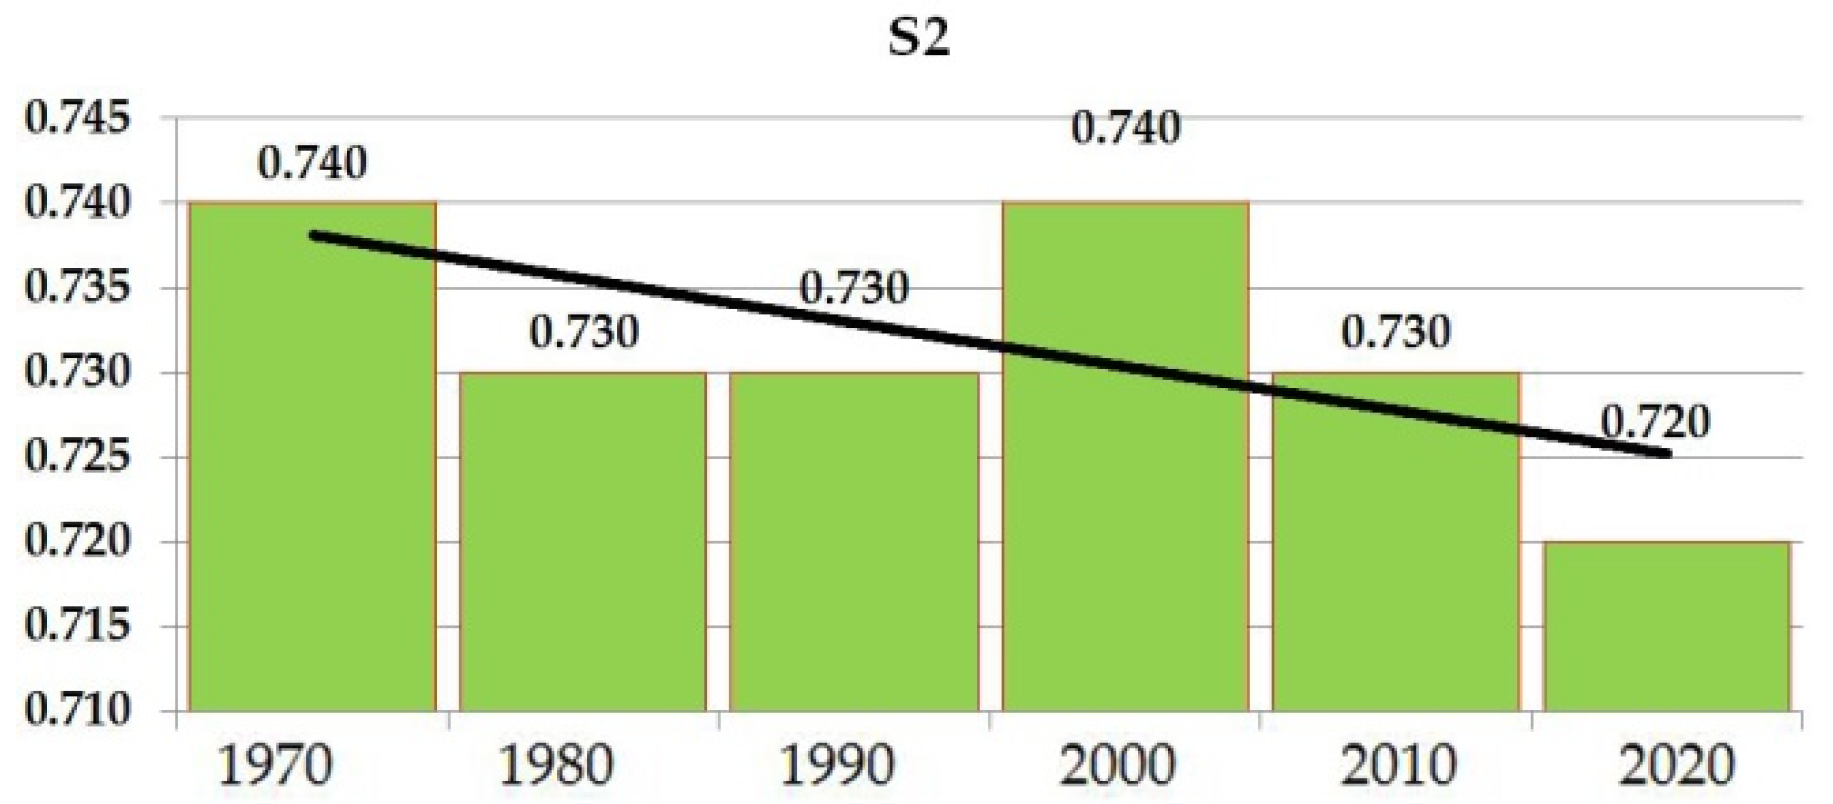
| Coefficient of the Vegetation Cover [-] | S2 | 0.74 | 0.73 | 0.73 | 0.74 | 0.73 | 0.72 |
| The Water Retention in Inflow [m] | W | 1.0488 | 1.0488 | 1.0488 | 1.0488 | 1.0488 | 1.0488 |
| Energetic Potential of Flow on Torrent Rains [m km s] | 2 × gDF^½ | 555.32 | 555.32 | 555.32 | 555.32 | 555.32 | 555.32 |
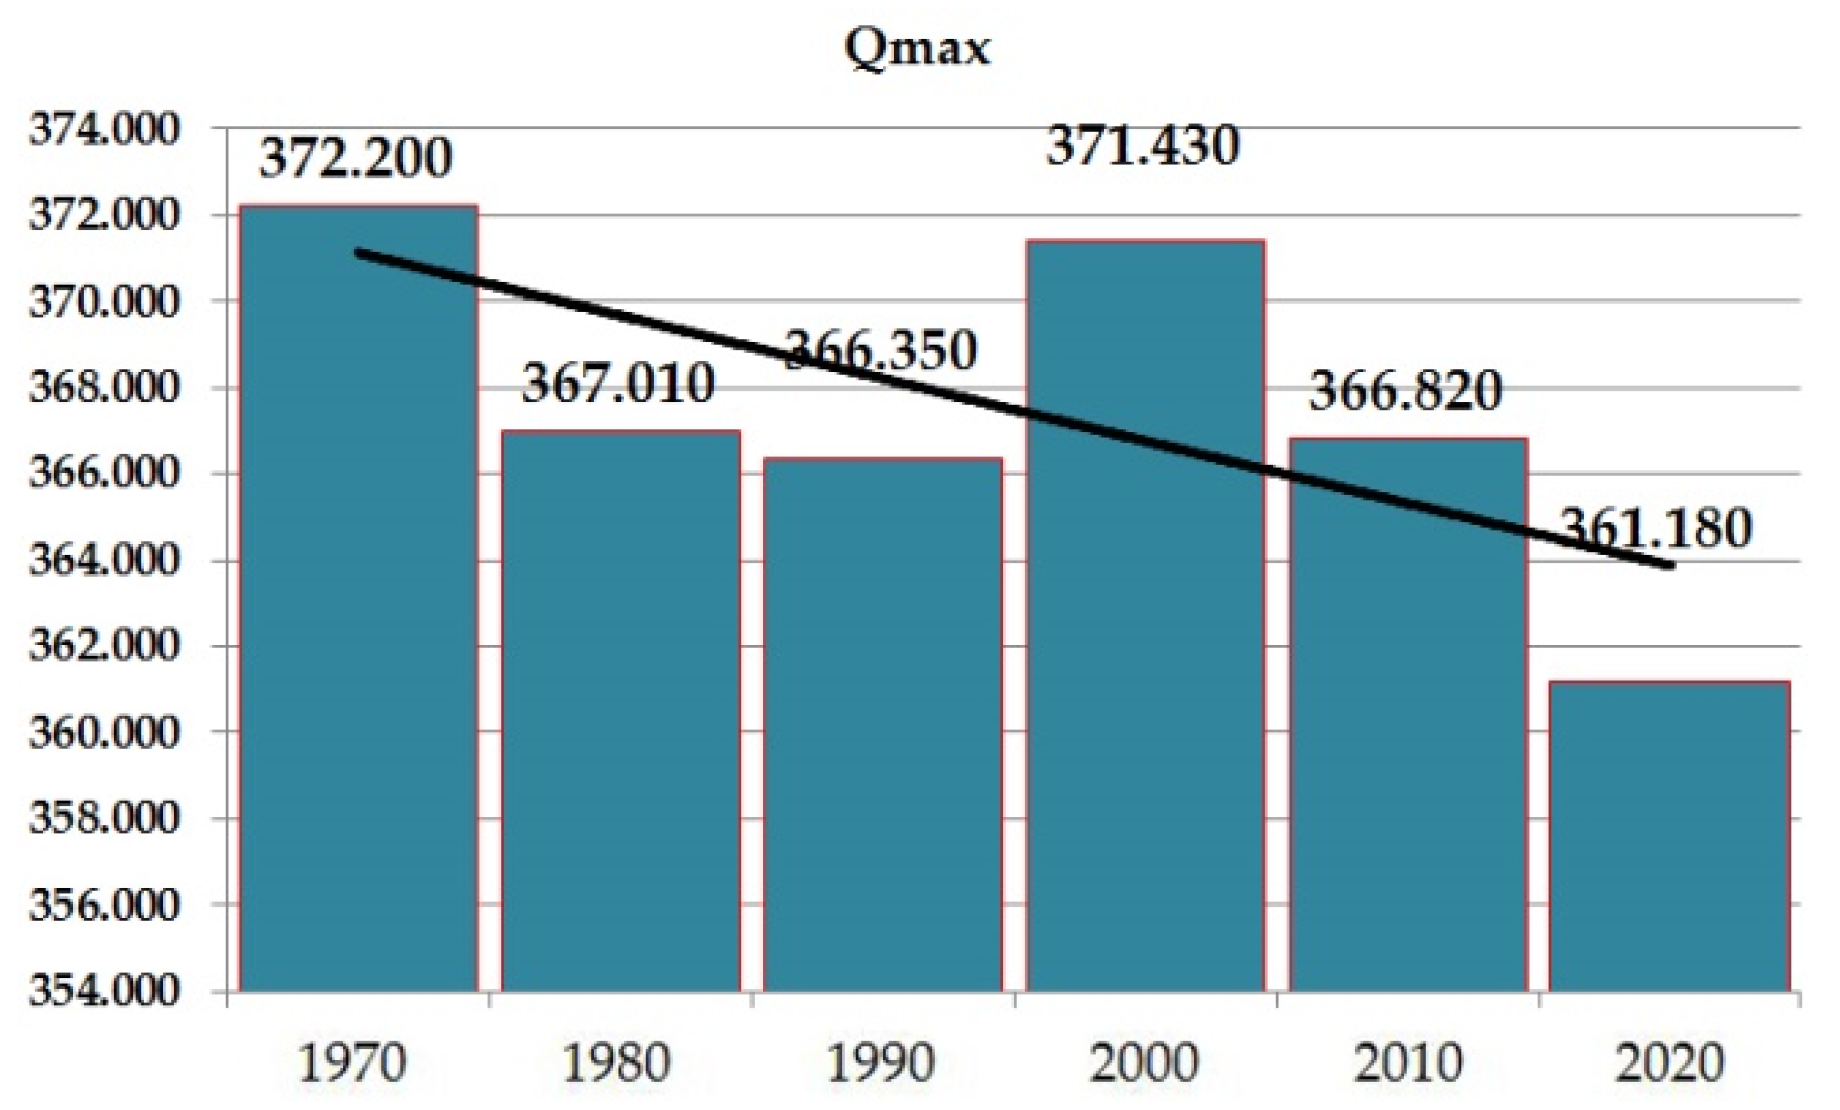
| Maximal Outflow From the River Basin [m3 s−1] | Qmax | 372.2 | 367.01 | 366.35 | 371.43 | 366.82 | 361.18 |
| Coefficient of the River Basin Erosion [-] | Z | 0.483 | 0.485 | 0.49 | 0.491 | 0.463 | 0.439 |
| Production of Erosion Material in Basin [m3 yr−1] | W yr | 37606 | 37890 | 38492 | 38563 | 35365 | 32574 |
| Coefficient of the Deposit Retention [-] | Ru | 0.42 | 0.42 | 0.42 | 0.42 | 0.42 | 0.42 |
| Real Soil Losses [m3 yr−1] | G yr | 15793 | 15912 | 16165 | 16195 | 14852 | 13680 |
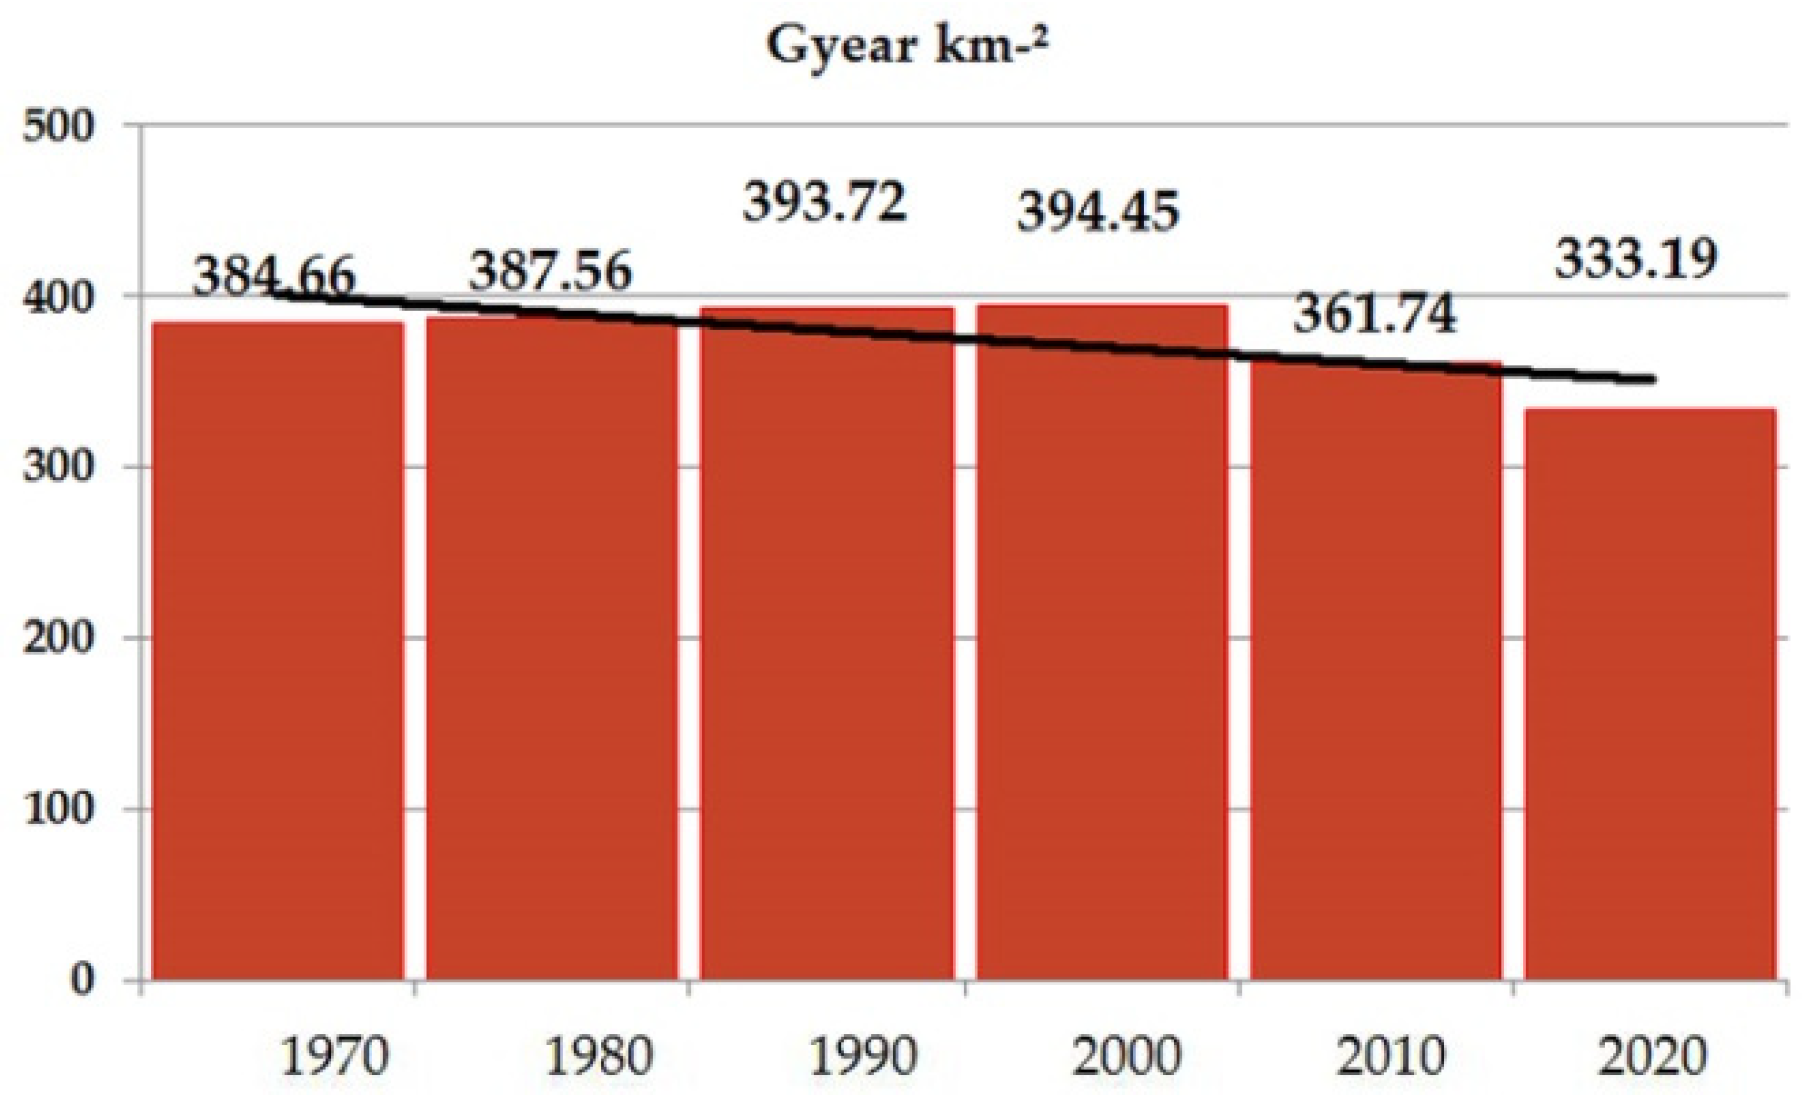
| Real Soil Losses Per [m3/km2 yr] | G yr km−2 | 384.66 | 387.56 | 393.72 | 394.45 | 361.34 | 333.19 |
| (1) | 645.40 | (12) | 278.33 | (23) | 324.45 | (34) | 325.19 | (45) | 212.39 | (56) | 269.25 |
| (2) | 521.84 | (13) | 427.63 | (24) | 212.67 | (35) | 195.47 | (46) | 254.63 | (57) | * 413.66 |
| (3) | 104.31 | (14) | 330.12 | (25) | 385.41 | (36) | 264.43 | (47) | 200.43 | Average 331.78 m3 km−2 year−1 | |
| (4) | 288.97 | (15) | 429.10 | (26) | 492.68 | (37) | 286.07 | (48) | 514.60 | ||
| (5) | 562.60 | (16) | 403.46 | (27) | 232.47 | (38) | 327.04 | (49) | 200.56 | ||
| (6) | 399.52 | (17) | 370.61 | (28) | 305.76 | (39) | 452.92 | (50) | 247.93 | ||
| (7) | 328.96 | (18) | 244.32 | (29) | 268.09 | (40) | 210.32 | (51) | 140.64 | ||
| (8) | 180.22 | (19) | 219.39 | (30) | 266.21 | (41) | 131.23 | (52) | 315.28 | ||
| (9) | 327.69 | (20) | 286.90 | (31) | 197.99 | (42) | 122.48 | (53) | 216.30 | ||
| (10) | 298.19 | (21) | 88.66 | (32) | 296.45 | (43) | 194.76 | (54) | 250.39 | ||
| (11) | 417.68 | (22) | 470.42 | (33) | 255.60 | (44) | 198.08 | (55) | 256.39 | ||
| Observation Period | Total Years | Total Accumulation 106 m3 | Total Sediments 106 m3 | Percentage Backfilling % | Annual Backfilling 106 m3 | Annual Backfilling % |
|---|---|---|---|---|---|---|
| 1967–1976 | 9 | 42.94 | 8.00 | 18.63 | 0.89 | 2.07 |
| 1967–1981 | 14 | 42.94 | 11.00 | 25.62 | 0.79 | 1.83 |
| 1967–1986 | 19 | 42.94 | 12.20 | 28.41 | 0.64 | 1.50 |
| 1967–1991 | 24 | 42.94 | 11.65 | 27.13 | 0.49 | 1.13 |
| 1967–1999 | 32 | 42.94 | 14.48 | 33.72 | 0.45 | 1.05 |
| 1967–2006 | 39 | 42.94 | 15.38 | 35.82 | 0.39 | 0.92 |
| 1967–2012 | 45 | 42.94 | 16.37 | 38.12 | 0.36 | 0.85 |
| 2012–2017 | 50 | 42.94 | 16.80 | 39.13 | 0.34 | 0.78 |
Publisher’s Note: MDPI stays neutral with regard to jurisdictional claims in published maps and institutional affiliations. |
© 2020 by the authors. Licensee MDPI, Basel, Switzerland. This article is an open access article distributed under the terms and conditions of the Creative Commons Attribution (CC BY) license (http://creativecommons.org/licenses/by/4.0/).
Share and Cite
Spalevic, V.; Barovic, G.; Vujacic, D.; Curovic, M.; Behzadfar, M.; Djurovic, N.; Dudic, B.; Billi, P. The Impact of Land Use Changes on Soil Erosion in the River Basin of Miocki Potok, Montenegro. Water 2020, 12, 2973. https://doi.org/10.3390/w12112973
Spalevic V, Barovic G, Vujacic D, Curovic M, Behzadfar M, Djurovic N, Dudic B, Billi P. The Impact of Land Use Changes on Soil Erosion in the River Basin of Miocki Potok, Montenegro. Water. 2020; 12(11):2973. https://doi.org/10.3390/w12112973
Chicago/Turabian StyleSpalevic, Velibor, Goran Barovic, Dusko Vujacic, Milic Curovic, Morteza Behzadfar, Nevenka Djurovic, Branislav Dudic, and Paolo Billi. 2020. "The Impact of Land Use Changes on Soil Erosion in the River Basin of Miocki Potok, Montenegro" Water 12, no. 11: 2973. https://doi.org/10.3390/w12112973