
Pattern of Radiotherapy Treatment in Low-Risk, Intermediate-Risk, and High-Risk Prostate Cancer Patients: Analysis of National Cancer Database

 and
and
Abstract
:Simple Summary
Abstract
1. Introduction
2. Materials and Methods
2.1. Data Source
2.2. Subject Selection
2.3. Definition of Variables
2.4. Statistical Analysis
2.5. Disclaimer
3. Results
3.1. Gross Breakdown
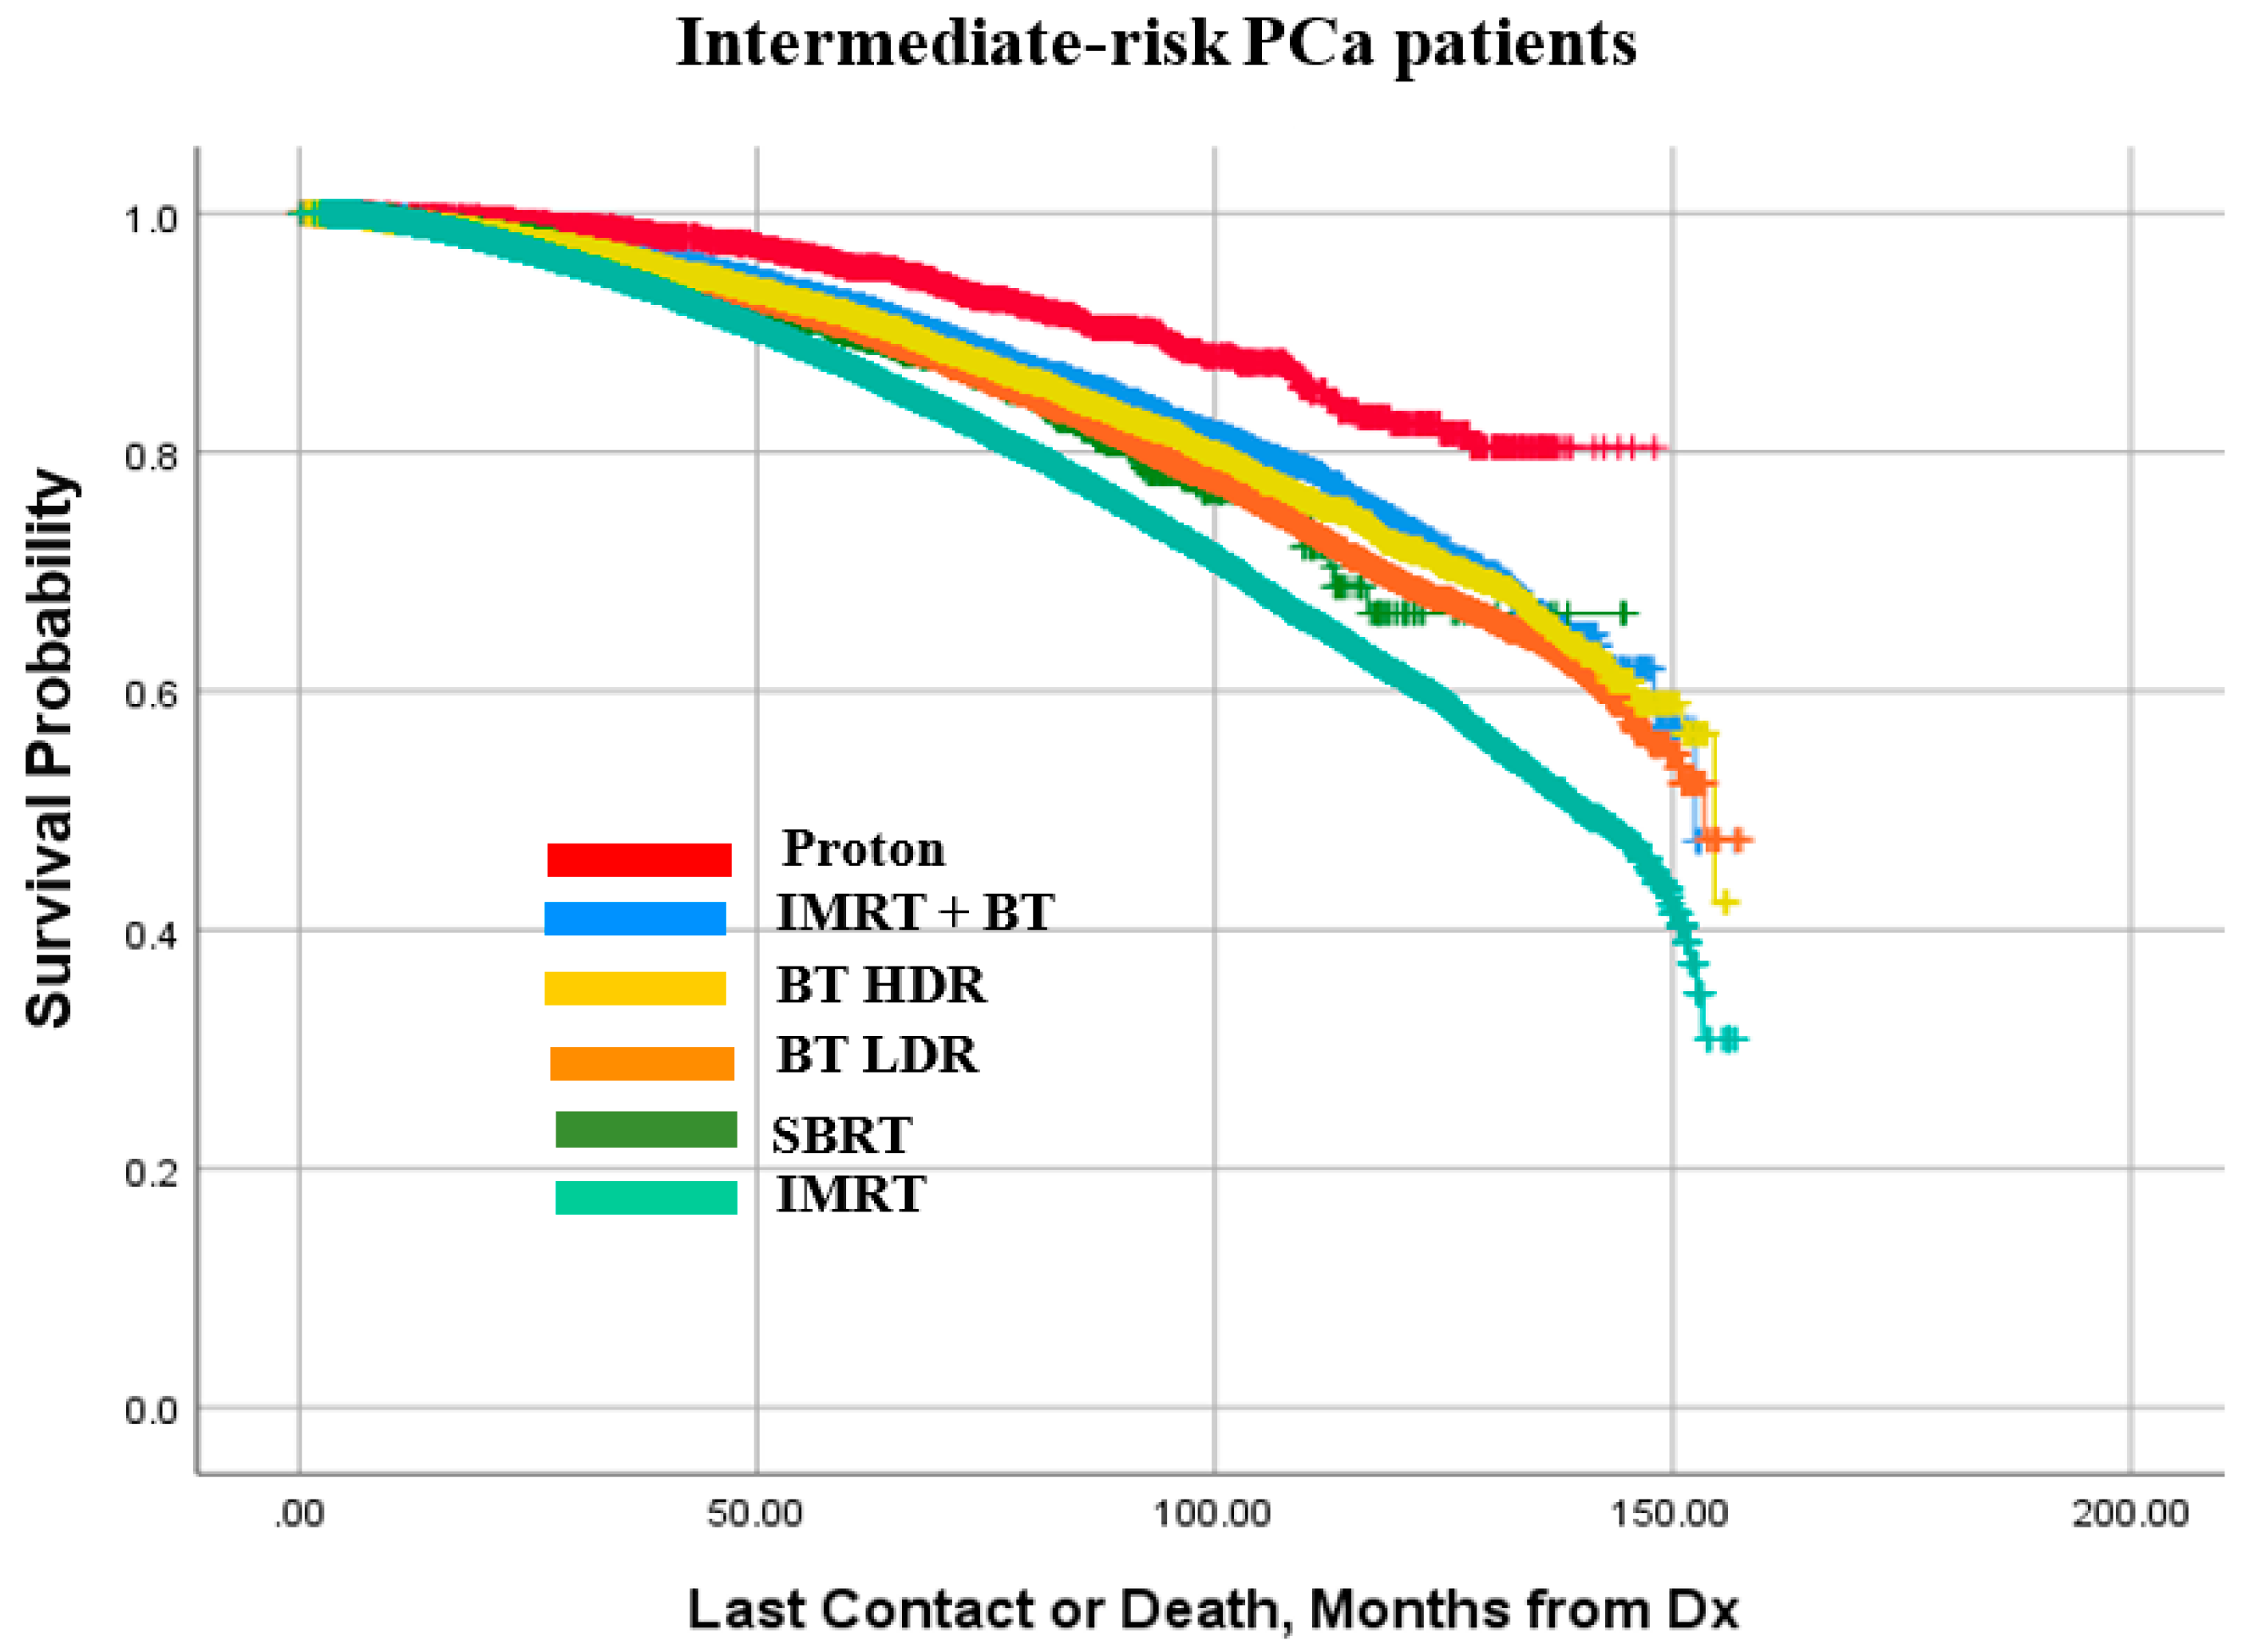
3.2. Survival Outcomes
3.3. Univariable Analyses of Patient Population
3.4. Multivariable Analyses of Patient Populations
4. Discussion
5. Conclusions
Author Contributions
Funding
Institutional Review Board Statement
Informed Consent Statement
Data Availability Statement
Conflicts of Interest
References
- Society, A.C. Cancer Statistics Center. 2021. Available online: https://cancerstatisticscenter.cancer.org/ (accessed on 1 February 2022).
- Siegel, R.L.; Miller, K.D.; Jemal, A. Cancer statistics, 2019. CA Cancer J. Clin. 2019, 69, 7–34. [Google Scholar] [CrossRef] [PubMed] [Green Version]
- Riihimäki, M.; Thomsen, H.; Brandt, A.; Sundquist, J.; Hemminki, K. What do prostate cancer patients die of? Oncologist 2011, 16, 175–181. [Google Scholar] [CrossRef] [PubMed] [Green Version]
- Network NCC. NCCN Guidelines Version 2.2021 Prostate Cancer. 2021. Available online: https://www.nccn.org/professionals/physician_gls/pdf/prostate.pdf (accessed on 1 February 2022).
- Tsubokura, T.; Yamazaki, H.; Masui, K.; Sasaki, N.; Shimizu, D.; Suzuki, G.; Nakamura, S.; Yamada, K.; Okihara, K.; Shiraishi, T.; et al. Comparison of Image-Guided Intensity-Modulated Radiotherapy and Low-dose Rate Brachytherapy with or without External Beam Radiotherapy in Patients with Localized Prostate Cancer. Sci. Rep. 2018, 8, 10538. [Google Scholar] [CrossRef] [PubMed] [Green Version]
- Wallis, C.J.D.; Saskin, R.; Choo, R.; Herschorn, S.; Kodama, R.T.; Satkunasivam, R.; Shah, P.S.; Danjoux, C.; Nam, R.K. Surgery Versus Radiotherapy for Clinically-localized Prostate Cancer: A Systematic Review and Meta-analysis. Eur. Urol. 2016, 70, 21–30. [Google Scholar] [CrossRef] [PubMed] [Green Version]
- Kamran, S.C.; Light, J.O.; Efstathiou, J.A. Proton versus photon-based radiation therapy for prostate cancer: Emerging evidence and considerations in the era of value-based cancer care. Prostate Cancer Prostatic Dis. 2019, 22, 509–521. [Google Scholar] [CrossRef] [PubMed]
- Zelefsky, M.J.; Poon, B.Y.; Eastham, J.; Vickers, A.; Pei, X.; Scardino, P.T. Longitudinal assessment of quality of life after surgery, conformal brachytherapy, and intensity-modulated radiation therapy for prostate cancer. Radiother. Oncol. 2016, 118, 85–91. [Google Scholar] [CrossRef] [PubMed] [Green Version]
- Haque, W.; Butler, E.B.; Teh, B.S. Stereotactic body radiation therapy for prostate cancer-a review. Chin. Clin. Oncol. 2017, 6 (Suppl. S2), S10. [Google Scholar] [CrossRef]
- Hayashi, N.; Osaka, K.; Muraoka, K.; Hasumi, H.; Makiyama, K.; Kondo, K.; Nakaigawa, N.; Yao, M.; Mukai, Y.; Sugiura, M.; et al. Outcomes of treatment for localized prostate cancer in a single institution: Comparison of radical prostatectomy and radiation therapy by propensity score matching analysis. World J. Urol. 2020, 38, 2477–2484. [Google Scholar] [CrossRef]
- Pollack, A.; Zagars, G.K.; Starkschall, G.; Antolak, J.A.; Lee, J.J.; Huang, E.; von Eschenbach, A.C.; Kuban, D.A.; Rosen, I. Prostate cancer radiation dose response: Results of the M. D. Anderson phase III randomized trial. Int. J. Radiat. Oncol. Biol. Phys. 2002, 53, 1097–1105. [Google Scholar] [CrossRef]
- Zietman, A.L.; Bae, K.; Slater, J.D.; Shipley, W.U.; Efsathiou, J.A.; Coen, J.J.; Bush, D.A.; Lunt, M.; Spiegel, D.Y.; Skowronski, R.; et al. Randomized trial comparing conventional-dose with high-dose conformal radiation therapy in early-stage adenocarcinoma of the prostate: Long-term results from proton radiation oncology group/american college of radiology 95–09. J. Clin. Oncol. 2010, 28, 1106–1111. [Google Scholar] [CrossRef]
- Zietman, A.L.; DeSilvio, M.L.; Slater, J.D.; Rossi, C.J., Jr.; Miller, D.W.; Adams, J.A.; Shipley, W.U. Comparison of conventional-dose vs. high-dose conformal radiation therapy in clinically localized adenocarcinoma of the prostate: A randomized controlled trial. JAMA 2005, 294, 1233–1239. [Google Scholar] [CrossRef] [PubMed] [Green Version]
- Alicikus, Z.A.; Yamada, Y.; Zhang, Z.; Pei, X.; Hunt, M.; Kollmeier, M.; Cox, B.; Zelefsky, M.J. Ten-year outcomes of high-dose, intensity-modulated radiotherapy for localized prostate cancer. Cancer 2011, 117, 1429–1437. [Google Scholar] [CrossRef] [PubMed]
- Fischer-Valuck, B.W.; Rao, Y.J.; Michalski, J.M. Intensity-modulated radiotherapy for prostate cancer. Transl. Androl. Urol. 2018, 7, 297–307. [Google Scholar] [CrossRef] [PubMed] [Green Version]
- Alitto, A.R.; Tagliaferri, L.; Lancellotta, V.; D’aviero, A.; Piras, A.; Frascino, V.; Catucci, F.; Fionda, B.; Staackmann, C.; Saldi, S.; et al. BIT-ART: Multicentric Comparison of HDR-brachytherapy, Intensity-modulated Radiotherapy and Tomotherapy for Advanced Radiotherapy in Prostate Cancer. In Vivo 2020, 34, 1297–1305. [Google Scholar] [CrossRef]
- Demanes, D.J.; Ghilezan, M.I. High-dose-rate brachytherapy as monotherapy for prostate cancer. Brachytherapy 2014, 13, 529–541. [Google Scholar] [CrossRef] [Green Version]
- Martinez, A.A.; Pataki, I.; Edmundson, G.; Sebastian, E.; Brabbins, D.; Gustafson, G. Phase II prospective study of the use of conformal high-dose-rate brachytherapy as monotherapy for the treatment of favorable stage prostate cancer: A feasibility report. Int. J. Radiat. Oncol. Biol. Phys. 2001, 49, 61–69. [Google Scholar] [CrossRef]
- Autorino, R.; Vicenzi, L.; Tagliaferri, L.; Soatti, C.; Kovacs, P.G.; Aristei, C. A national survey of AIRO (Italian Association of Radiation Oncology) brachytherapy (Interventional Radiotherapy) study group. J. Contemp. Brachyther. 2018, 10, 254–259. [Google Scholar] [CrossRef]
- Mohler, J.L.; Antonarakis, E.S.; Armstrong, A.J.; D’Amico, A.V.; Davis, B.J.; Dorff, T.; Eastham, J.A.; Enke, C.A.; Farrington, T.A.; Higano, C.S.; et al. Prostate Cancer, Version 2.2019, NCCN Clinical Practice Guidelines in Oncology. J. Natl. Compr. Cancer Netw. 2019, 17, 479–505. [Google Scholar] [CrossRef] [Green Version]
- Spratt, D.E.; Scala, L.M.; Folkert, M.; Voros, L.; Cohen, G.N.; Happersett, L.; Katsoulakis, E.; Zelefsky, M.J.; Kollmeier, M.A.; Yamada, Y. A comparative dosimetric analysis of virtual stereotactic body radiotherapy to high-dose-rate monotherapy for intermediate-risk prostate cancer. Brachytherapy 2013, 12, 428–433. [Google Scholar] [CrossRef]
- Yu, J.B.; Cramer, L.D.; Herrin, J.; Soulos, P.R.; Potosky, A.L.; Gross, C.P. Stereotactic body radiation therapy versus intensity-modulated radiation therapy for prostate cancer: Comparison of toxicity. J. Clin. Oncol. 2014, 32, 1195–1201. [Google Scholar] [CrossRef]
- Chen, L.N.; Suy, S.; Uhm, S.; Oermann, E.K.; Ju, A.W.; Chen, V.; Hanscom, H.N.; Laing, S.; Kim, J.S.; Lei, S.; et al. Stereotactic body radiation therapy (SBRT) for clinically localized prostate cancer: The Georgetown University experience. Radiat. Oncol. 2013, 8, 58. [Google Scholar] [CrossRef] [PubMed] [Green Version]
- King, C.R.; Brooks, J.D.; Gill, H.; Presti, J.C., Jr. Long-term outcomes from a prospective trial of stereotactic body radiotherapy for low-risk prostate cancer. Int. J. Radiat. Oncol. Biol. Phys. 2012, 82, 877–882. [Google Scholar] [CrossRef] [PubMed]
- Podder, T.K.; Fredman, E.T.; Ellis, R.J. Advances in Radiotherapy for Prostate Cancer Treatment. Adv. Exp. Med. Biol. 2018, 1096, 31–47. [Google Scholar] [CrossRef] [PubMed] [Green Version]
- Parthan, A.; Pruttivarasin, N.; Davies, D.; Taylor, D.C.A.; Pawar, V.; Bijlani, A.; Lich, K.H.; Chen, R. Comparative cost-effectiveness of stereotactic body radiation therapy versus intensity-modulated and proton radiation therapy for localized prostate cancer. Front. Oncol. 2012, 2, 81. [Google Scholar] [CrossRef] [Green Version]
- Liu, Y.; Patel, S.A.; Jani, A.B.; Gillespie, T.W.; Patel, P.R.; Godette, K.D.; Hershatter, B.W.; Shelton, J.W.; McDonald, M.W. Overall Survival After Treatment of Localized Prostate Cancer with Proton Beam Therapy, External-Beam Photon Therapy, or Brachytherapy. Clin. Genitourin. Cancer 2021, 19, 255–266.e7. [Google Scholar] [CrossRef]
- Bryant, C.M.; Henderson, R.H.; Nichols, R.C.; Mendenhall, W.M.; Hoppe, B.S.; Vargas, C.E.; Daniels, T.B.; Choo, C.R.; Parikh, R.R.; Giap, H.; et al. Consensus Statement on Proton Therapy for Prostate Cancer. Int. J. Part. Ther. 2021, 8, 1–16. [Google Scholar] [CrossRef]
- King, C.R.; Freeman, D.; Kaplan, I.; Fuller, D.; Bolzicco, G.; Collins, S.; Meier, R.; Wang, J.; Kupelian, P. Steinberg, M.; et al. Stereotactic body radiotherapy for localized prostate cancer: Pooled analysis from a multi-institutional consortium of prospective phase II trials. Radiother. Oncol. 2013, 109, 217–221. [Google Scholar] [CrossRef] [Green Version]
- Group, R.T.O. Radiation Therapy in Treating Patients with Prostate Cancer. ClinicalTrials.gov. 2011. Available online: https://clinicaltrials.gov/ct2/show/NCT01434290 (accessed on 1 February 2022).
- Wiegel, T.; Albers, P.; Bartkowiak, D.; Bussar-Maatz, R.; Harter, M.; Kristiansen, G.; Martus, P.; Wellek, S.; Schmidberger, H.; Grozinger, K.; et al. Results of a randomized trial of treatment modalities in patients with low or early-intermediate risk prostate cancer (PREFERE trial). J. Cancer Res. Clin. Oncol. 2021, 147, 235–242. [Google Scholar] [CrossRef]
- Deyo, R.A.; Cherkin, D.C.; Ciol, M.A. Adapting a clinical comorbidity index for use with ICD-9-CM administrative databases. J. Clin. Epidemiol. 1992, 45, 613–619. [Google Scholar] [CrossRef]
- Alongi, F.; Fiorino, C.; Cozzarini, C.; Broggi, S.; Perna, L.; Cattaneo, G.M.; Calandrino, R.; Muzio, N.D. IMRT significantly reduces acute toxicity of whole-pelvis irradiation in patients treated with post-operative adjuvant or salvage radiotherapy after radical prostatectomy. Radiother. Oncol. 2009, 93, 207–212. [Google Scholar] [CrossRef]
- Nattinger, A.B.; Kneusel, R.T.; Hoffmann, R.G.; Gilligan, M.A. Relationship of Distance From a Radiotherapy Facility and Initial Breast Cancer Treatment. JNCI J. Natl. Cancer Inst. 2001, 93, 1344–1346. [Google Scholar] [CrossRef] [Green Version]
- Mukherjee, K.; Small, W., Jr.; Duszak, R., Jr. Trends and variations in utilization and costs of radiotherapy for prostate cancer: A SEER medicare analysis from 2007 through 2016. Brachytherapy 2021, 21, 12–21. [Google Scholar] [CrossRef] [PubMed]
- Guadagnolo, B.A.; Huo, J.; Liao, K.P.; Buchholz, T.A.; Das, P. Changing trends in radiation therapy technologies in the last year of life for patients diagnosed with metastatic cancer in the United States. Cancer 2013, 119, 1089–1097. [Google Scholar] [CrossRef] [PubMed] [Green Version]
- Tuttle, T.M.; Jarosek, S.; Habermann, E.B.; Yee, D.; Yuan, J.; Virnig, B.A. Omission of radiation therapy after breast-conserving surgery in the United States: A population-based analysis of clinicopathologic factors. Cancer 2012, 118, 2004–2013. [Google Scholar] [CrossRef] [PubMed]
- Delgadillo, R.; Ford, J.C.; Abramowitz, M.C.; Pra, A.D.; Pollack, A.; Stoyanova, R. The role of radiomics in prostate cancer radiotherapy. Strahlenther. Onkol. 2020, 196, 900–912. [Google Scholar] [CrossRef]
- Ferro, M.; de Cobelli, O.; Musi, G.; del Giudice, F.; Carrieri, G.; Busetto, G.M.; Falagario, U.G.; Sciarra, A.; Maggi, M.; Crocetto, F.; et al. Radiomics in prostate cancer: An up-to-date review. Ther. Adv. Urol. 2022, 14, 17562872221109020. [Google Scholar] [CrossRef]
- Ferraro, S.; Bussetti, M.; Panteghini, M. Serum Prostate-Specific Antigen Testing for Early Detection of Prostate Cancer: Managing the Gap between Clinical and Laboratory Practice. Clin. Chem. 2021, 67, 602–609. [Google Scholar] [CrossRef]
- Fickweiler, F.; Fickweiler, W.; Urbach, E. Interactions between physicians and the pharmaceutical industry generally and sales representatives specifically and their association with physicians’ attitudes and prescribing habits: A systematic review. BMJ Open 2017, 7, e016408. [Google Scholar] [CrossRef] [Green Version]
- Ricco, A.; Hanlon, A.; Lanciano, R. Propensity Score Matched Comparison of Intensity Modulated Radiation Therapy vs. Stereotactic Body Radiation Therapy for Localized Prostate Cancer: A Survival Analysis from the National Cancer Database. Front. Oncol. 2017, 7, 185. [Google Scholar] [CrossRef]


| Modality | Research Risk Groups | Total | ||
| Patient Selection | Low Risk | Intermediate Risk | High Risk | |
| IMRT + BT Boost | 1604 | 7092 | 4038 | 12,734 |
| IMRT only | 25,235 | 48,160 | 32,851 | 106,246 |
| Proton | 1777 | 2296 | 488 | 4561 |
| SBRT | 2918 | 3795 | 820 | 7533 |
| BT LDR | 26,311 | 15,534 | 3607 | 45,452 |
| BT HDR | 13,301 | 7864 | 2235 | 23,400 |
| Total | 71,146 | 84,741 | 44,039 | 199,926 |
| Baseline Characteristics | Low-Risk Patients (%) | Intermediate-Risk Patients (%) | High-Risk Patients (%) |
| Overall | 71,146 | 84,741 | 44,039 |
| Year of Diagnosis | |||
| 2004–2007 | 30,987 (43.6) | 24,365 (28.8) | 10,821 (24.6) |
| 2008–2011 | 26,427 (37.1) | 31,019 (36.6) | 16,325 (37.1) |
| 2012–2015 | 13,732 (19.3) | 29,357 (34.6) | 16,893 (32.6) |
| Age (years) | |||
| <65 | 29,801 (41.9) | 24,696 (29.1) | 10,603 (24.1) |
| 65–69 | 17,959 (25.2) | 20,160 (23.8) | 9216 (20.9) |
| 70–74 | 14,760 (20.7) | 20,776 (24.5) | 10,606 (24.1) |
| >74 | 8626 (12.1) | 19,109 (22.5) | 13,614 (30.9) |
| Race | |||
| White | 59,154 (83.1) | 68,724 (81.1) | 35,131 (79.8) |
| Black | 9665 (13.6) | 12,920 (15.2) | 7201 (16.4) |
| Other | 1533 (2.2) | 2217 (2.6) | 1292 (2.9) |
| Unknown | 794 (1.1) | 880 (1.0) | 415 (0.9) |
| Insurance Status | |||
| None | 30,614 (43.0) | 27,140 (32.0) | 11,823 (26.8) |
| Government | 38,886 (54.7) | 55,566 (65.6) | 31,059 (70.5) |
| Private | 700 (1.0) | 953 (1.1) | 617 (1.4) |
| Unknown | 946 (1.3) | 1082 (1.3) | 540 (1.2) |
|
Charlson-Deyo Comorbidity index | |||
| 0 | 62,365 (87.7) | 72,396 (85.4) | 37,346 (84.8) |
| 1 | 7625 (10.7) | 10,157 (12.0) | 5413 (12.2) |
| 2+ | 1156 (1.6) | 2188 (2.6) | 1280 (2.9) |
| Residential Setting | |||
| Metro | 57,607 (81.0) | 68,094 (80.4) | 35,051 (79.6) |
| Urban | 10,393 (14.6) | 12,617 (14.9) | 6833 (15.5) |
| Rural | 1350 (1.9) | 1851 (2.2) | 982 (2.2) |
| Unknown | 1796 (2.5) | 2179 (2.6) | 1173 (2.7) |
|
Median Income (Residential area), $ | |||
| <38,000 | 11,070 (15.6) | 13,997 (16.5) | 7735 (17.6) |
| 38,000–47,999 | 15,981 (22.5) | 19,050 (22.5) | 10,314 (23.4) |
| 48,000–62,999 | 18,484 (26.0) | 22,577 (26.6) | 11,621 (26.4) |
| 63,000+ | 25,008 (35.2) | 28,566 (33.7) | 14,044 (31.9) |
| Unknown | 603 (0.8) | 601 (0.7) | 325 (0.7) |
|
Without high school degree (Residential area), % | |||
| <7 | 19,002 (26.7) | 22,131 (26.1) | 10,786 (24.5) |
| 7–12.9 | 24,163 (34.0) | 28,382 (33.5) | 14,705 (33.4) |
| 13–20.9 | 17,266 (24.3) | 21,002 (24.8) | 11,317 (25.7) |
| 21+ | 10,155 (14.3) | 12,677 (15.0) | 6947 (15.8) |
| Unknown | 560 (0.8) | 549 (0.6) | 284 (0.6) |
| Distance from facility to residence, miles | |||
| <5 | 19,491 (27.4) | 24,129 (28.5) | 13,336 (30.3) |
| 5–9.9 | 16,057 (22.6) | 19,204 (22.7) | 10,066 (22.9) |
| 10–24.9 | 19,209 (27.0) | 23,016 (27.2) | 11,998 (27.2) |
| 25+ | 15,849 (22.3) | 17,877 (21.1) | 8369 (19.0) |
| Unknown | 540 (0.8) | 515 (0.6) | 270 (0.6) |
| Facility Type | |||
| Non-academic | 50,581 (71.1) | 59,266 (69.9) | 31,141 (70.7) |
| Academic/research | 20,552 (28.9) | 25,472 (30.1) | 12,895 (29.3) |
| Unknown | 13 (0.0) | 3 (0.0) | 3 (0.0) |
| Facility Location | |||
| Northeast | 17,655 (24.8) | 20,439 (24.1) | 10,348 (23.5) |
| South | 24,678 (34.7) | 27,877 (32.9) | 15,175 (34.5) |
| Midwest | 18,267 (25.7) | 22,876 (27.0) | 12,336 (28.0) |
| West | 10,533 (14.8) | 13,546 (16.0) | 6177 (14.0) |
| Unknown | 13 (0.0) | 3 (0.0) | 3 (0.0) |
| T-Stage | |||
| 1 | 22,681 (31.9) | 3547 (4.2) | 1420 (3.2) |
| 2 | 45,633 (64.1) | 40,791 (48.1) | 16,698 (37.9) |
| 2A | 1886 (2.7) | 36,115 (42.6) | 2228 (5.1) |
| 2B | 943 (1.3) | 4278 (5.0) | 18,042 (41.0) |
| 3 | 2 (0.0) | 10 (0.0) | 5385 (12.2) |
| 4 | 1 (0.0) | - | 266 (0.6) |
|
PSA (Prostate-specific antigen), ng/mL | |||
| 0.2–2.9 | 7101 (10.0) | 5063 (6.0) | 1797 (4.1) |
| 3.0–6.9 | 48,464 (68.1) | 39,696 (46.8) | 10,271 (23.3) |
| 7.0–10.0 | 15,581 (21.9) | 17,498 (20.6) | 6488 (14.7) |
| 10.1–12.9 | - | 12,501 (14.8) | 3871 (8.8) |
| 13.0–16.9 | - | 7131 (8.4) | 2963 (6.7) |
| 17.0–20.0 | - | 2852 (3.4) | 1484 (3.4) |
| 20.1–49.9 | - | - | 11,625 (26.4) |
| 50.0–74.9 | - | - | 3850 (8.7) |
| >74.9 | - | - | 1690 (3.8) |
| Total Gleason Score | |||
| <6 | 1732 (2.4) | 8 (0.20) | 1 (0.20) |
| 6 | 69,414 (97.6) | 401 (0.5) | 145 (0.3) |
| 7 | - | 13,523 (16.0) | 4519 (10.3) |
| 8 | - | 70,817 (83.6) | 8325 (18.9) |
| 9 | - | - | 18,490 (42.0) |
| 10 | - | - | 11,450 (26.0) |
| Radiotherapy | |||
| IMRT and No RT and IMRT Boost | 25,235 (35.5) | 48,160 (56.8) | 32,851 (74.6) |
| IMRT and BT Boost | 1604 (2.3) | 7092 (8.4) | 4038 (9.2) |
| Proton | 1777 (2.5) | 2296 (2.7) | 488 (1.1) |
| SBRT | 2918 (4.1) | 3795 (4.5) | 820 (1.9) |
| BT LDR | 26,311 (37.0) | 15,534 (18.3) | 3607 (8.2) |
| BT HDR | 13,301 (18.7) | 7864 (9.3) | 2235 (5.1) |
| Hormonal Therapy | |||
| No | 58,333 (82.8) | 52,875 (62.4) | 10,457 (23.7) |
| Yes | 10,983 (15.4) | 30,160 (35.6) | 33,031 (75.0) |
| Unknown | 1830 (2.6) | 1706 (2.0) | 1509 (2.4) |
| Low Risk | IMRT Only (n = 25,235) | IMRT + BT Boost (n = 1604) | Proton (n = 1777) | SBRT (n = 2918) | BT LDR (n = 26,311) | BT HDR (n = 13,301) | p-Value |
| Year of Diagnosis | <0.0001 | ||||||
| 2004–2007 | 9510 (37.7) | 821 (51.2) | 732 (41.2) | 428 (14.7) | 12,561 (47.7) | 6935 (52.1) | |
| 2008–2011 | 10,277 (40.7) | 563 (35.1) | 712 (40.1) | 1148 (39.3) | 9147 (34.8) | 4580 (34.4) | |
| 2012–2015 | 5448 (21.6) | 220 (13.7) | 333 (18.7) | 1342 (46.0) | 4603 (17.5) | 1786 (13.4) | |
| Age (years) | <0.0001 | ||||||
| <65 | 8629 (34.2) | 794 (49.5) | 892 (50.2) | 1205 (41.3) | 11,976 (45.5) | 6305 (47.4) | |
| 65–69 | 6438 (25.5) | 391 (24.4) | 490 (27.6) | 789 (27.0) | 6663 (25.3) | 3188 (24.0) | |
| 70–74 | 6008 (23.8) | 278 (17.3) | 272 (15.3) | 596 (20.4) | 5080 (19.3) | 2526 (19.0) | |
| >74 | 4160 (16.5) | 141 (8.8) | 123 (6.9) | 328 (11.2) | 2592 (9.9) | 1282 (9.6) | |
| Race | <0.0001 | ||||||
| White | 20,448 (81.0) | 1211 (75.5) | 1644 (92.5) | 2460 (84.3) | 22,437 (85.3) | 10,954 (82.4) | |
| Black | 3919 (15.5) | 340 (21.2) | 79 (4.4) | 365 (12.5) | 3195 (12.1) | 1767 (13.3) | |
| Other | 592 (2.3) | 39 (2.4) | 49 (2.8) | 60 (2.1) | 416 (1.6) | 377 (2.8) | |
| Unknown (794) | 276 (1.1) | 14 (0.9) | 5 (0.3) | 33 (1.1) | 263 (1.0) | 203 (1.5) | |
| Insurance Status | <0.0001 | ||||||
| None | 317 (1.3) | 19 (1.20) | 44 (2.5) | 25 (0.9) | 189 (0.7) | 106 (0.8) | |
| Government | 15,594 (61.8) | 810 (50.5) | 804 (45.2) | 1626 (55.7) | 13,538 (51.5) | 6514 (49.0) | |
| Private | 8934 (35.4) | 757 (47.2) | 926 (52.1) | 1215 (41.6) | 12,262 (46.6) | 6520 (49.0) | |
| Unknown (946) | 390 (1.5) | 18 (1.1) | 3 (0.2) | 52 (1.8) | 322 (1.2) | 161 (1.2) | |
| Charlson–Deyo Comorbidity index | <0.0001 | ||||||
| 0 | 22,238 (88.1) | 1420 (88.5) | 1613 (90.8) | 2584 (88.6) | 22,780 (86.6) | 11,730 (88.2) | |
| 1 | 2518 (10.0) | 161 (10.0) | 147 (8.3) | 304 (10.4) | 3086 (11.7) | 1409 (10.6) | |
| 2+ | 479 (1.9) | 23 (1.4) | 17 (1.0) | 30 (1.0) | 445 (1.7) | 162 (1.2) | |
| Residential Setting | <0.0001 | ||||||
| Metro | 20,792 (84.3) | 1360 (87.0) | 1501 (87.9) | 2542 (89.8) | 20,267 (79.3) | 11,145 (85.5) | |
| Urban | 3460 (14.0) | 189 (12.1) | 190 (11.1) | 259 (9.1) | 4622 (18.1) | 1673 (12.8) | |
| Rural | 400 (1.6) | 15 (1.0) | 17 (1.0) | 30 (1.1) | 674 (2.6) | 214 (1.6) | |
| Missing (1796) | - | - | - | - | - | - | |
| Median Income (Residential area), $ | <0.0001 | ||||||
| <38,000 | 4326 (17.3) | 326 (20.6) | 121 (6.9) | 286 (9.9) | 4211 (16.2) | 1800 (13.6) | |
| 38,000–47,999 | 5780 (23.1) | 302 (19.1) | 303 (17.2) | 412 (14.2) | 6425 (24.7) | 2759 (20.9) | |
| 48,000–62,999 | 6828 (27.2) | 331 (21.0) | 481 (27.3) | 628 (21.7) | 6923 (26.6) | 3293 (24.9) | |
| 63,000+ | 8129 (32.4) | 620 (39.3) | 858 (48.7) | 1568 (54.2) | 6478 (32.6) | 5355 (40.5) | |
| Missing (603) | - | - | - | - | - | - | |
| Without high school degree (Residential area), % | <0.0001 | ||||||
| <7 | 6248 (24.9) | 386 (24.4) | 696 (39.5) | 1045 (36.1) | 6686 (25.7) | 3941 (29.8) | |
| 7–12.9 | 8642 (34.5) | 493 (31.2) | 550 (31.2) | 911 (31.5) | 9117 (35.0) | 4450 (33.7) | |
| 13–20.9 | 6293 (25.1) | 397 (25.1) | 299 (17.0) | 599 (20.7) | 6498 (24.9) | 3180 (24.1) | |
| 21+ | 3892 (15.5) | 303 (19.2) | 218 (12.4) | 341 (11.8) | 3757 (14.4) | 1644 (12.4) | |
| Missing (560) | - | - | - | - | - | - | |
| Distance from facility to residence, miles | <0.0001 | ||||||
| <5 | 8633 (34.4) | 561 (35.5) | 72 (4.1) | 573 (19.8) | 6366 (24.4) | 3286 (27.6) | |
| 5–9.9 | 6408 (25.5) | 401 (25.4) | 71 (4.0) | 656 (22.7) | 5451 (20.9) | 3070 (22.7) | |
| 10–24.9 | 6828 (27.2) | 408 (25.8) | 151 (8.6) | 852 (29.5) | 7331 (28.1) | 3639 (27.2) | |
| 25+ | 3212 (12.8) | 209 (13.2) | 1472 (83.4) | 812 (28.1) | 6918 (26.5) | 3226 (22.4) | |
| Missing (540) | - | - | - | - | - | - | |
| Facility Type | <0.0001 | ||||||
| Non-academic | 18,695 (74.1) | 1339 (83.5) | 48 (2.70) | 1448 (49.6) | 19,941 (75.8) | 9110 (68.5) | |
| Academic/research | 6538 (25.9) | 264 (16.5) | 1728 (97.3) | 1470 (50.4) | 6365 (24.2) | 4187 (31.5) | |
| Missing (13) | |||||||
| Facility Location | <0.0001 | ||||||
| Northeast | 7178 (28.4) | 567 (35.4) | 109 (6.1) | 1190 (40.8) | 5696 (21.7) | 2915 (21.9) | |
| South | 7954 (31.5) | 721 (45.0) | 36 (2.0) | 1042 (35.7) | 10,091 (38.4) | 4834 (36.4) | |
| Midwest | 7315 (29.0) | 221 (13.8) | 23 (1.3) | 506 (17.3) | 7022 (26.7) | 3180 (23.9) | |
| West | 2786 (11.0) | 94 (5.9) | 1608 (90.5) | 180 (6.2) | 3497 (13.3) | 2368 (17.8) | |
| Missing (13) | - | - | - | - | - | - | |
| T-Stage * | <0.0001 | ||||||
| 1 | 8797 (34.9) | 403 (25.1) | 633 (35.6) | 1775 (60.8) | 7923 (30.1) | 3150 (23.7) | |
| 2 | 15,243 (60.4) | 1129 (70.4) | 1098 (61.8) | 939 (32.2) | 17,541 (66.7) | 9683 (72.8) | |
| 2A | 834 (3.3) | 58 (3.6) | 40 (2.3) | 148 (5.1) | 502 (1.9) | 304 (2.3) | |
| 2B | 359 (1.4) | 14 (0.9) | 6 (0.3) | 56 (1.9) | 345 (1.3) | 163 (1.2) | |
| PSA (Prostate-specific antigen), ng/mL | <0.0001 | ||||||
| 0.2–2.9 | 2313 (9.20) | 181 (11.3) | 167 (9.4) | 277 (9.5) | 2714 (10.3) | 1449 (10.9) | |
| 3.0–6.9 | 16,538 (65.5) | 1121 (69.9) | 1225 (68.9) | 1984 (68.0) | 18,333 (69.7) | 9263 (69.6) | |
| 7.0–10.0 | 6384 (25.3) | 302 (18.8) | 385 (21.7) | 657 (22.5) | 5264 (20.0) | 2589 (19.5) | |
| Total Gleason Score | <0.0001 | ||||||
| <6 | 564 (2.2) | 25 (1.6) | 39 (2.2) | 22 (0.8) | 722 (2.7) | 360 (2.7) | |
| 6 | 24,671 (97.8 | 1579 (98.4) | 1738 (97.8) | 2896 (99.2) | 25,589 (97.3) | 12,941 (97.3) | |
| Hormonal Therapy | <0.0001 | ||||||
| No | 21,091 (85.9) | 1079 (69.3) | 1671 (96.0) | 2630 (93.6) | 20,999 (81.8) | 10,863 (83.7) | |
| Yes | 3468 (14.1) | 477 (30.7) | 69 (4.0) | 180 (6.4) | 4666 (18.2) | 2123 (16.3) | |
| Unknown (1830) | - | - | - | - | - | - |
| Intermediate Risk | IMRT Only (n = 48,160) | IMRT + BT Boost (n = 7092) | Proton (n = 2296) | SBRT (n = 3795) | BT LDR (n = 15,534) | BT HDR (n = 7864) | p-Value |
| Year of Diagnosis | <0.0001 | ||||||
| 2004–2007 | 12,498 (26.0) | 2144 (30.2) | 721 (31.4) | 211 (5.6) | 5579 (35.9) | 3212 (40.8) | |
| 2008–2011 | 18,438 (38.3) | 2733 (38.5) | 814 (35.5) | 1240 (32.7) | 5167 (33.3) | 2627 (33.4) | |
| 2012–2015 | 17,224 (35.8) | 2215 (31.2) | 761 (33.1) | 2344 (61.8) | 4788 (30.8) | 2025 (25.8) | |
| Age (years) | <0.0001 | ||||||
| <65 | 11,689 (24.3) | 2734 (38.6) | 852 (37.1) | 1154 (30.4) | 5303 (34.1) | 2964 (37.7) | |
| 65–69 | 10,952 (22.7) | 1814 (25.6) | 649 28.3) | 973 (25.6) | 3814 (24.6) | 1958 (24.9) | |
| 70–74 | 12,552 (26.1) | 1566 (22.1) | 464 (20.2) | 924 (24.3) | 3590 (23.1) | 1680 (21.4) | |
| >74 | 12,967 (26.9) | 978 (13.8) | 331 (14.4) | 744 (19.6) | 2827 (18.2) | 1262 (16.0) | |
| Race | <0.0001 | ||||||
| White | 38,718 (80.4) | 5482 (77.3) | 2079 (90.5) | 3092 (81.5) | 13,002 (83.7) | 6351 (80.8) | |
| Black | 7684 (16.0) | 1322 (18.8) | 125 (5.4) | 571 (15.0) | 2077 (13.4) | 1131 (14.4) | |
| Other | 1256 (2.6) | 217 (3.1) | 80 (3.50) | 91 (2.4) | 307 (2.0) | 266 (3.4) | |
| Unknown (880) | 502 (1.00) | 61 (0.9) | 12 (0.50) | 41 (1.1) | 148 (1.0) | 116 (1.5) | |
| Insurance Status | <0.0001 | ||||||
| None | 615 (1.3) | 58 (0.8) | 62 (2.7) | 31 (0.8) | 117 (0.8) | 70 (0.9) | |
| Government | 33,895 (70.4) | 4087 (57.6) | 1332 (58.0) | 2359 (62.2) | 9415 (60.6) | 4478 (56.9) | |
| Private | 13,018 (27.0) | 2869 (40.5) | 887 (38.6) | 1301 (34.3) | 5838 (37.6) | 3227 (41.0) | |
| Unknown (1082) | 632 (1.3) | 78 (1.1) | 15 (0.7) | 104 (2.7) | 164 (1.1) | 89 (1.10) | |
| Charlson–Deyo Comorbidity index | <0.0001 | ||||||
| 0 | 41,173 (85.5) | 6097 (86.0) | 2015 (87.8) | 3223 (84.9) | 13,079 (84.2) | 6809 (86.6) | |
| 1 | 5582 (11.6) | 865 (12.2) | 249 (10.8) | 489 (12.9) | 2069 (13.3) | 903 (11.5) | |
| 2+ | 1405 (2.9) | 130 (1.8) | 32 (1.4) | 83 (2.2) | 386 (2.5) | 152 (1.9) | |
| Residential Setting | <0.0001 | ||||||
| Metro | 38,924 (82.9) | 5954 (85.7) | 1928 (87.3) | 3275 (88.8) | 11,589 (76.8) | 6424 (83.8) | |
| Urban | 7112 (15.1) | 878 (12.6) | 257 (11.6) | 369 (10.0) | 2931 (19.4) | 1070 (14.0) | |
| Rural | 923 (2.0) | 113 (1.6) | 24 (1.1) | 44 (1.2) | 574 (3.8) | 173 (2.3) | |
| Missing (2179) | - | - | - | - | - | - | |
| Median Income (Residential area), $ | <0.0001 | ||||||
| <38,000 | 8388 (17.5) | 1227 (17.4) | 210 (9.2) | 412 (10.9) | 2676 (17.4) | 1084 (13.9) | |
| 38,000–47,999 | 11,077 (23.1) | 1586 (22.5) | 454 (19.9) | 524 (13.9) | 3796 (24.7) | 1613 (20.7) | |
| 48,000–62,999 | 13,208 (27.6) | 1724 (24.5) | 655 (28.7) | 791 (21.0) | 4148 (27.0) | 2001 (25.6) | |
| 63,000+ | 15,198 (31.7) | 2497 (35.5) | 965 (42.3) | 2046 (54.2) | 4755 (30.9) | 3105 (39.8) | |
| Missing (601) | - | - | - | - | - | - | |
| Without high school degree (Residential area), % | <0.0001 | ||||||
| <7 | 11,946 (24.9) | 1841 (26.2) | 771 (33.8) | 1354 (35.9) | 3891 (25.3) | 2328 (29.8) | |
| 7–12.9 | 16,371 (34.2) | 2259 (32.1) | 760 (33.3) | 1164 (30.8) | 5198 (33.8) | 2630 (33.7) | |
| 13–20.9 | 12,131 (25.3) | 1748 (24.8) | 443 (19.4) | 782 (20.7) | 3971 (25.8) | 1927 (24.7) | |
| 21+ | 7451 (15.6) | 1188 (16.9) | 310 (13.6) | 475 (12.6) | 2333 (15.2) | 920 (11.8) | |
| Missing (549) | - | - | - | - | - | - | |
| Distance from facility to residence, miles | <0.0001 | ||||||
| <5 | 15,957 (33.3) | 2117 (30.1) | 107 (4.7) | 780 (20.6) | 3372 (21.9) | 1796 (23.0) | |
| 5–9.9 | 11,833 (24.7) | 1674 (23.8) | 91 (4.0) | 820 (21.7) | 3077 (20.0) | 1709 (21.9) | |
| 10–24.9 | 13,229 (27.6) | 1996 (28.3) | 243 (10.6) | 1107 (29.3) | 4315 (28.0) | 2126 (27.2) | |
| 25+ | 6894 (14.4) | 1254 (17.8) | 1844 (80.7) | 1071 (28.3) | 4633 (30.1) | 2181 (27.9) | |
| Missing (515) | - | - | - | - | - | - | |
| Facility Type | <0.0001 | ||||||
| Non-academic | 35,425 (73.6) | 5129 (72.3) | 105 (4.60) | 1600 (42.2) | 11,667 (75.1) | 5340 (67.9) | |
| Academic/research | 12,734 (26.4) | 1962 (27.7) | 2190 (95.4) | 2195 (57.8) | 3867 (24.9) | 2524 (32.1) | |
| Missing (3) | - | - | - | - | - | - | |
| Facility Location | <0.0001 | ||||||
| Northeast | 12,791 (26.6) | 1725 (24.3) | 134 (5.8) | 1589 (41.9) | 2749 (17.7) | 1451 (18.5) | |
| South | 15,046 (31.2) | 2903 (40.9) | 83 (3.6) | 1186 (31.3) | 5964 (38.4) | 2695 (34.3) | |
| Midwest | 13,849 (28.8) | 1458 (20.6) | 47 (2.0) | 787 (20.7) | 4633 (29.8) | 2102 (26.7) | |
| West | 6473 (13.4) | 1005 (14.2) | 2031 (88.5) | 233 (6.1) | 2188 (14.1) | 1616 (20.5) | |
| Missing (3) | - | - | - | - | - | - | |
| T-Stage * | <0.0001 | ||||||
| 1 | 1802 (3.7) | 216 (3.0) | 255 (11.1) | 244 (6.4) | 735 (4.7) | 295 (3.8) | |
| 2 | 21,995 (45.7) | 3684 (51.9) | 1247 (54.3) | 739 (19.5) | 8320 (53.6) | 4806 (61.1) | |
| 2A | 21,609 (44.9) | 2807 (39.6) | 687 (29.9) | 2565 (67.6) | 5955 (38.3) | 2492 (31.7) | |
| 2B | 2747 (5.7) | 385 (5.4) | 107 (4.70) | 247 (6.50) | 522 (3.4) | 270 (3.4) | |
| PSA (Prostate-specific antigen), ng/mL | <0.0001 | ||||||
| 0.2–2.9 | 2766 (5.7) | 402 (5.7) | 132 (5.7) | 194 (5.1) | 996 (6.4) | 573 (7.3) | |
| 3.0–6.9 | 20,908 (43.4) | 3624 (51.1) | 1191 (51.9) | 1920 (50.6) | 7976 (51.3) | 4077 (51.8) | |
| 7.0–10.0 | 10,451 (21.7) | 1430 (20.2) | 463 (20.2) | 799 (21.1) | 2918 (18.8) | 1437 (18.3) | |
| 10.1–12.9 | 7341 (15.2) | 857 (12.1) | 300 (13.1) | 516 (13.6) | 2377 (15.3) | 1110 (14.1) | |
| 13.0–16.9 | 4721 (9.8) | 550 (7.8) | 142 (6.2) | 286 (7.5) | 964 (6.2) | 468 (6.0) | |
| 17.0–20.0 | 1973 (4.1) | 229 (3.2) | 68 (3.0) | 80 (2.1) | 303 (2.0) | 199 (2.5) | |
| Total Gleason Score | <0.0001 | ||||||
| <6 | 188 (0.4) | 16 (0.2) | 3 (0.1) | 4 (0.1) | 126 (0.8) | 64 (0.8) | |
| 6 | 6946 (14.4) | 735 (10.4) | 501 (21.8) | 493 (13.0) | 3205 (20.6) | 1643 (20.9) | |
| 7 | 41,026 (85.2) | 6341 (89.4) | 1792 (78.0) | 3298 (86.9) | 12,203 (78.6) | 6157 (78.3) | |
| Hormonal Therapy | <0.0001 | ||||||
| No | 26,276 (55.6) | 4242 (61.1) | 1965 (87.3) | 3137 (85.9) | 11,308 (74.3) | 5947 (77.3) | |
| Yes | 21,016 (44.4) | 2698 (38.9) | 285 (12.7) | 515 (14.1) | 3904 (25.7) | 1742 (22.7) | |
| Unknown (1706) | - | - | - | - | - | - |
| High Risk | IMRT Only (n = 32,851) | IMRT + BT Boost (n = 4038) | Proton (n = 488) | SBRT (n = 820) | BT LDR (n = 3607) | BT HDR (n = 2235) | p-Value |
| Year of Diagnosis | <0.0001 | ||||||
| 2004–2007 | 7246 (22.1) | 1015 (25.1) | 150 (30.7) | 36 (4.4) | 1507 (41.8) | 867 (38.8) | |
| 2008–2011 | 12,337 (37.6) | 1564 (38.7) | 112 (23.0) | 311 (37.9) | 1204 (33.4) | 797 (35.7) | |
| 2012–2015 | 13,268 (40.4) | 1459 (36.1) | 226 (46.3) | 473 (57.7) | 896 (24.8) | 571 (25.5) | |
| Age (years) | <0.0001 | ||||||
| <65 | 7094 (21.6) | 1295 (32.1) | 119 (24.4) | 203 (24.8) | 1154 (32.0) | 738 (33.0) | |
| 65–69 | 6541 (19.9) | 961 (23.8) | 123 (25.2) | 176 (21.5) | 874 (24.2) | 541 (24.2) | |
| 70–74 | 7965 (24.2) | 1012 (25.1) | 113 (23.2) | 182 (22.2) | 816 (22.6) | 518 (23.2) | |
| >74 | 11,251 (34.2) | 770 (19.1) | 133 (27.3) | 259 (31.6) | 763 (21.2) | 438 (19.6) | |
| Race | <0.0001 | ||||||
| White | 26,207 (79.8) | 3069 (76.0) | 417 (85.5) | 667 (81.3) | 2982 (82.7) | 1789 (80.0) | |
| Black | 5401 (16.4) | 757 (18.7) | 52 (10.7) | 123 (15.0) | 513 (14.2) | 355 (15.9) | |
| Other | 946 (2.9) | 175 (4.3) | 17 (3.5) | 14 (1.7) | 71 (2.0) | 69 (3.1) | |
| Unknown (415) | 297 (0.9) | 37 (0.9) | 2 (0.4) | 16 (2.0) | 41 (1.1) | 22 (1.0) | |
| Insurance Status | <0.0001 | ||||||
| None | 518 (1.6) | 36 (0.9) | 7 (1.4) | 9 (1.1) | 24 (0.7) | 23 (1.0) | |
| Government | 24,018 (73.1) | 2510 (62.2) | 326 (66.8) | 566 (69.0) | 2316 (64.2) | 1323 (59.2) | |
| Private | 7912 (24.1) | 1452 (36.0) | 152 (31.1) | 229 (27.9) | 1224 (33.9) | 854 (38.2) | |
| Unknown (540) | 403 (1.2) | 40 (1.0) | 3 (0.6) | 16 (2.0) | 43 (1.2) | 35 (1.6) | |
| Charlson–Deyo Comorbidity index | <0.0001 | ||||||
| 0 | 27,820 (84.7) | 3428 (84.9) | 426 (87.3) | 689 (84.0) | 3081 (85.4) | 1902 (85.1) | |
| 1 | 4001 (12.2) | 517 (12.8) | 53 (10.9) | 113 (13.8) | 442 (12.3) | 287 (12.8) | |
| 2+ | 1030 (3.1) | 93 (2.3) | 9 (1.8) | 18 (2.2) | 84 (2.3) | 46 (2.1) | |
| Residential Setting | <0.0001 | ||||||
| Metro | 26,116 (81.7) | 3418 (86.2) | 418 (88.4) | 700 (88.5) | 2625 (74.7) | 1774 (82.2) | |
| Urban | 5134 (16.1) | 481 (12.1) | 50 (10.6) | 87 (11.0) | 753 (21.4) | 328 (15.2) | |
| Rural | 713 (2.2) | 65 (1.6) | 5 (1.1) | 4 (0.5) | 138 (3.9) | 57 (2.6) | |
| Missing (1173) | - | - | - | - | - | - | |
| Median Income (Residential area), $ | <0.0001 | ||||||
| <38,000 | 5926 (18.2) | 612 (15.3) | 51 (10.5) | 78 (9.70) | 710 (19.8) | 358 (16.2) | |
| 38,000–47,999 | 7897 (24.2) | 784 (19.6) | 94 (19.4) | 120 (14.9) | 922 (25.8) | 497 (22.4) | |
| 48,000–62,999 | 8793 (27.0) | 1061 (26.5) | 151 (31.1) | 173 (21.4) | 876 (24.5) | 567 (25.6) | |
| 63,000+ | 10,009 (30.7) | 1548 (38.7) | 189 (39.0) | 436 (54.0) | 1069 (29.9) | 793 (35.8) | |
| Missing (325) | - | - | - | - | - | - | |
| Without high school degree (Residential area), % | <0.0001 | ||||||
| <7 | 7910 (24.2) | 1080 (26.9) | 135 (27.8) | 284 (35.0) | 790 (22.1) | 587 (26.5) | |
| 7–12.9 | 10,970 (33.6) | 1343 (33.5) | 147 (30.3) | 225 (27.7) | 1248 (34.9) | 772 (34.8) | |
| 13–20.9 | 8558 (26.2) | 963 (24.0) | 126 (26.0) | 198 (24.4) | 924 (25.8) | 548 (24.7) | |
| 21+ | 5218 (16.0) | 623 (15.5) | 77 (15.9) | 104 (12.8) | 616 (17.2) | 309 (13.9) | |
| Missing (284) | - | - | - | - | - | - | |
| Distance from facility to residence, miles | <0.0001 | ||||||
| <5 | 10,635 (32.6) | 1238 (30.9) | 38 (7.8) | 154 (18.9) | 768 (21.5) | 503 (22.7) | |
| 5–9.9 | 7778 (23.8) | 903 (22.5) | 46 (9.5) | 165 (20.3) | 707 (19.8) | 467 (21.1) | |
| 10–24.9 | 8887 (27.2) | 1133 (28.3) | 81 (16.7) | 249 (30.6) | 1016 (28.4) | 632 (28.5) | |
| 25+ | 5364 (16.4) | 736 (18.4) | 320 (66.0) | 245 (30.1) | 1088 (30.4) | 616 (27.8) | |
| Missing (270) | - | - | - | - | - | - | |
| Facility Type | <0.0001 | ||||||
| Non-academic | 23,780 (72.4) | 2811 (69.6) | 43 (8.8) | 325 (39.6) | 2666 (73.9) | 1516 (67.8) | |
| Academic/research | 9069 (27.6) | 1227 (30.4) | 444 (91.2) | 495 (60.4) | 941 (26.1) | 719 (32.2) | |
| Missing (3) | - | - | - | - | - | - | |
| Facility Location | <0.0001 | ||||||
| Northeast | 8174 (24.9) | 814 (20.2) | 58 (11.9) | 372 (45.4) | 542 (15.0) | 388 (17.4) | |
| South | 10,742 (32.7) | 1571 (38.9) | 35 (7.2) | 269 (32.8) | 1697 (47.0) | 861 (38.5) | |
| Midwest | 9561 (29.1) | 910 (22.5) | 22 (4.5) | 134 (16.3) | 1047 (29.0) | 662 (29.6) | |
| West | 4372 (13.3) | 743 (18.4) | 372 (76.4) | 45 (5.5) | 321 (8.9) | 324 (14.5) | |
| Missing (3) | - | - | - | - | - | - | |
| T-Stage | <0.0001 | ||||||
| 1 | 940 (2.90) | 79 (2.0) | 20 (4.1) | 83 (10.1) | 173 (4.8) | 125 (5.6) | |
| 2 | 11,498 (35.0) | 1568 (38.8) | 204 (41.8) | 140 (17.1) | 2058 (57.1) | 1230 (55.0) | |
| 2A | 1649 (5.0) | 156 (3.9) | 24 (4.9) | 99 (12.1) | 179 (5.0) | 121 (5.4) | |
| 2B | 14,215 (43.3) | 1647 (40.8) | 161 (33.0) | 469 (57.2) | 974 (27.0) | 576 (25.8) | |
| 3 | 4307 (13.1) | 577 (14.3) | 78 (16.0) | 29 (3.5) | 215 (6.0) | 179 (8.0) | |
| 4 | 242 (0.7) | 11 (0.3) | 1 (0.2) | 0 | 8 (0.2) | 4 (0.2) | |
| PSA (Prostate-specific antigen), ng/mL | <0.0001 | ||||||
| 0.2–2.9 | 1396 (4.2) | 160 (4.0) | 21 (4.3) | 23 (2.8) | 121 (3.4) | 76 (3.4) | |
| 3.0–6.9 | 7590 (23.1) | 1281 (31.7) | 133 (27.3) | 170 (20.7) | 663 (18.4) | 434 (19.4) | |
| 7.0–10.0 | 5058 (15.4) | 673 (16.7) | 93 (19.1) | 89 (10.9) | 330 (9.1) | 245 (11.0) | |
| 10.1–12.9 | 3048 (9.3) | 380 (9.4) | 52 (10.7) | 59 (7.2) | 185 (5.1) | 147 (6.6) | |
| 13.0–16.9 | 2366 (7.2) | 277 (6.9) | 37 (7.6) | 45 (5.5) | 147 (4.1) | 91 (4.1) | |
| 17.0–20.0 | 1232 (3.8) | 109 (2.7) | 17 (3.5) | 18 (2.2) | 53 (1.5) | 55 (2.5) | |
| 20.1–49.9 | 8687 (26.4) | 844 (20.9) | 107 (21.9) | 212 (25.9) | 1115 (30.9) | 660 (29.5) | |
| 50.0–74.9 | 2399 (7.3) | 255 (5.6) | 15 (3.1) | 150 (18.3) | 669 (18.5) | 392 (17.5) | |
| >74.9 | 1075 (3.3) | 89 (2.2) | 13 (2.7) | 54 (6.6) | 324 (9.0) | 135 (6.0) | |
| Total Gleason Score | <0.0001 | ||||||
| <6 | 86 (0.3) | 8 (0.2) | 1 (0.2) | 2 (0.2) | 37 (1.0) | 11 (0.5) | |
| 6 | 2320 (7.1) | 217 (5.4) | 39 (8.0) | 174 (21.2) | 1144 (31.7) | 625 (28.0) | |
| 7 | 6060 (18.4) | 770 (19.1) | 94 (19.3) | 202 (24.6) | 768 (21.3) | 431 (19.3) | |
| 8 | 14,208 (43.2) | 1929 (47.8) | 228 (46.7) | 331 (40.4) | 1080 (29.9) | 714 (31.9) | |
| 9 | 9257 (28.2) | 1035 (25.6) | 118 (24.2) | 99 (12.1) | 519 (14.4) | 422 (18.9) | |
| 10 | 920 (2.8) | 79 (2.0) | 8 (1.6) | 12 (1.5) | 59 (1.6) | 32 (1.4) | |
| Hormonal Therapy | <0.0001 | ||||||
| No | 5755 (17.7) | 955 (24.0) | 187 (38.8) | 530 (66.3) | 1847 (52.2) | 1183 (53.9) | |
| Yes | 26,745 (82.3) | 3019 (76.0) | 295 (61.2) | 270 (33.7) | 1689 (47.8) | 1013 (46.1) | |
| Unknown (1830) | - | - | - | - | - | - |
| Factor | Univariable | Multivariable | ||
| HR (95% CI) | p-Value | HR (95% CI) | p-Value | |
| Low-risk | ||||
| Year of Diagnosis | ||||
| 2004–2007 | 1.0 | - | 1.0 | - |
| 2008–2011 | 1.01 (0.96–1.06) | 0.839 | 1.04 (0.98–1.10) | 0.235 |
| 2012–2015 | 0.96 (0.85–1.08) | 0.480 | 1.06 (0.92–1.23) | 0.413 |
| Age (years) | ||||
| <65 | 1.0 | - | 1.0 | - |
| 65–69 | 1.73 (1.63–1.84) | <0.001 | 1.36 (1.27–1.47) | <0.001 |
| 70–74 | 2.42 (2.28–2.57) | <0.001 | 1.83 (1.70–1.97) | <0.001 |
| >74 | 3.84 (3.61–4.07) | <0.001 | 2.86 (2.65–3.09) | <0.001 |
| Race | ||||
| White | 1.0 | - | 1.0 | - |
| Black | 1.03 (0.97–1.10) | 0.322 | 1.05 (0.98–1.13) | 0.157 |
| Other | 0.69 (0.58–0.82) | <0.001 | 0.79 (0.67–0.95) | 0.010 |
| Insurance Status | ||||
| None | 1.0 | - | 1.0 | - |
| Government | 1.49 (1.18–1.90) | 0.001 | 1.01 (0.78–1.31) | 0.920 |
| Private | 0.65 (0.51–0.83) | 0.001 | 0.72 (0.56–0.93) | 0.011 |
| Charlson–Deyo Comorbidity index | ||||
| 0 | 1.0 | - | 1.0 | - |
| 1 | 1.61 (1.52–1.71) | <0.001 | 1.54 (1.44–1.64) | <0.001 |
| 2+ | 2.79 (2.47–3.15) | <0.001 | 2.59 (2.28–2.93) | <0.001 |
| Residential Setting | ||||
| Metro | 1.0 | - | 1.0 | - |
| Urban | 1.18 (1.11–1.25) | <0.001 | 1.06 (0.99–1.14) | 0.086 |
| Rural | 1.38 (1.21–1.59) | <0.001 | 1.24 (1.07–1.43) | 0.005 |
| Median Income (Residential area), $ | ||||
| <38,000 | 1.0 | - | 1.0 | - |
| 38,000–47,999 | 0.88 (0.82–0.94) | <0.001 | 0.92 (0.86–0.99) | 0.027 |
| 48,000–62,999 | 0.78 (0.73–0.83) | <0.001 | 0.88 (0.82–0.95) | 0.002 |
| 63,000+ | 0.63 (0.59–0.67) | <0.001 | 0.81 (0.74–0.88) | <0.001 |
| Without high school degree (Residential area), % | ||||
| <7 | 1.0 | - | 1.0 | - |
| 7–12.9 | 1.23 (1.16–1.30) | <0.001 | 1.13 (1.06–1.20) | <0.001 |
| 13–20.9 | 1.41 (1.32–1.49) | <0.001 | 1.22 (1.13–1.32) | <0.001 |
| 21+ | 1.51 (1.41–1.62) | <0.001 | 1.25 (1.14–1.38) | <0.001 |
| Distance from facility to residence, miles | ||||
| <5 | 1.0 | - | 1.0 | - |
| 5–9.9 | 0.94 (0.89–0.99) | 0.027 | 1.02 (0.96–1.08) | 0.590 |
| 10–24.9 | 0.90 (0.85–0.95) | <0.001 | 0.99 (0.93–1.05) | 0.760 |
| 25+ | 0.83 (0.78–0.88) | <0.001 | 0.87 (0.81–0.94) | <0.001 |
| Facility Type | ||||
| Non-academic | 1.0 | - | 1.0 | - |
| Academic/research | 0.81 (0.77–0.85) | <0.001 | 0.95 (0.90–1.00) | 0.060 |
| Facility Location | ||||
| Northeast | 1.0 | - | 1.0 | - |
| South | 1.14 (1.08–1.20) | <0.001 | 1.02 (0.96–1.08) | 0.492 |
| Midwest | 1.08 (1.02–1.15) | 0.006 | 0.97 (0.91–1.03) | 0.271 |
| West | 0.67 (0.62–0.72) | <0.001 | 0.77 (0.71–0.84) | <0.001 |
| T-Stage | ||||
| 1 | 1.0 | - | 1.0 | - |
| 2 | 1.06 (0.98–1.13) | 0.137 | 1.08 (0.99–1.19) | 0.078 |
| 2A | 1.13 (0.93–1.38) | 0.206 | 1.13 (0.92–1.38) | 0.239 |
| 2B | 0.91 (0.71–1.17) | 0.470 | 0.92 (0.71–1.19) | 0.510 |
| Radiotherapy | ||||
| IMRT only | 1.0 | - | 1.0 | - |
| IMRT + BT Boost | 0.63 (0.54–0.73) | <0.001 | 0.71 (0.60–0.83) | <0.001 |
| Proton | 0.29 (0.23–0.37) | <0.001 | 0.51 (0.40–0.66) | <0.001 |
| SBRT | 0.74 (0.64–0.86) | <0.001 | 0.87 (0.75–1.02) | <0.001 |
| BT LDR | 0.75 (0.71–0.79) | <0.001 | 0.85 (0.81–0.90) | <0.001 |
| BT HDR | 0.69 (0.65–0.73) | <0.001 | 0.83 (0.78–0.89) | <0.001 |
| Hormonal Therapy | ||||
| No | 1.0 | - | 1.0 | - |
| Yes | 1.14 (1.08–1.19) | <0.001 | 0.97 (0.92–1.02) | 0.256 |
| Factor | Univariable | Multivariable | ||
| HR (95% CI) | p-Value | HR (95% CI) | p-Value | |
| Intermediate-risk | ||||
| Year of Diagnosis | ||||
| 2004–2007 | 1.0 | - | 1.0 | - |
| 2008–2011 | 1.01 (0.97–1.05) | 0.767 | 0.99 (0.95–1.04) | 0.695 |
| 2012–2015 | 0.96 (0.89–1.03) | 0.286 | 0.97 (0.88–1.06) | 0.471 |
| Age (years) | ||||
| <65 | 1.0 | - | 1.0 | - |
| 65–69 | 1.42 (1.34–1.51) | <0.001 | 1.18 (1.10–1.26) | <0.001 |
| 70–74 | 1.84 (1.74–1.95) | <0.001 | 1.47 (1.37–1.57) | <0.001 |
| >74 | 2.85 (2.70–3.00) | <0.001 | 2.24 (2.10–2.39) | <0.001 |
| Race | ||||
| White | 1.0 | - | 1.0 | - |
| Black | 0.98 (0.93–1.03) | 0.379 | 1.02 (0.96–1.08) | 0.504 |
| Other | 0.72 (0.64–0.82) | <0.001 | 0.78 (0.68–0.90) | <0.001 |
| Insurance Status | ||||
| None | 1.0 | - | 1.0 | - |
| Government | 1.69 (1.37–2.08) | <0.001 | 1.29 (1.04–1.61) | 0.023 |
| Private | 0.87 (0.71–1.08) | 0.205 | 0.96 (0.77–1.19) | 0.681 |
| Charlson–Deyo Comorbidity index | ||||
| 0 | 1.0 | - | 1.0 | - |
| 1 | 1.46 (1.39–1.54) | <0.001 | 1.47 (1.40–1.55) | <0.001 |
| 2+ | 2.32 (2.12–2.54) | <0.001 | 2.20 (2.00–2.42) | <0.001 |
| Residential Setting | ||||
| Metro | 1.0 | - | 1.0 | - |
| Urban | 1.15 (1.10–1.21) | <0.001 | 1.02 (0.96–1.08) | 0.617 |
| Rural | 1.25 (1.12–1.40) | <0.001 | 1.24 (0.97–1.24) | 0.130 |
| Median Income (Residential area), $ | ||||
| <38,000 | 1.0 | - | 1.0 | - |
| 38,000–47,999 | 0.93 (0.88–0.98) | 0.004 | 0.96 (0.91–1.02) | 0.220 |
| 48,000–62,999 | 0.84 (0.80–0.89) | <0.001 | 0.93 (0.87–0.99) | 0.024 |
| 63,000+ | 0.67 (0.64–0.71) | <0.001 | 0.81 (0.75–0.88) | <0.001 |
| Without high school degree (Residential area), % | ||||
| <7 | 1.0 | - | 1.0 | - |
| 7–12.9 | 1.19 (1.14–1.25) | <0.001 | 1.08 (1.02–1.14) | 0.007 |
| 13–20.9 | 1.32 (1.25–1.39) | <0.001 | 1.15 (1.08–1.23) | <0.001 |
| 21+ | 1.41 (1.33–1.49) | <0.001 | 1.23 (1.14–1.33) | <0.001 |
| Distance from facility to residence, miles | ||||
| <5 | 1.0 | - | 1.0 | - |
| 5–9.9 | 0.91 (0.86–0.95) | <0.001 | 0.96 (0.91–1.01) | 0.104 |
| 10–24.9 | 0.88 (0.84–0.92) | <0.001 | 0.94 (0.90–0.99) | 0.019 |
| 25+ | 0.83 (0.79–0.87) | <0.001 | 0.90 (0.84–0.95) | 0.001 |
| Facility Type | ||||
| Non-academic | 1.0 | - | 1.0 | - |
| Academic/research | 0.82 (0.78–0.85) | <0.001 | 0.95 (0.90–0.99) | 0.013 |
| Facility Location | ||||
| Northeast | 1.0 | - | 1.0 | - |
| South | 1.10 (1.05–1.16) | <0.001 | 1.04 (0.99–1.09) | 0.134 |
| Midwest | 1.10 (1.05–1.16) | <0.001 | 1.02 (0.97–1.08) | 0.392 |
| West | 0.76 (0.72–0.81) | <0.001 | 0.85 (0.80–0.91) | <0.001 |
| T-Stage | ||||
| 1 | 1.0 | - | 1.0 | - |
| 2 | 1.10 (0.98–1.24) | 0.103 | 1.02 (0.90–1.16) | 0.764 |
| 2A | 1.09 (0.96–1.23) | 0.186 | 1.00 (0.88–1.14) | 0.948 |
| 2B | 1.21 (1.04–1.41) | 0.013 | 1.09 (0.93–1.27) | 0.310 |
| Radiotherapy | ||||
| IMRT only | 1.0 | - | 1.0 | - |
| IMRT + BT Boost | 0.60 (0.56–0.65) | <0.001 | 0.70 (0.65–0.76) | <0.001 |
| Proton | 0.35 (0.30–0.41) | <0.001 | 0.56 (0.46–0.67) | <0.001 |
| SBRT | 0.76 (0.67–0.86) | <0.001 | 0.85 (0.75–0.97) | 0.014 |
| BT LDR | 0.73 (0.70–0.77) | <0.001 | 0.81 (0.77–0.85) | <0.001 |
| BT HDR | 0.66 (0.62–0.70) | <0.001 | 0.80 (0.75–0.85) | <0.001 |
| Hormonal Therapy | ||||
| No | 1.0 | - | 1.0 | - |
| Yes | 1.14 (1.10–1.18) | <0.001 | 0.98 (0.94–1.02) | 0.265 |
| Factor | Univariable | Multivariable | ||
| HR (95% CI) | p-Value | HR (95% CI) | p-Value | |
| High-risk | ||||
| Year of Diagnosis | ||||
| 2004–2007 | 1.0 | - | 1.0 | - |
| 2008–2011 | 1.10 (1.05–1.16) | 0.000 | 1.07 (1.02–1.14) | 0.012 0.360 |
| 2012–2015 | 1.08 (0.99–1.17) | 0.072 | 1.05 (0.95–1.16) | - |
| Age (years) | ||||
| <65 | 1.0 | - | 1.0 | - |
| 65–69 | 1.30 (1.21–1.40) | <0.001 | 1.16 (1.07–1.27) | <0.001 |
| 70–74 | 1.56 (1.45–1.67) | <0.001 | 1.35 (1.24–1.46) | <0.001 |
| >74 | 2.41 (2.27–2.57) | <0.001 | 2.08 (1.92–2.25) | <0.001 |
| Race | ||||
| White | 1.0 | - | 1.0 | - |
| Black | 0.86 (0.81–0.91) | <0.001 | 0.92 (0.86–0.99) | 0.023 |
| Other | 0.82 (0.71–0.94 | 0.005 | 0.89 (0.77–1.03) | 0.107 |
| Insurance Status | ||||
| None | 1.0 | - | 1.0 | - |
| Government | 1.69 (1.37–2.08) | 0.001 | 1.04 (0.84–1.29) | 0.701 |
| Private | 0.87 (0.71–1.08) | 0.157 | 0.87 (0.70–1.07) | 0.184 |
| Charlson–Deyo Comorbidity index | ||||
| 0 | 1.0 | - | 1.0 | - |
| 1 | 1.31 (1.23–1.40) | <0.001 | 1.31 (1.23–1.40) | <0.001 |
| 2+ | 2.14 (1.92–2.40) | <0.001 | 2.09 (1.86–2.35) | <0.001 |
| Residential Setting | ||||
| Metro | 1.0 | - | 1.0 | - |
| Urban | 1.15 (1.09–1.22) | <0.001 | 1.08 (1.01–1.16) | 0.031 |
| Rural | 1.11 (0.96–1.28) | 0.161 | 1.06 (0.90–1.24) | 0.482 |
| Median Income (Residential area), $ | ||||
| <38,000 | 1.0 | - | 1.0 | - |
| 38,000–47,999 | 1.03 (0.96–1.10) | 0.426 | 1.01 (0.94–1.09) | 0.797 |
| 48,000–62,999 | 0.94 (0.88–1.01) | 0.075 | 0.95 (0.88–1.03) | 0.230 |
| 63,000+ | 0.80 (0.75–0.85) | <0.001 | 0.87 (0.79–0.95) | 0.003 |
| Without high school degree (Residential area), % | ||||
| <7 | 1.0 | - | 1.0 | - |
| 7–12.9 | 1.13 (1.07–1.20) | <0.001 | 1.07 (1.01–1.15) | 0.034 |
| 13–20.9 | 1.16 (1.09–1.23) | <0.001 | 1.09 (1.01–1.18) | 0.030 |
| 21+ | 1.21 (1.13–1.30) | <0.001 | 1.17 (1.07–1.29) | 0.001 |
| Distance from facility to residence, miles | ||||
| <5 | 1.0 | - | 1.0 | - |
| 5–9.9 | 0.95 (0.89–1.00) | 0.053 | 0.99 (0.93–1.05) | 0.647 |
| 10–24.9 | 0.92 (0.87–0.97) | 0.002 | 0.95 (0.90–1.01) | 0.104 |
| 25+ | 0.86 (0.81–0.92) | <0.001 | 0.87 (0.81–0.94) | <0.001 |
| Facility Type | ||||
| Non-academic | 1.0 | - | 1.0 | - |
| Academic/research | 0.83 (0.79–0.87) | <0.001 | 0.94 (0.90–1.00) | 0.033 |
| Facility Location | ||||
| Northeast | 1.0 | - | 1.0 | - |
| South | 1.09 (1.03–1.16) | 0.003 | 1.10 (1.03–1.17) | 0.003 |
| Midwest | 1.10 (1.04–1.17) | 0.001 | 1.05 (0.99–1.12) | 0.138 |
| West | 0.89 (0.83– 0.96) | 0.002 | 0.90 (0.83–0.97) | 0.008 |
| T-Stage | ||||
| 1 | 1.0 | - | 1.0 | - |
| 2 | 1.26 (1.07–1.49) | 0.006 | 1.26 (1.05–1.51) | 0.012 |
| 2A | 1.46 (1.19–1.78) | <0.001 | 1.38 (1.12–1.71) | 0.003 |
| 2B | 1.33 (1.12–1.58) | 0.001 | 1.25 (1.05–1.50) | 0.015 |
| 3 | 1.48 (1.24–1.76) | <0.001 | 1.53 (1.27–1.84) | <0.001 |
| 4 | 2.46 (1.87–3.23) | <0.001 | 2.79 (2.10–3.70) | <0.001 |
| Radiotherapy | ||||
| IMRT only | 1.0 | - | 1.0 | - |
| IMRT + BT Boost | 0.59 (0.55–0.65) | <0.001 | 0.68 (0.62–0.74) | <0.001 |
| Proton | 0.48 (0.36–0.63) | <0.001 | 0.64 (0.48–0.87) | 0.004 |
| SBRT | 0.73 (0.59–0.91) | 0.005 | 0.86 (0.68–1.08) | 0.187 |
| BT LDR | 0.66 (0.61–0.71) | <0.001 | 0.76 (0.69–0.82) | <0.001 |
| BT HDR | 0.62 (0.56–0.69) | <0.001 | 0.74 (0.66–0.82) | <0.001 |
| Hormonal Therapy | ||||
| No | 1.0 | - | 1.0 | - |
| Yes | 1.21 (1.15–1.27) | <0.001 | 1.05 (1.00–1.11) | 0.062 |
Publisher’s Note: MDPI stays neutral with regard to jurisdictional claims in published maps and institutional affiliations. |
© 2022 by the authors. Licensee MDPI, Basel, Switzerland. This article is an open access article distributed under the terms and conditions of the Creative Commons Attribution (CC BY) license (https://creativecommons.org/licenses/by/4.0/).
Share and Cite
Agrawal, R.; Dey, A.; Datta, S.; Nassar, A.; Grubb, W.; Traughber, B.; Biswas, T.; Ove, R.; Podder, T. Pattern of Radiotherapy Treatment in Low-Risk, Intermediate-Risk, and High-Risk Prostate Cancer Patients: Analysis of National Cancer Database. Cancers 2022, 14, 5503. https://doi.org/10.3390/cancers14225503
Agrawal R, Dey A, Datta S, Nassar A, Grubb W, Traughber B, Biswas T, Ove R, Podder T. Pattern of Radiotherapy Treatment in Low-Risk, Intermediate-Risk, and High-Risk Prostate Cancer Patients: Analysis of National Cancer Database. Cancers. 2022; 14(22):5503. https://doi.org/10.3390/cancers14225503
Chicago/Turabian StyleAgrawal, Rishabh, Asoke Dey, Sujay Datta, Ana Nassar, William Grubb, Bryan Traughber, Tithi Biswas, Roger Ove, and Tarun Podder. 2022. "Pattern of Radiotherapy Treatment in Low-Risk, Intermediate-Risk, and High-Risk Prostate Cancer Patients: Analysis of National Cancer Database" Cancers 14, no. 22: 5503. https://doi.org/10.3390/cancers14225503