Connectivity and Savings Propensity among Odisha Tribals


Lubin School of Business, Pace University, New York, NY 10038, USA
Sustainability 2021, 13(2), 968; https://doi.org/10.3390/su13020968
Submission received: 1 December 2020
/
Revised: 25 December 2020
/
Accepted: 12 January 2021
/
Published: 19 January 2021
(This article belongs to the Section Sustainable Urban and Rural Development)
Abstract
:Tribal areas are some of the poorest regions of India. An increase in local savings is an important tool in fostering sustainable growth in these areas. This paper uses the results of a survey to examine the factors affecting saving in a rural part of Odisha state populated primarily by tribals. We find that an important determinant of savings propensity is connectivity, which we interpret as a measure of the extent to which individuals feel connected to the broader economy, and an indication of their economic optimism. This interpretation is buttressed by the relationship between savings propensity and variables such as food consumption patterns and asset ownership that may also reflect attitudinal factors. One implication of these findings is that connecting rural areas to other, possibly urban, locations could elicit greater savings and thus lead to greater income growth. By relating savings behavior to new sociological population characteristics, such as perceived connectivity and food consumption patterns, this paper provides hitherto unexplored clues for policy initiatives to increase savings.
Keywords:
savings propensity; household finance; development; tribals; connectivity; rural; culture; India1. Introduction
It is universally agreed that savings are important for growth, particularly in developing countries [1,2,3]. This is arguably even more true at the local level, where local savings can be used to promote local investment more effectively and more sustainably than outside intervention. Tribal areas in India are among the poorest, and hence the question of how to promote income growth in these areas is particularly important. It follows that we need to understand how to stimulate savings in tribal areas. Although there are many studies of savings in India [4], they primarily use national accounts data. As Deaton points out, there are problems in extrapolating from national-level aggregate studies to household savings behavior [5]. And even studies of household savings tend primarily to be of urban households. Extrapolating from even the few studies of rural households to tribal regions is problematic since tribal households are much more conservative in their behavior and tend to participate less in the broader economy. Our study of savings behavior in tribal areas of the Malkangiri district in the southern part of the state of Odisha, is therefore, an important step towards improving growth prospects in this region and in other similarly underdeveloped regions in India and elsewhere.
Our study is also innovative in that it is directly linked to questions of public policy. In principle, any study can only tell us about the behavior of respondents at the present time; extrapolation to how respondents might react to policy changes can be problematic. We try to avoid this problem by using respondent characteristics that measure attitudes. Specifically, we ask respondents about connectivity—how connected they feel their village is to the outside world; we interpret responses as a measure of respondents’ evaluation of prospects for integration with the regional market and their openness to development (see Katona, 1965, 1968 for the notion that optimism and pessimism can affect willingness to save [6,7]). Hence, we can interpret the results of our study to answer the question of whether improving connectivity with outside areas is likely to promote savings and through this, greater growth. Ours is the first study to relate savings behavior to connectivity, in this fashion. A positive relationship between measures such as connectivity and savings behavior would suggest that improving communications and other infrastructure is likely to lead to greater savings.
Connectivity is also important in itself as a spur to economic development. Access to markets and connectivity with the broader economy allows local resources to be better utilized in accordance with demands for local products in the larger marketplace (See [8] for evidence on transportation access and connectivity to local economic outcomes, [9] for cross-country evidence on infrastructure access and human development, and [10] for Indonesian evidence). Access to markets also makes larger-scale investments more viable, since production need no longer be for the local micro-market, but rather for the larger macro-market (in the case of Malkangiri, the nearby large town of Jagdalpur or the state capital city of Bhubaneshwar, or even eventually the national market). This can be a catalyst for greater savings since real rates of return on investment will go up and the value of savings will increase (see [11] and the references therein). This paper seeks to discover the extent to which such a narrative is supported by the data on savings. In addition to being a measure of respondents’ attitudes, our connectivity variable can also be used as a measure of a village’s actual connectedness to markets. Hence a finding of a positive relationship between connectivity and savings indicates the value of improving connectedness with greater saving.
Our paper is also innovative in relating food-purchasing patterns to savings behavior. The traditional foods of tribal people in the area that we study are millets, pulses and rice, seasonal forest fruits, and, on occasion, meat (Malkangiri Gazetteer [12]). Foods such as milk, sugar, and vegetables would be considered non-traditional foods, even luxuries; hence a pattern of eating such foods indicates a willingness to change behavior as a response to changing circumstances. Our evidence relating frequency of purchase of milk and vegetables with greater savings is tentative, but we do find that connectivity is strongly related to savings propensity. This is support for governmental investment in public goods, such as roads and internet connections. Our argument, as stated above, implies that this will increase saving and ultimately promote growth.
2. Relationship to Previous Research
The two main theories of household savings behavior depend upon the life-cycle theory [13] and the permanent income theory [14] respectively (See Shawa, 2016 for a comprehensive overview of savings theories [15]). The first emphasizes the life-stage of the saver, while the second emphasizes expected future income rather than current income; hence an increase in expected future income could decrease current savings. The hypothesis that we consider in this paper could be considered a test of the permanent income hypothesis to the extent that we believe that greater connectivity implies larger investment opportunity sets and higher permanent income. Theories of saving more pertinent to developing economies look at other factors, such as access to credit markets. One author [16] suggests that financial savings can be inhibited due to lack of access to credit markets; alternatively, individuals might prefer to invest in real assets [17] or rely on self-insurance, particularly when macro-shocks like droughts are likely [18]. Other researchers [19] suggest that ownership of non-income-producing assets, such as dishwashers, may be considered as substitutes for savings, if they are considered by their owners as wealth. Still others [20] suggest that state-sponsored social insurance programs (like Medicaid in the US) might be a substitute for savings; the same is likely to be true of implicit social insurance in close-knit societies [21]. Finally, psychological theories pioneered in economics in the work of George Katona [6] suggest that factors such as optimism and future orientation are important determinants of saving (see Chowa et al. 2012 for a review of such theories [22]). Other psycho-social theories are marshalled to explain the persistent nature of the private saving rate [16]. Although the permanent income hypothesis of Friedman [14] rules out such persistence, Duesenberry [23] in his Relative Income Hypothesis, explains the impact of past incomes on current savings and consumption, thus leading to a sort of conservatism regarding consumption particularly in bad times. Rhee [24], based on Constantinides [25], also implies the persistence of consumption habits and hence the persistence of savings habits.
We now look at studies of savings behavior in rural South Asian environments—these are particularly useful in that they are likely to provide indications of cultural determinants of savings behavior that need to be taken into account in our study. One group of researchers [26] looks at savings practices in coastal and central Tamil Nadu, centering on Villupuram and Cuddalore districts. They find that caste membership is important; dalits are more likely to use gold as a savings vehicle, as opposed to land, which they were traditionally not allowed to own. In contrast to some other work [27], they do not find substitution effects between informal savings and bank savings. Finally, a Pakistani study [28] finds that savings propensities are higher in rural areas and among educated, wealthier families possessing livestock.
Coming closer to our geographical area of investigation, we have a study that looks at the question of savings in Sundergarh district in north-western Odisha state [29]. Although this area is also quite backward, most of the households surveyed are landless laborers. As such, the results may be different from those in Malkangiri. The sample for this study was half Christian, which also suggests that these results may not be generalizable to Malkangiri. Another study in Vishakapatnam district [30] finds that savings increase with income among rural and tribal households. Savings also increase with the age of the household head, but at a lower rate. This study also found that the dependency ratio affected the amount of savings (the higher the dependency ratio, the lower the savings). Finally, male-headed households save more than female-headed households (adjusted for income, age of head of household, dependency ratio, et cetera).
We find that connectivity is indeed related to savings propensity. As noted above, this can be viewed as support for the permanent income hypothesis [14] to the extent that greater connectivity implies larger investment opportunity sets and higher permanent income. Our findings that savings propensity is positively related to radio ownership is contrary to the findings of [19], but consistent with the observations of [26] that economic behavior is affected by cultural norms and beliefs. Cultural norms may also be explanation for higher savings propensities amongst families that rely exclusively on agricultural revenue. We also see that households with older heads also save more, similar to [27,30]. Our findings regarding the relationship between food-purchasing behavior and savings behavior is an original contribution to the literature. In particular, we find evidence that households that save more tend to purchase vegetables and milk more frequently (though not sugar and fruit). We interpret this to mean that the more frequent consumption of non-traditional foods such as vegetables and milk is an indication of optimism regarding future development. Results for meat consumption were mixed.
3. Sample Selection and Data Collection
3.1. Rationale
An important reason for our choice of location of Malkangiri for our study is that it is one of the least-developed districts in the state of Odisha. Malkangiri is a border district of Odisha and touches the state of Andhra Pradesh on its south and the state of Chhatisgarh on its west. It has a very high proportion of scheduled castes (57.85% of the population) and scheduled tribes (22.77%) as per Table-A-11, Tribewise Population of Odisha in the 2011 Census of Odisha [12]. Scheduled Tribes and Scheduled Castes refer to the caste system in India, which is a stratification of classes that roughly correlates with economic and social status. The lowest castes are among the poorest, and their status as groups deserving of governmental aid and positive discrimination is recognized in the Indian Constitution, which has a schedule with a list of the recognized poorest castes. For this reason, they are called scheduled castes. In addition to the scheduled castes, the Constitution also recognizes that there are other backward castes, which are socially and educationally backward classes. These are also entitled in law to positive discrimination in government employment. Tribes refers to indigenous peoples, who are also recognized in the Indian Constitution as deserving of positive discrimination; the list of recognized tribes for this purpose is also found in a schedule to the Indian Constitution. Scheduled tribes tend to be poor; to live in mountainous and forested areas; and to have their own social organization, customs, and practices. As the Odisha District Gazetteer for Malkangiri notes, “the geography of Malkangiri district is marked by different hill terrains, far-flung cut off areas and dense forest,” with more than 90% of the population living in rural areas. According to the last census, the literacy rate was below 50% [12]. According to the 2013 State of the Forest Survey Report, 40% of the total geographical area of the district is forested, though given the prevailing rate of deforestation, the present proportion is likely to be lower [31]. According to the District Gazetteer, 57.8% of the population is tribal [12], with 97.8% of these living in rural areas. Our sampling strategy, as outlined below, attempts to select respondents from locations that provide sufficient variation in terms of connectivity, but also rules out major urban areas (such as block headquarters). This results in a greater proportion of tribals than for Malkangiri district, overall.
3.2. Method
A master list of villages for Malkangiri district in the state of Odisha was obtained in March 2017 from an Indian government website (http://indiawater.gov.in/IMISWeb/DataEntry/HabitationDirectory/Reports/Rep_DirectoryList.aspx?Condition=P50votMRqBU%3Did=OzojWGbSQEo%3DState). The names of 996 distinct villages were obtained through this procedure. According to this site, are were seven distinct blocks—Kalimela, Khairput, Korkunda, Kudumulugumma, Malkangiri, Mathili, and Podia, in which there were 108 different gram panchayats (somewhat different block names are given at https://villageinfo.in/odisha/malkangiri/m-v-79.html). We first chose 36 villages which were sampled from the 996 distinct villages as follows.
Malkangiri has seven blocks, consisting of 108 Gram Panchayats (village governing zones; GPs). Field workers from an NGO, WASSAN (Watershed Support Services and Activities Network), familiar with Malkangiri district, were asked to assign each GP to one of seven baskets based on the following subjectively understood criteria:
- How far is the Gram Panchayat from main roads?
- How many Gram Panchayat roads are in the Gram Panchayat?
- How far is the Gram Panchayat from block headquarters?
- How far is the Gram Panchayat from district headquarter?
- How many rural development roads are in the Gram Panchayat?
- How mountainous is the Gram Panchayat?
- How many navigable waterways are there in the Gram Panchayat?
- How many waterbodies that make transportation difficult are in the Gram Panchayat?
- How many market centres, both for inputs and outputs, are there in the Gram Panchayat?
- How close are market centres, both for inputs and outputs to the Gram Panchayat, if not actually in the Gram Panchayat?
There were eleven different field workers who engaged in this exercise. Through open discussion, agreement was reached on the assigning of Gram Panchayats to seven baskets; the characteristics of the different baskets are provided in Table 1. This procedure yielded 11 Gram Panchayats in basket 1, the most connected; 31 in basket 2; 27 in basket 3; 15 in basket 4; 8 in basket 5; 10 in basket 6; and 6 in basket 7. The field workers were asked to describe Gram Panchayats in each basket and a rubric was generated using this description.
Subsequently, the same workers were asked to classify Gram Panchayats as either too dangerous for data collection due to Naxalite activities or not dangerous. All the Gram Panchayats falling in basket number 7, seven Gram Panchayats in basket 6 and three Gram Panchayats in basket 5 were classified as dangerous, for a total of sixteen Gram Panchayats. We also decided not to include Gram Panchayats where block headquarters are located. Such areas are likely to be more urban, and otherwise quite different from rural areas. Occupations that are not found in other areas may be found only in such urban/quasi-urban areas. Thus, these areas are not easy to compare with other more rural areas. Six Gram Panchayats in basket 1 were excluded following this procedure. From the remaining Gram Panchayats in six baskets, three Gram Panchayats were chosen randomly without replacement from each basket, for a total of 18 Gram Panchayats. Next, two villages were chosen randomly without replacement from the villages in each of the chosen 18 Gram Panchayats, for a total of 36 villages.
3.3. Survey
Unfortunately, there were difficulties in obtaining household lists and ultimately, interviews were conducted in only 13 villages by four different interviewers, based on household voter lists that were obtained by the workers. Interviewers were provided by the WASSAN Foundation. Local personnel were needed to interview the respondents since many of the respondents were tribals who did not necessary speak even the state language, Odiya. Most of the interviews were, in fact, conducted in Odiya and Kui; interviewers were conversant in Kui and Odiya, with a reasonable knowledge of Hindi and some understanding of English. All interviewers underwent training in order to acquaint them with the meaning of the questions that they were to ask. Even though the questionnaire itself was not translated into Hindi or English, interviewers were provided, during the training, with explanations of the questions in Hindi by the author, supplemented by Odiya explanations from WASSAN personnel, who knew both Hindi and English. Ultimately, 39 households were interviewed by Jatishmaya Biswas; 15 households by Kanhu Charan Sahani; 8 by Subhalaxmi Das in Parkhanmalla village in Parkanamala Gram Panchayat in Kudumulugumma Block; 24 by Mamta Mahapatra—for a total of 86 households (see Table 2 for details).
Respondents were asked for various kinds of information including occupation and caste/tribe affiliation, sources of income, financial services use, bank balances and loans, assets, and, finally, connectivity. The connectivity measure was obtained by asking the question “How connected do you feel your village is?” for current connectivity and “How connected do you feel your village was, three years ago?” for past connectivity. The additional information was provided to interviewers, with the intention that they would use it to help respondents create a frame of reference.
- Use 1 (most connected) if you were living in the District headquarters, Malkangiri town.
- Evaluate your village’s connectivity as compared to Malkangiri town and other villages that you’re familiar with.
- Characteristics of an ill-connected village:
- ○
- I have to go far away to buy what I need.
- ○
- I have to go far away to sell what I produce; if I sell nearby, I don’t get a fair price.
- ○
- I don’t know what is happening in the world.
- Characteristics of a well-connected village:
- ○
- People come to the village often from outside.
- ○
- I often travel outside the village to visit friends/relatives.
3.4. Summary of Thesis
Our thesis, in summary, is the following. Households that rate their villages as being more connected will be more optimistic about the future. They will view connectivity as potentially leading to greater connectedness with markets and greater future incomes. This will provide them with the incentive to save more. Adjusted for other household characteristics, we expect a positive relationship between savings propensity and connectivity.
4. Results and Explanation
Our unit of analysis is the family. While a large majority of heads of households noted agriculture as their primary occupation (86%), an important proportion (39.74%) listed non-timber forest products (NTFP) as their secondary source of income (Table 3) Non-timber forest products are an important source of livelihood for many tribals and other peoples living in forested areas. These forest products include leaves, gums, resins, nuts, fruits, flowers, kernels, fibers, edible fruits, and medicinal plants; they are either sold directly or further processed in the open market or to government organizations [32]. Of the 62 individuals who answered the question, 77.42% identified themselves as members of a scheduled tribe, 16.13% identified as members of a scheduled caste, 3.23% as members of another backward caste, and a further 3.23% as “other”.
The survey described in the previous section provides us with data on various aspects of the family’s financial condition, both the balance sheet and the income statement, as well as other characteristics of the family’s living and working environment that are useful for our analysis. From the balance sheet, we also have information about the various kinds of assets that they possess. From Table 4, we see that the propensity to save—defined as the bank balance divided by total household income—varies according to these different respondent characteristics. In particular, we see that the propensity to save is increasing in connectivity. The more the respondent feels that his/her village is connected to the broader world, the more they tend to save out of their income. Although there is a stronger correlation between the propensity to save and current perceived connectivity, compared to past connectivity, there is no significant relationship between the propensity to save and the change in perceived connectivity.
After looking briefly at how savings propensity varies with income, we will investigate more deeply the impact of connectivity on savings propensity and try to show that the evidence from lifestyle variables can be marshalled into a coherent picture of the positive impact of connectivity on savings behavior. The evidence, we will show, suggests that connectivity is connected with an economic optimism that derives from closer links to the broader economy and expectations of better times ahead.
4.1. Propensity to Save and Income
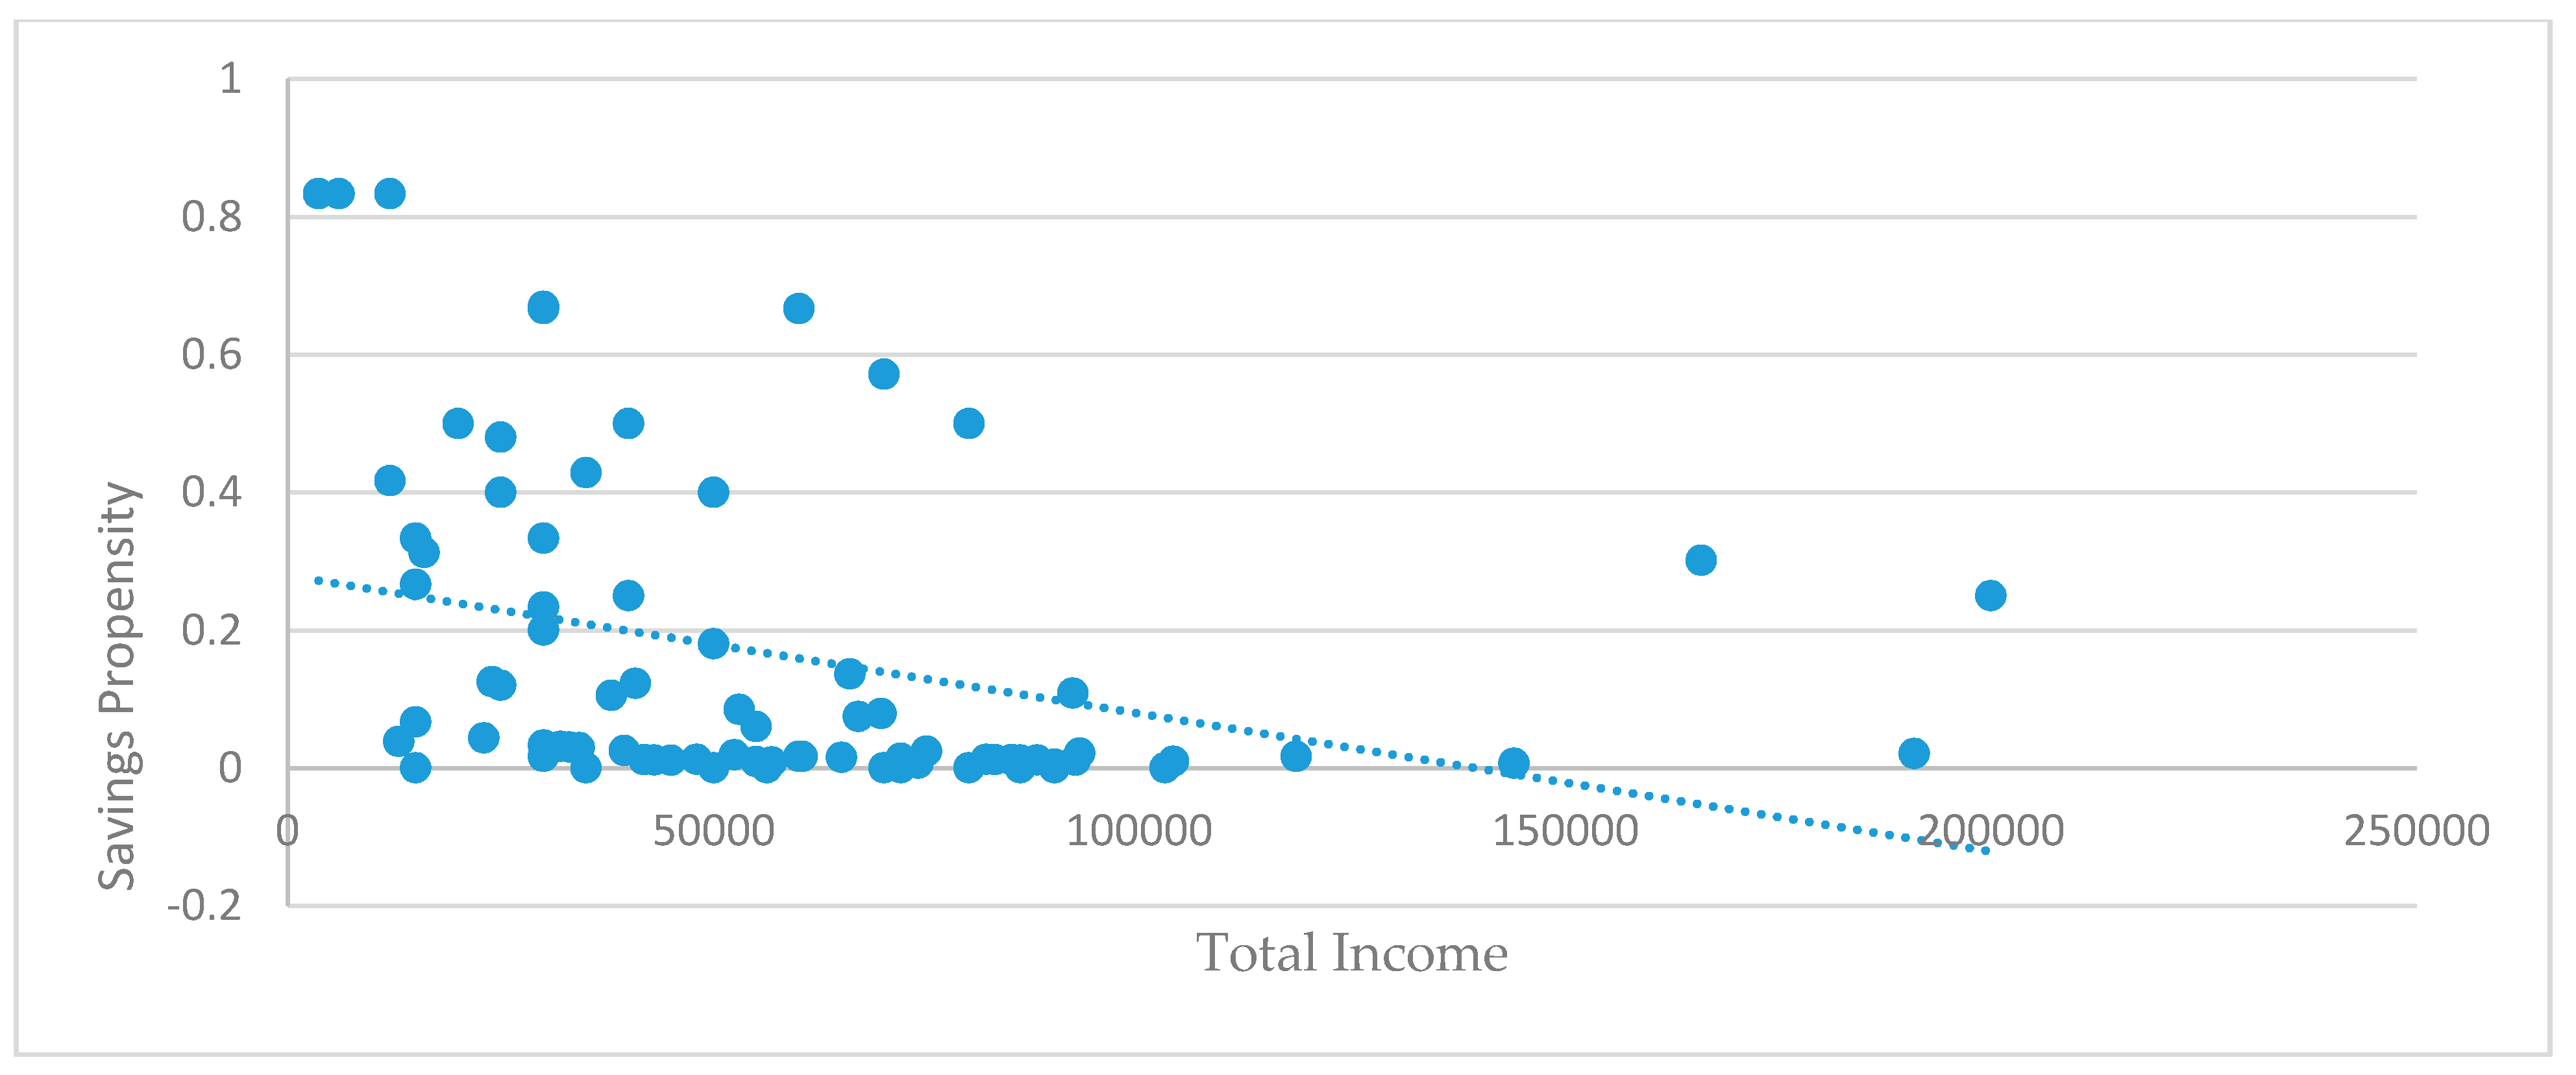
The propensity to save is negatively correlated with the total income of the family (Table 4). We explain this in terms of the interplay of the two reasons for saving—one a precautionary motive, whereby a person saves for the future as part of a risk management strategy, and the other, an ordinary savings motive, whereby an individual might want to smooth consumption over time or over his/her lifetime (intertemporal motive). The precautionary motive is related to the fear of unexpected negative income shocks that might force consumption below desired minimum levels. One might expect this sort of saving to be negatively related to income [33]. Savings due to the intertemporal motive are usually increasing in income. However, at very low levels, individuals may choose to consume as much as possible to maintain minimum caloric needs. If initial caloric needs are not met, then this may cause savings due to the intertemporal motive to be flat or even decreasing in income. At the same time, precautionary savings would also decrease in income, as expected. As a result, we’d expect total savings to be decreasing in income at low-income levels. Considering that many of the households in our population are poor tribal families, this is to be expected.
However, once income levels rise sufficiently, the normal intertemporal motive would reassert itself. This is indeed what we see when we regress the level of savings against total income (of all family members) and total income (of all family members) squared—the coefficient of total income is negative, but the coefficient of total income squared is positive. This is because at higher levels of income, the positive contribution of the squared term would eclipse the negative contribution of the total income term, consistent with our explanation. However, total income is endogenous and causality may well go in the other direction. The fitted equation is given below, where the coefficient for total income squared is significant at the 10% level of significance.
4.2. Propensity to Save and Lifestyle
From Table 5, we see that the propensity to save is higher for those who purchase meat less frequently, those who purchase vegetables less frequently, those who do not have mobile phones, and those who do not have television sets or motor vehicles. On the other hand, people who own radios do seem to save more. Finally, people who possess life, health, crop, or other insurance also seem to save more as a proportion of their income. We note that people who are less likely to consume high-quality and high-priced goods (for example, using radios instead of television sets for entertainment) and those who purchase insurance are more likely to save. Both these characteristics can be reasonably identified with an economic optimism, expressed in a willingness to postpone current consumption in the expectation of better times in the future.
Table 6 shows that those who pursue farming as an occupation exclusively tend to have a greater savings propensity compared to those who are farmers primarily, but also tend to have other occupations. This may be explained as due to a greater need for precautionary savings caused by the lower level of income diversification. Alternatively, it may reflect a more conservative attitude to saving on the part of a population subgroup that is probably more conservative in its attitudes generally. We will say more about this below in our explanation of the multivariate results.
4.3. Propensity to Save and Connectivity
In this section, we directly test our primary hypothesis, which is that savings propensity is positively related to connectivity. We do this by regressing savings propensity on connectivity, along with the various controls that have already been presented in the previous two sections. As far as the control variables are concerned, this section provides a multivariate analysis parallel to the univariate analyses presented above. These multivariate regression analysis results are presented in Table 7. Considering that our dependent variable is the propensity to save, which takes values between zero and one, we recognize the bias in the estimated regressions from an Ordinary Least Squares analysis [34,35]. At the same time, the traditional solutions of probit and logit analysis are inappropriate because the dependent variables are not really measuring underlying binary responses. Extreme value observations are also problematic for various reasons [36]. We therefore apply the fractional response model of Papke and Wooldridge [35,37], using a probit formulation to model the conditional mean of the dependent variable. We also use robust standard errors to adjust for heteroscedasticity, considering that our data is cross-sectional.
The remarks made earlier from univariate analysis seem to bear up, more or less, in a multivariate analysis, as well, but there are some changes in the results. We provide five different specifications to show that our results are robust to alternative specifications; however the comments refer primarily to Model I. Households buying vegetables with higher frequency tend to save more in the multivariate analysis (in contrast to the univariate results where the results were the opposite). More frequent milk purchase is also now connected to more savings, while meat-purchasing frequency is no longer significant. How do we understand the positive relationship between milk- and vegetable-purchasing frequency and savings propensity? As mentioned before, the traditional foods of tribal people in Malkangiri are millets, pulses and rice, seasonal forest fruits, and, on occasion, meat (Malkangiri Gazetteer [12]). A tendency to engage in purchases of non-traditional foods, which are normally consumed by high-status and educated individuals indicates a willingness to look beyond the present [38]. We take these households to represent optimistic attitudes which informs their higher savings propensity [6].
As far as asset ownership is concerned, we note the following patterns. Families owning radios tend to save more, as before, while television ownership is not significant. Motor-vehicle ownership is negatively related to savings propensity, as before. Mobile phone ownership, which had a negative simple correlation with savings propensity is now positively related. If we were to interpret these results in a manner similar to the interpretation for patterns in food consumption, we would expect a positive relationship between all of these assets and savings propensity. On the other hand, television and motor-vehicle purchases represent rather high outlays, and households may judge the tradeoffs against the purchase of other goods to be unwise simply to make a point about optimism regarding the future. We do note that mobile phone ownership, which is a quintessential feature of belonging to the modern world, has a strong positive relationship with savings propensity.
Families with more migrant labor income seem to have lower savings propensities. Migration would expose individuals to modern attitudes and so should encourage saving according to our thesis. On the other hand, migration is usually a sign of lack of alternatives, and even if the migrants, themselves, might be forward-looking, their families back in Malkangiri need not be. Revenue from rice sales is negatively correlated with savings behavior, which reflects our previous result regarding stronger savings propensity for farmers (which in this area primarily means rice farming). This is similar to what we have seen in the univariate analysis. Other work also relates the Indian savings rate to the share of agriculture in the GDP and explains it in terms of the precautionary motive, as we have [4].
Participation in microfinance organizations and loans taken are negatively correlated with bank savings. Since most microfinance organizations provide loans and do not accept deposits, both of these results probably reflect the same phenomenon, which is that households use up savings before taking loans.
What is consistent over all the models is the strong positive relationship between connectivity and savings propensity. This relationship is maintained even after controlling for household income, consumption behavior, and occupational specialization. We may say, tentatively, that there are two effects, one—cultural conservatism (reflected in the stronger savings propensity of farmers) and two—economic optimism, fueled by expectations of high returns from saving and investment. We believe that the relationship between connectivity and savings reflects this economic optimism.
5. Conclusions
Savings propensity is determined by at least two forces in our sample. One force motivates households with a feeling of greater connectivity and optimism to save more. This makes sense if connectivity is a proxy for the ability to use money better in the future. This is consistent with the finding that bigger savers also tend to be those who do not spend on motor vehicles and television sets—all pointing to looking ahead and not consuming today. From an attitudinal point of view, this group declares its forward-looking tendencies by buying mobile phones, and purchasing milk and vegetables more frequently. The second force is cultural and may lead its subjects to save with primarily precautionary motives. This is backed by the finding that households with older heads who are farmers, who obtain most of their income from rice-growing and who obtain a sizeable portion of their household income from migrant labor, also save more. From a policy point of view, though, it is the first force that can be harnessed in the service of higher income growth. Before we proceed to our policy recommendations, we first describe some caveats.
First of all, our sample is small. It is, however, difficult to obtain savings data at the household level. Most of the studies on savings in India are at the national level, using national accounts data. And even household savings studies are rarely conducted in tribal areas, given the difficulty of access and the need for specialized interpreters who speak tribal languages. On the one hand, it is problematic to extrapolate from national account data to household behavior, and on the other, we need information on household savings behavior, since that is what is relevant for policy-making at the local level [5]. Future studies will, hopefully, be able to obtain information from a larger sample of respondents in a larger variety of areas.
Second, our data is cross-sectional. For a study that desires to make policy recommendations, panel data would have been more appropriate. On the other hand, as explained in the introduction, we do have variables that are attitudinal that could—for now—serve as indicators of future behavior.
Third, although we interpret connectivity as measuring optimistic attitudes towards the future, it may well be the case that this variable simply measures the availability of formal financial institutions. As is well-known, savings are positively related to the availability of savings institutions. On the other hand, our interpretation of the data is borne up by parallel results from food consumption and asset ownership, as explained above.
In terms of policy recommendations, first of all, we believe that our results underscore the importance of education. As pointed out by Becker and Mulligan [39], education allows individuals to visualize a different future and to make the future more concrete, and this increases the willingness to save for the future. In our case, education about a changed national and world order where the fortunes of different regions are more intertwined in contrast to the isolation of the past.
Second, the government must improve connectivity in tribal areas, both through improvements in physical infrastructure, and in communications infrastructure, such as cell phones and internet service. Since roads are a public good, it is more difficult for residents of these regions to get together to build the roads themselves. Thus, intervention in the form of government road construction is necessary. Once connectivity is provided, though, markets will be set up by interested parties, or existing broader area markets will be utilized by local rural residents, who previously had no access to these markets. This is an argument that starts with government investment in connectivity and results in greater economic development.
Finally, the willingness to save of local households must be complemented by the provision of training regarding how to run businesses through improved marketing, and improved manufacture at scales larger than production for the immediate region [40,41]. Encouragement of microfinance institutions as well as production, marketing, and financing cooperatives is also indicated [42].
Funding
This research was partly funded by a summer research grant from the Lubin School of Business, Pace University, 1 Pace Plaza, New York, NY 10038, USA.
Institutional Review Board Statement
Not Applicable.
Informed Consent Statement
Not Applicable.
Data Availability Statement
Not Applicable.
Acknowledgments
Most of the work on this paper was done while the author was on sabbatical in early 2017 at the Nabakrushna Choudhury Centre for Developmental Studies (NCDS), Bhubaneshwar, India. He thanks the Centre for the facilities provided to him during his stay there to enable him to finish this study. He also thanks WASSAN for help in conducting the interviews.
Conflicts of Interest
The author declares no conflict of interest.
References
- Wieliczko, B.; Kurdyś-Kujawska, A.; Sompolska-Rzechuła, A. Savings of Small Farms: Their Magnitude, Determinants and Role in Sustainable Development. Example of Poland. Agriculture 2020, 10, 525. [Google Scholar] [CrossRef]
- Rath, B.N.; Bal, D.P. Do FDI and Public Investment Crowd in or Crowd out Private Domestic Investment in India? J. Dev. Areas 2014, 48, 269–284. [Google Scholar] [CrossRef]
- Aryeteey, E.; Udry, C. Saving in Sub-Saharan Africa; Center for International Development at Harvard University Working Paper; publisher: Cambridge, MA, USA, 2000. [Google Scholar]
- Loayza, N.; Shankar, R. Private Saving in India. World Bank Econ. Rev. 2000, 14, 571–594. [Google Scholar] [CrossRef] [Green Version]
- Deaton, A. Saving and Liquidity Constraints. Econometrica 1991, 59, 1221. [Google Scholar] [CrossRef]
- Katona, G. Private Pensions and Individual Saving; Monograph no. 40; Survey Research Center, Institute for Social Research, The University of Michigan: Michigan, MI, USA, 1965. [Google Scholar]
- Katona, G. Consumer Behavior: Theory and Findings on Expectations and Aspirations. Am. Econ. Rev. 1968, 58, 19–30. [Google Scholar]
- Alstadt, B.; Weisbrod, G.; Cutler, D. Relationship of Transportation Access and Connectivity to Local Economic Outcomes: Statistical Analysis. Transp. Res. Rec. J. Transp. Res. Board 2012, 2297, 154–162. [Google Scholar] [CrossRef] [Green Version]
- Sapkota, J.B. Infrastructure Access and Human Development: Cross-Country Evidence and Post-2015 Development Strategies. In JICA-RI Working Paper No. 70; Japan International Cooperation Agency Research Institute: Tokyo, Japan, 2014. Available online: https://www.jica.go.jp/jica-ri/publication/workingpaper/jrft3q00000025be-att/JICA-RI_WP_No.70_2014.pdf (accessed on 19 January 2021).
- Kusharjanto, H.; Kim, D. Infrastructure and human development: The case of Java, Indonesia. J. Asia Pac. Econ. 2011, 16, 111–124. [Google Scholar] [CrossRef]
- Viswanath, P. Microcredit and Survival Microenterprises: The Role of Market Structure. Int. J. Financ. Stud. 2017, 6, 1. [Google Scholar] [CrossRef] [Green Version]
- Odisha District Gazetteers, Malkangiri, Government of Odisha, Bhubaneshwar. 2016.
- Ando, A.; Modigliani, F. The Life-Cycle Hypothesis of Saving: Aggregate Implications and Tests. Am. Econ. Rev. 1963, 53, 55–84. [Google Scholar]
- Friedman, M. A Theory of the Consumption Function; Princeton University Press: Princeton, NJ, USA, 1957. [Google Scholar]
- Shawa, K.C. Drivers of Private Saving in Sub-Saharan African Countries. J. Econ. Dev. 2016, 41, 77–109. [Google Scholar] [CrossRef]
- Deaton, A. Household Saving in LDCs: Credit Markets, Insurance and Welfare. Scand. J. Econ. 1992, 94, 253. [Google Scholar] [CrossRef]
- Rosenzweig, M.R.; Wolpin, K. Credit Market Constraints, Consumption Smoothing and the Accumulation of Durable Production Assets in Low-Income Countries: Investments in Bullocks in India. J. Political Econ. 1993, 101, 223–244. [Google Scholar] [CrossRef]
- Kazianga, H.; Udry, C. Consumption Smoothing? Livestock, Insurance and Drought in Rural Burkina Faso. J. Dev. Econ. 2006, 79, 413–446. [Google Scholar] [CrossRef] [Green Version]
- Kulikov, D.; Paabut, A.; Staehr, K. A Microeconometric Analysis of Household Savings in Estonia: Income, Wealth and Financial Exposure; Working Paper, No.8; Estonian National Bank: Tallinn, Estonia, 2007. [Google Scholar]
- Hubbard, R.G.; Skinner, J.; Zeldes, S.P. Precautionary Saving and Social Insurance. J. Politi-Econ. 1995, 103, 360–399. [Google Scholar] [CrossRef]
- Karlan, D.; Ratan, A.L.; Zinman, J. Savings by and for the Poor: A Research Review and Agenda. Rev. Income Wealth 2014, 60, 36–78. [Google Scholar] [CrossRef] [Green Version]
- Chowa, G.A.; Masa, R.; Ansong, D. Determinants of Saving among Low-Income Individuals in Rural Uganda: Evidence from Assets Africa. Adv. Appl. Sociol. 2012, 2, 280–291. [Google Scholar] [CrossRef] [Green Version]
- Duesenberry, J.S. Income, Saving and the Theory of Consumer Behavior; Harvard University Press: Cambridge, MA, USA, 1949. [Google Scholar]
- Rhee, W. Habit Formation and Precautionary Saving: Evidence from the Korean Household Panel Studies. J. Econ. Dev. 2004, 29, 1–18. [Google Scholar]
- Constantinides, G.M. Habit Formation: A Resolution of the Equity Premium Puzzle. J. Politi-Econ. 1990, 98, 519–543. [Google Scholar] [CrossRef]
- Goedecke, J.; Guérin, I.; D’espallier, B.; Venkatasubramanian, G. Why do financial inclusion policies fail in mobilizing savings from the poor? Lessons from rural South India. Dev. Policy Rev. 2018, 36, O201–O219. [Google Scholar] [CrossRef] [Green Version]
- Carpenter, S.B.; Jensen, R.T. Household Participation in Formal and Informal Savings Mechanisms: Evidence from Pakistan. Rev. Dev. Econ. 2002, 6, 314–328. [Google Scholar] [CrossRef]
- Cheema, A.R.; Saleem, A.; Atif, M. Assessing the Determinants of Savings in Pakistan: An Evidence from PSLM 2010-11. Eur. Online J. Nat. Soc. Sci. 2018, 7, 366–385. [Google Scholar]
- Naik, S. Determinants and Pattern of Saving Behavior in Rural Households of Western Odisha. Master’s Thesis, Department of Humanities and Social Sciences, National Institute of Technology, Rourkela, India, 2013. [Google Scholar]
- Gedela, S.P.R. Determinants of saving behaviour in rural and tribal households (An empirical analysis of Visakhapatnam District). Int. J. Res. Soc. Sci. 2012, 2, 108–128. [Google Scholar]
- Pattanaik, C.H.; Reddy, C.S.; Reddy, P.M. Assessment of spatial and temporal dynamics of tropical forest cover: A case study in Malkangiri district of Orissa, India. J. Geogr. Sci. 2011, 21, 176–192. [Google Scholar] [CrossRef]
- Mahapatra, A.K.; Albers, H.J.; Robinson, E.J. The Impact of NTFP Sales on Rural Households’ Cash Income in India’s Dry Deciduous Forest. Environ. Manag. 2005, 35, 258–265. [Google Scholar] [CrossRef] [PubMed]
- Adnan, K.M.M.; Ying, L.; Ayoub, Z.; Sarker, S.A.; Menhas, R.; Chen, F.; Yu, M. Risk Management Strategies to Cope Catastrophic Risks in Agriculture: The Case of Contract Farming, Diversification and Precautionary Savings. Agriculture 2020, 10, 351. [Google Scholar] [CrossRef]
- Firebaugh, G.; Gibbs, J.P. User’s Guide to Ratio Variables. Am. Sociol. Rev. 1985, 50, 713–722. [Google Scholar] [CrossRef]
- Papke, L.E.; Wooldridge, J.M. Econometric methods for fractional response variables with an application to 401(K) plan participation rates. J. Appl. Econom. 1996, 11, 619–632. [Google Scholar] [CrossRef]
- Gallani, S.; Krishnan, R. Applying the Fractional Response Model to Survey Research in Accounting; Working Paper 16-016; Harvard Business School: Cambridge, MA, USA, 2016. [Google Scholar]
- Papke, L.E.; Wooldridge, J.M. Panel data methods for fractional response variables with an application to test pass rates. J. Econ. 2008, 145, 121–133. [Google Scholar] [CrossRef]
- Access Livelihoods Consulting India Ltd. Value Chain Study for Vegetable Subsector in Malkangiri, Koraput, Rayagada and Nawarangpur Districts of Odisha; Study Commissioned by the Madhyam Foundation on behalf of South Odisha Development Initiative: Bhubaneshwar, India, 2014. [Google Scholar]
- Becker, G.S.; Mulligan, C.B. The Endogenous Determination of Time Preference. Q. J. Econ. 1997, 112, 729–758. [Google Scholar] [CrossRef]
- Ramcharran, H. Bank lending to small business in India: Analyzing productivity and efficiency. Q. Rev. Econ. Financ. 2017, 65, 16–24. [Google Scholar] [CrossRef]
- Banerjee, A.; Breza, E.; Duflo, E.; Kinnan, C. Do Credit Constraints Limit Entrepreneurship? Heterogeneity in the Returns to Microfinance. Global Poverty Research Lab Working Paper No. 17–104. 2017. Available online: https://poseidon01.ssrn.com/delivery.php?ID=339119017068084097076000093126097006099039071063064018087114127025126094088102005098102118004001052027117106101123001006113077109094092045027120072122090071121118087070047024085094009118126121089124079071090027122116026089025118115015065098121090118086EXT=pdfINDEX=TRUE (accessed on 14 January 2021).
- Viswanath, P.V. Microfinance and Investment in Human and Social Capital. ACRN J. Financ. Risk Perspect. 2015, 4, 81–101. Available online: http://www.acrn-journals.eu/resources/jfrp0403f.pdf (accessed on 19 January 2021).
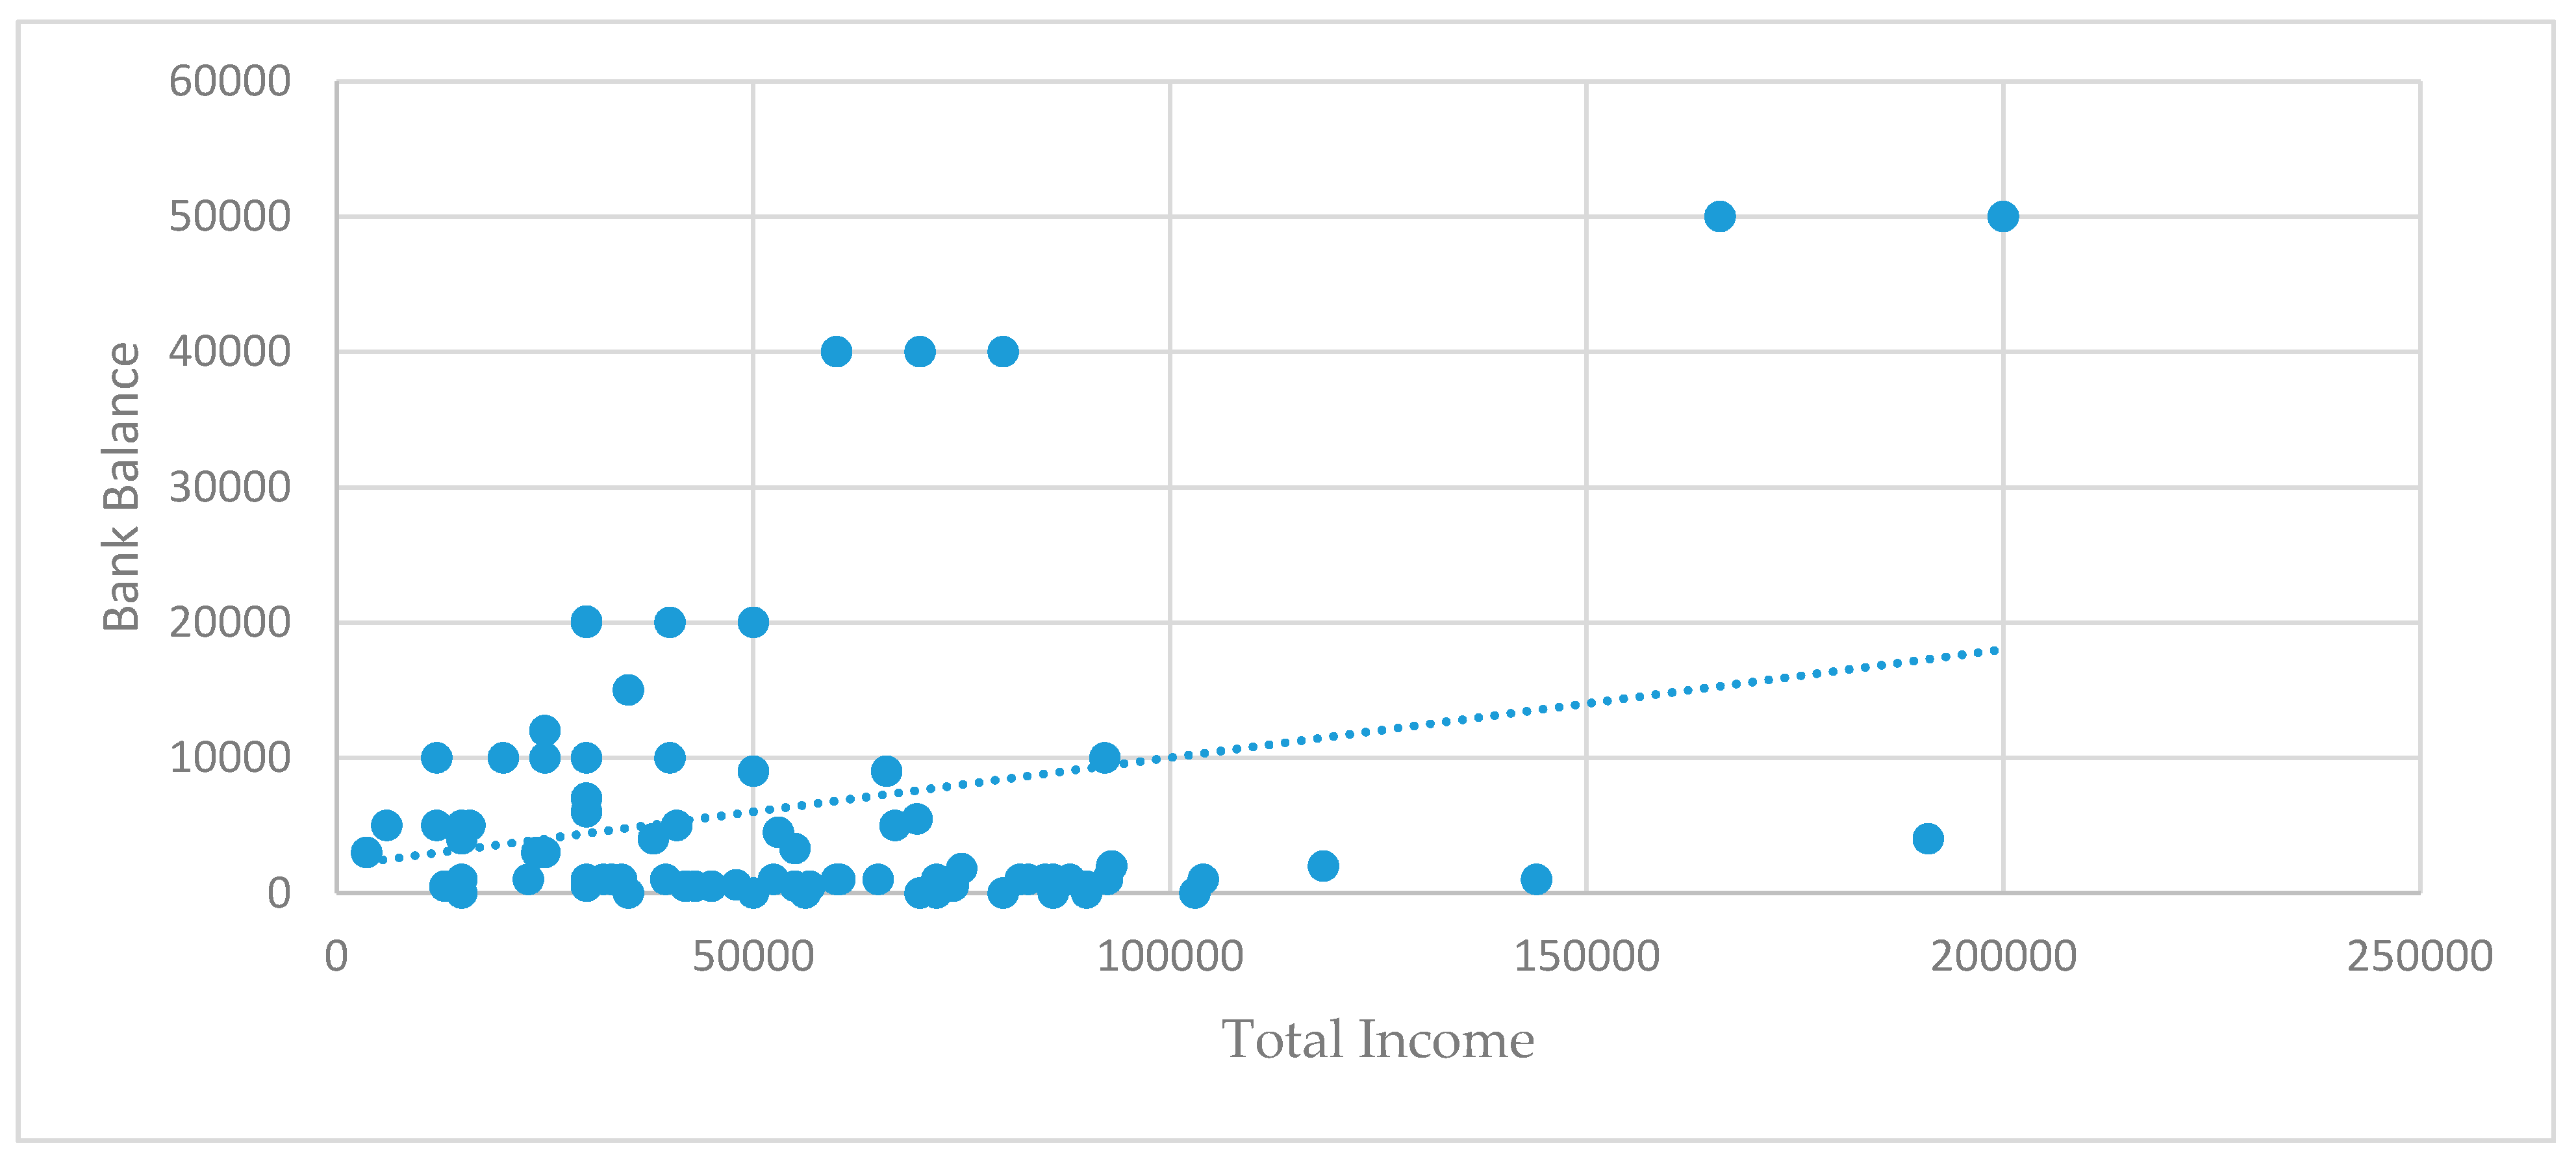
Figure 1.
The relationship between bank balance and total income.

Figure 2.
The relationship between savings propensity and total income.


Table 1.
Descriptions of the seven baskets used for sample selection.
| Basket | Description |
|---|---|
| 1 | Block headquarters and the district HQ are nearby, Gram Panchayats are well-connected to many parts of the district, permanent and weekly markets are available. |
| 2 | Block HQs are nearby, there is good road connectivity, public buses and autos are available, markets are nearby, there are many rural development roads in the villages and within the villages, roads are CC (cement concrete). |
| 3 | Block HQs are nearby, National Highways (NH) are nearby, there are some minimal bus facilities (20-seaters), 75% of the population can access market facilities, and roads can be traversed using jeeps. |
| 4 | Block HQs are not near, 50% of the roads are of good quality, there is no public transportation, but there are bridges over rivers and small vehicles can use the roads. |
| 5 | Gram Panchayats are not close to markets, they are far from block HQs, roads are bad (60% damaged) and distant from NHs. |
| 6 | Gram Panchayats are far from the district HQ and far from NHs; the roads are in bad condition; areas are hilly, but it is possible to travel on foot, although these roads are not passable in the rainy season; locations are far from markets. |
| 7 | Gram Panchayats have no roads, any rivers that exist are non-navigable, they are far from the national highways and they are also far from large cities. |
Table 2.
Households, blocks, Gram Panchayats, villages and interviewers in sample.
| Interviewer | Block | Gram Panchayat | Village | No. of Households |
|---|---|---|---|---|
| Mamta Mahapatra | Korkunda | Sikhapally | Kadal Meta | 8 |
| Mamta Mahapatra | Korkunda | Tumusapaly | Chidipali | 9 |
| Mamta Mahapatra | Korkunda | Tumusapaly | Tumusapaly | 7 |
| Subhalaxmi Das | Kudumulugumma | Parkanamala | Parkhanmalla | 6 |
| Subhalaxmi Das | Kudumulugumma | Parkanamala | Sindhiguda | 2 |
| Kanhu Charan Sahani | Kudumulugumma | Parkanamala | Sindhiguda | 4 |
| Kanhu Charan Sahani | Malkangiri | Pandripani | Pandripani | 6 |
| Kanhu Charan Sahani | Malkangiri | Pandripani | Pujari Mundi | 1 |
| Kanhu Charan Sahani | Malkangiri | Serpali | Rangamatiguda | 4 |
| Jatismaya Biswas | Podia | Kaladapalli | Udayagiri | 8 |
| Jatishmaya Biswas | Kalimela | Nallagunthi | Nallagunthi | 8 |
| Jatishmaya Biswas | Kalimela | Nallagunthi | MV 72 | 7 |
| Jatishmaya Biswas | Kalimela | Maharajpalli | MPV 81 | 8 |
| Jatishmaya Biswas | Kalimela | Maharajpalli | Maharajpalli | 8 |
Table 3.
Primary and secondary occupations of respondents.
| Item | Primary Occupation (% of Total) | Secondary Occupation (% of Total) |
|---|---|---|
| Agriculture | 85.88 | 10.26 |
| NTFP | 01.18 | 39.74 |
| Migratory Labor | 03.53 | 11.54 |
| Petty Trade | 07.06 | 11.54 |
| Office Employment | 01.18 | 01.28 |
| Labor | 01.18 | 21.79 |
| Animal Husbandry and Fishery | 00.00 | 03.85 |
| Total Number of Respondents | 83.00 | 78.00 |
Table 4.
Correlation with savings propensity.
| Item | Correlation | Number of Observations |
|---|---|---|
| Connectivity | 0.4687 * | 76 |
| Past Connectivity | 0.3974 * | 76 |
| Change in Connectivity | −0.1622 | 83 |
| Age of Household Head | 0.2117 * | 83 |
| Total Income of All Family Members | −0.3317 * | 82 |
| Total Income of All Family Members, using components | −0.3544 * | 83 |
| Total Value of Assets Used in Livelihood (other than land) | −0.0916 | 83 |
| Total Bank Balance | 0.5981 * | 83 |
| Total Loans | −0.135 | 83 |
| Total Amount Remitted by Migrant Labor | −0.131 | 83 |
| Total Migrant Labor Income | −0.1696 | 83 |
| Total Migrant Labor Income as Proportion of Total Family Income | −0.2598 * | 83 |
| Total Non-Migrant Labor Income | −0.1528 | 83 |
| Total Salaried Income | −0.0754 | 83 |
| Total Income from Home Occupations | −0.1379 | 83 |
| Total Income from Animal Husbandry | −0.1876 | 83 |
| Total Income from NTFP | −0.2732 * | 83 |
| Total Income from Vegetables | 0.1379 | 83 |
| Total Income from Agriculture | −0.2836 * | 83 |
| Total Income from Livelihoods | −0.0112 | 83 |
| Total Time Spent on Rice Cultivation over Last Twelve Months | −0.0982 | 83 |
| Revenue from Selling Rice in Past Twelve Months | −0.2752 * | 83 |
| Total Land Owned (in acres) | −0.0815 | 83 |
Note: Savings propensity is defined as respondent’s bank balance as a proportion of total income of all family members. Asterisks indicate significance at the 5% level of significance.
Table 5.
Mean of savings propensity for different population subgroups.
| Variable | Yes | No | T-Statistic |
|---|---|---|---|
| Low Caste (Scheduled Tribe/Scheduled Caste) Dummy | 0.1795 | 0.1061 | 0.71 |
| Scheduled Tribe Member (only for low-caste respondents) | 0.1160 | 0.0597 | 0.81 |
| High Meat Purchase Frequency (if daily or weekly) | 0.0596 | 0.1269 | −1.80 |
| High Sugar Purchase Frequency (if daily or weekly) | 0.0967 | 0.0655 | 0.90 |
| High Milk Purchase Frequency (if daily or weekly) | 0.0567 | 0.1371 | −1.51 |
| High Veg Purchase Frequency (if daily or weekly) | 0.0720 | 0.3571 | −3.76 |
| High Fruit Purchase Frequency (if daily or weekly) | 0.0645 | 0.0899 | −0.68 |
| High Bank Balance (Higher than median) | 0.3221 | 0.0137 | 8.31 |
| Dummy for Mobile Phone Ownership | 0.1423 | 0.2702 | −2.25 |
| TV Ownership Dummy | 0.1082 | 0.2297 | −2.25 |
| Radio Ownership Dummy | 0.4007 | 0.1476 | 3.63 |
| Electricity Availability Dummy | 0.1819 | 0.1993 | −0.18 |
| Motor Vehicle Ownership Dummy | 0.0873 | 0.2108 | −1.85 |
| Bicycle Ownership Dummy | 0.1669 | 0.2084 | −0.74 |
| Participation in Microfinance Institutions (MFI) | 0.1057 | 0.1794 | −1.13 |
| Possession of Life, Health, Crop, or Other Insurance | 0.3535 | 0.1281 | 3.60 |
Notes: Savings propensity is defined as proportion of income saved by respondent, specifically respondent’s bank balance as a proportion of total income of all family members. T-statistics is for difference. T-statistic in bold indicate significance in a two-tailed t-test at the 10% level of significance or in a one-tailed t-test at the 5% level of significance.
Table 6.
Savings propensity for occupational subgroups.
| Item | Mean Savings Propensity for Pure Farmers | Mean Savings Propensity for Mixed Farmers | t-Value |
|---|---|---|---|
| Pure farmers and those with secondary occupation in NTFP | 0.4032 (n = 8) | 0.1677 (n = 28) | 2.3569 |
| Pure farmers and those who have migratory jobs as a secondary occupation | 0.4032 (n = 8) | 0.03905 (n = 9) | 4.3728 |
| Pure farmers and those who are shop-owners in a secondary occupation | 0.4032 (n = 8) | 0.0958 (n = 5) | 2.6443 |
| Pure farmers and those who have non-migratory labor as a secondary occupation | 0.4032 (n = 8) | 0.0819 (n = 15) | 4.1452 |
Table 7.
The relationship between propensity to save and respondent characteristics.
| Var./Model | I | II | III | IV | V |
|---|---|---|---|---|---|
| Constant | −3.9773 (−5.47) | −1.9178 (−3.66) | −1.7708 (−2.98) | −1.5776 (−2.87) | −1.6825 (−2.98) |
| Connectivity | 0.3000 (5.21) | 0.323521 (5.60) | 0.3373 (2.43) | 0.1190 (2.79) | 0.3531 (2.95) |
| Income | 5.82 × 10⁻⁶ (2.30) | 5.63 × 10⁻⁶ (2.38) | −3.88 × 10⁻⁶ (−0.75) | −1.37 × 10⁻⁶ (−0.35) | −2.73 × 10⁻⁶ (−0.35) |
| Total Value of Assets Used in Livelihood (other than land) | −8.87 × 10⁻⁶ (−1.49) | ||||
| Revenue from Selling Rice in Past Twelve Months | −1.4446 (−7.30) | −1.3 × 10⁻⁵ (−2.28) | −2.41 × 10⁻⁵ (−2.56) | −1.99 × 10⁻⁵ (−2.84) | −1.74 × 10⁻⁵ (−2.53) |
| High Vegetable Purchase Frequency Dummy (if daily or weekly) | 0.3396 (2.43) | −0.81581 (−1.86) | |||
| High Meat Purchase Frequency Dummy (if daily or weekly) | −0.28126 (−1.70) | 0.047946 (0.33) | |||
| High Milk Purchase Frequency Dummy (if daily or weekly) | 0.31576 (2.02) | −0.2147 (−1.13) | |||
| High Sugar Purchase Frequency Dummy (if daily or weekly) | 1.21 × 10⁻⁶ (0.14) | 0.199971 (1.02) | |||
| Total Loans | −0.4891 (−1.88) | −6.96 ×10⁻⁶ (−0.57) | −3.97 × 10⁻⁵ (−3.38) | −3.94 × 10⁻⁵ (−3.59) | |
| Total Migrant Labor Income as Proportion of Total Family Income | −0.5115 (−3.42) | −0.05769 (−0.18) | −0.4366 (−1.14) | −0.4588 (−1.41) | |
| Dummy for Mobile Phone Ownership | 0.5401 (3.11) | −0.2790 (−1.1) | |||
| TV Ownership Dummy | 0.5828 (1.54) | 0.4131 (1.71) | |||
| Radio Ownership Dummy | 2.7209 (3.32) | 0.4888 (2.12) | |||
| Electricity Availability Dummy | −0.3212 (1.26) | 0.411 (1.36) | |||
| Motor Vehicle Ownership dummy | −0.2901 (−1.94) | −0.5255 (−1.81) | |||
| Participation in MFI | −1.2 × 10⁻⁵ (−2.06) | −0.31986 (−2.25) | −0.8188 (−2.57) | −0.7487 (−2.82) | −0.7703 (−2.96) |
| No. of Observations | 43 | 54 | 64 | 76 | 76 |
| Pseudo R-squared | 0.2264 | 0.1456 | 0.1831 | 0.1516 | 0.1362 |
Note: Results are from a fragmented regression analysis using a probit model for the conditional mean of the dependent variable. Coefficients in bold are significant at the 5% level of significance in a two-tailed t-test. Computed standard errors are robust.
Publisher’s Note: MDPI stays neutral with regard to jurisdictional claims in published maps and institutional affiliations. |
© 2021 by the author. Licensee MDPI, Basel, Switzerland. This article is an open access article distributed under the terms and conditions of the Creative Commons Attribution (CC BY) license (http://creativecommons.org/licenses/by/4.0/).
Share and Cite
MDPI and ACS Style
Viswanath, P.V. Connectivity and Savings Propensity among Odisha Tribals. Sustainability 2021, 13, 968. https://doi.org/10.3390/su13020968
AMA Style
Viswanath PV. Connectivity and Savings Propensity among Odisha Tribals. Sustainability. 2021; 13(2):968. https://doi.org/10.3390/su13020968
Chicago/Turabian StyleViswanath, P.V. 2021. "Connectivity and Savings Propensity among Odisha Tribals" Sustainability 13, no. 2: 968. https://doi.org/10.3390/su13020968
Note that from the first issue of 2016, this journal uses article numbers instead of page numbers. See further details here.