
This Year, Half as Many Metro Areas Are Affordable to Low-Income Homebuyers as Last Year
Surging home prices have made it even more difficult for millions of renters to become homeowners across the US. In nearly half of the largest 100 US metro areas, the income needed to afford a home last year isn’t enough to afford one this year. As home prices continue to surge, low-income households already on the margins of home affordability are on the verge of being completely priced out of homeownership in most major US metro areas.
To estimate how many likely first-time homebuyers were priced out of homeownership, I examined what area median income level was needed to afford a modest-priced home in each of the top 100 metro areas in June of 2021 compared to June of 2020, and then how many renters aged 25-55 were in that group in each time period. We define affordable as having total monthly owner costs, including property taxes and insurance, of no more than 31 percent of monthly income. Based on the maximum affordable purchase price we calculate a 30-year fixed rate mortgage assuming the historical average 4 percent interest rate, a 3.5 percent downpayment, and 1.5 percent closing cost.
We assume households can afford a home in their metro if the maximum purchase price is equal to or above 80 percent of the metro median home price. By June 2021, extremely-and -very low-income households with under 30 percent AMI, and between 30-50 percent AMI respectively, could not afford the median-priced home in any of the 100 largest US metro areas, and in only 20 metros were homes affordable for low-income households with incomes between 50-80 percent of AMI (Figure 1). Ultimately, 13.4 million likely first-time homebuyers (67 percent) in the top 100 metros could not afford the median-priced home in their metro.
Figure 1. Count of Metro Areas Where Likely First-Time Homebuyers Can Afford a Modest Priced Home by AMI Level, 2020-2021
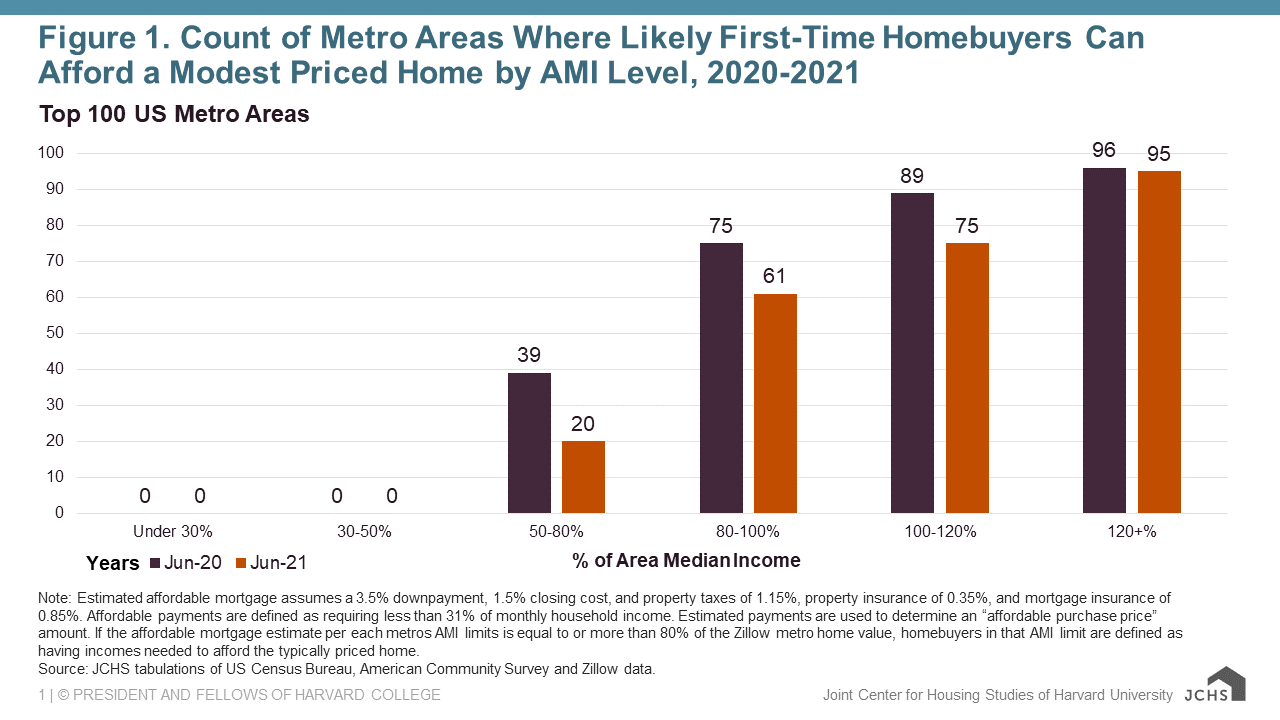
Note: Estimated affordable mortgage assumes a 3.5% downpayment, 1.5% closing cost, and property taxes of 1.15%, property insurance of 0.35%, and mortgage insurance of 0.85%. Affordable payments are defined as requiring less than 31% of monthly household income. Estimated payments are used to determine an “affordable purchase price” amount. If the affordable mortgage estimate per each metros AMI limits is equal to or more than 80% of the Zillow metro home value, homebuyers in that AMI limit are defined as having incomes needed to afford the typically priced home.
Source: JCHS tabulations of US Census Bureau, American Community Survey and Zillow data.
While households across all AMI levels are impacted by increasing home prices, low-income households with incomes between 50-80 percent of AMI are most at risk of being priced out of affordable homeownership. Last year among the top 100 metros, there were 39 metros where low-income households with incomes between 50-80 percent of AMI could afford a home; today there are only 20, representing close to a 50 percent decline. Historically, many metro areas known for their affordability were mid-to-large sized Southern and Midwestern cities. However, as home prices continue to increase, homeownership in these metros is becoming even more unaffordable. For example, in Birmingham, Detroit, and Indianapolis, low-income households within 50-80 percent of AMI can no longer afford the median priced home although they could just last year.
Further compounding these challenges is that even when low-to-moderate income buyers can afford to purchase a home, intense homebuying competition has locked many who rely on FHA and VA loans out of homeownership. Many low-to-moderate income and Black homebuyers rely on FHA home loans which have more flexible downpayment and credit requirements. According to the Urban Institute, 38 percent of Black homebuyers used FHA loans in 2019, while just 16 percent of white homebuyers did. Because of strong housing demand sellers have many options of who they can sell their homes to, and many prefer buyers who can pay upfront in cash or have conventional loans that allow them to forgo a home inspection, unlike FHA and VA loans.
In order to preserve affordable homeownership for millions of households, policies that build more affordable housing and targeted downpayment assistance to Black households, who already have large homeownership gaps, must play a key role. By the end of 2020, there was a 3.8 million unit housing supply shortage which has helped fuel home price surges. The Biden administration’s American Jobs Plan seeks to build, preserve, and retrofit more than two million homes to address affordable housing challenges. This expansion could make significant progress to increase the housing supply as a means to moderately slow home price growth. Also, in some cities additional downpayment assistance funds have helped FHA borrowers overcome homebuying challenges and close on homes. If passed through Congress, the Downpayment Toward Equity Act of 2021 would establish a grant program of up to $25,000 to assist first-generation homebuyers.
While current downpayment assistance programs target assistance by income or first-time homebuyer status, given large homeownership gaps by race that have been driven by systemic racism including redlining and predatory lending, the Biden administration may also consider employing the Equal Credit Opportunity Act (ECOA) and the exemptions provided through its Special Purpose Credit Program (SPCP), which allows lenders to favorably consider prohibited factors such as race or ethnicity in connection with a special purpose that may include initiatives for “low-income borrowers of color.”
As homeownership affordability declines across the country, policies that increase the housing supply and target housing assistance to low-income and Black households will be critical in preserving homeownership as an option for millions of households.
Metros Where Low-Income (50-80% AMI) Households Could Purchase a Modest Priced Home, 2020-2021
| Metro | Affordable Purchase Price for 50-80% AMI |
80% of Median Home Price, June 2020 | Diff b/t Affordable Purchase Price-Home Price, 2020 |
80% of Median Home Price, June 2021 | Diff b/t Affordable Purchase Price-Home Price, 2021 |
|---|---|---|---|---|---|
| Akron, OH | $154,878 | $128,163 | $26,715 | $145,084 | $9,794 |
| Albany, NY | $201,664 | $167,751 | $33,913 | $191,880 | $9,784 |
| Allentown, PA-NJ | $181,498 | $176,804 | $4,694 | $209,781 | ($28,283) |
| Augusta, GA | $137,132 | $129,592 | $7,540 | $146,844 | ($9,712) |
| Baton Rouge, LA | $163,469 | $154,130 | $9,339 | $162,938 | $531 |
| Birmingham-Hoover, AL | $153,265 | $143,090 | $10,175 | $160,542 | ($7,277) |
| Buffalo, NY | $161,331 | $143,580 | $17,751 | $173,058 | ($11,727) |
| Chicago, IL | $201,664 | $196,450 | $5,214 | $220,562 | ($18,898) |
| Cincinnati, OH-KY-IN | $181,498 | $156,018 | $25,480 | $180,105 | $1,393 |
| Cleveland-Elyria, OH | $161,331 | $131,491 | $29,840 | $153,877 | $7,454 |
| Columbia, SC | $159,920 | $133,393 | $26,527 | $150,614 | $9,306 |
| Columbus, OH | $181,498 | $177,083 | $4,415 | $203,523 | ($22,025) |
| Dayton, OH | $165,364 | $114,236 | $51,128 | $132,538 | $32,826 |
| Des Moines, IA | $181,498 | $167,186 | $14,312 | $184,617 | ($3,119) |
| Detroit, MI | $170,608 | $149,951 | $20,657 | $173,530 | ($2,922) |
| El Paso, TX | $134,308 | $111,332 | $22,976 | $130,098 | $4,210 |
| Greensboro-High Point, NC | $137,132 | $131,919 | $5,213 | $151,624 | ($14,492) |
| Harrisburg-Carlisle, PA | $168,188 | $157,546 | $10,642 | $177,373 | ($9,185) |
| Hartford, CT | $209,327 | $194,799 | $14,528 | $227,653 | ($18,326) |
| Houston, TX | $181,498 | $179,398 | $2,100 | $202,151 | ($20,653) |
| Indianapolis, IN | $173,431 | $153,646 | $19,785 | $178,328 | ($4,897) |
| Jackson, MS | $144,391 | $115,979 | $28,412 | $130,019 | $14,372 |
| Kansas City, MO-KS | $185,531 | $169,736 | $15,795 | $197,483 | ($11,952) |
| Little Rock, AR | $153,265 | $125,162 | $28,103 | $137,095 | $16,170 |
| Louisville, KY | $159,315 | $149,558 | $9,757 | $168,853 | ($9,538) |
| McAllen, TX | $118,578 | $99,241 | $19,337 | $110,619 | $7,959 |
| Memphis, TN-MS-AR | $141,165 | $131,474 | $9,691 | $152,004 | ($10,839) |
| Milwaukee, WI | $171,818 | $167,658 | $4,160 | $194,885 | ($23,067) |
| Oklahoma City, OK | $163,767 | $131,471 | $32,296 | $145,926 | $17,841 |
| Omaha, NE | $185,531 | $165,299 | $20,232 | $188,761 | ($3,230) |
| Pittsburgh, PA | $169,801 | $132,702 | $37,099 | $155,582 | $14,219 |
| Rochester, NY | $161,331 | $130,891 | $30,440 | $151,671 | $9,660 |
| Scranton, PA | $145,198 | $99,668 | $45,530 | $116,786 | $28,412 |
| St. Louis, MO-IL | $178,271 | $148,874 | $29,397 | $171,176 | $7,095 |
| Syracuse, NY | $165,364 | $121,958 | $43,406 | $139,055 | $26,309 |
| Toledo, OH | $150,845 | $104,546 | $46,299 | $119,222 | $31,623 |
| Tulsa, OK | $156,491 | $123,942 | $32,549 | $139,291 | $17,200 |
| Wichita, KS | $149,635 | $117,954 | $31,681 | $132,007 | $17,628 |
| Winston-Salem, NC | $141,165 | $131,351 | $9,814 | $152,209 | ($11,044) |
Note: Metro affordability is estimated using 2019 ACS income data and 30-year fixed rate mortgage assumptions. Zillow home value data is compared to affordable purchase price estimates to determine affordability. Metros highlighted in orange are no longer affordable for low-income homebuyers.
Source: JCHS tabulations of US Census Bureau, American Community Survey and Zillow data.