Global Trends of Forest Loss Due to Fire From 2001 to 2019
 Alexandra Tyukavina1*
  Peter Potapov1
  Matthew C. Hansen1
  Amy H. Pickens1
  Stephen V. Stehman2 Svetlana Turubanova1 Diana Parker1 Viviana Zalles1 André Lima1
  Indrani Kommareddy1
  Xiao-Peng Song3
  Lei Wang4
  Nancy Harris5
- 1Department of Geographical Sciences, University of Maryland, College Park, MD, United States
- 2College of Environmental Science and Forestry, State University of New York, Syracuse, NY, United States
- 3Department of Geosciences, Texas Tech University, Lubbock, TX, United States
- 4State Key Laboratory of Remote Sensing Science, Aerospace Information Research Institute, Chinese Academy of Sciences, Beijing, China
- 5World Resources Institute, Washington, DC, United States
Forest fires contribute to global greenhouse gas emissions and can negatively affect public health, economic activity, and provision of ecosystem services. In boreal forests, fires are a part of the ecosystem dynamics, while in the humid tropics, fires are largely human-induced and lead to forest degradation. Studies have shown changing fire dynamics across the globe due to both climate and land use change. However, global trends in fire-related forest loss remain uncertain due to the lack of a globally consistent methodology applied to high spatial resolution data. Here, we create the first global 30-m resolution satellite-based map of annual forest loss due to fire. When producing this map, we match the mapped area of forest loss due to fire to the reference area obtained using a sample-based unbiased estimator, thus enabling map-based area reporting and trend analysis. We find an increasing global trend in forest loss due to fire from 2001 to 2019, driven by near-uniform increases across the tropics, subtropical, and temperate Australia, and boreal Eurasia. The results quantify the increasing threat of fires to remaining forests globally and may improve modeling of future forest fire loss rates under various climate change and development scenarios.
Introduction
Increasing global temperatures and more prolonged and severe droughts over the past decades are creating favorable wildfire conditions (Jolly et al., 2015). Fire season severity and length are projected to increase throughout the globe by the end of the century, most notably in the northern high latitudes (Flannigan et al., 2013). Humans directly affect fire regimes through fire suppression and novel ignition patterns from urban and agricultural encroachment (Moritz et al., 2014). At the same time, human activities resulting in forest fragmentation (Pütz et al., 2014; Potapov et al., 2017; Hansen et al., 2020) and degradation (Ghazoul et al., 2015) reduce the resilience of forests to fire (Cochrane, 2003; Broadbent et al., 2008; Xu et al., 2020). This complex interaction of socioecological factors is creating regional variations in trends of forest fire severity and frequency (Moritz et al., 2014; Andela et al., 2017). These regional changes are likely to alter the global climate through biophysical feedbacks, although the potential magnitude and direction of these long-term changes remain uncertain (Liu et al., 2019; Walker et al., 2019).
In recent years, extreme wildfire events in Brazil, Australia (Boer et al., 2020), and California have once again attracted public attention to the issue. However, especially in the case of Amazonian fires (Cardil et al., 2020), there was no clear information on what exactly was burning: forests or previously deforested areas that had been converted to pasture and cropland. Active fire data obtained from the Visible Infrared Imaging Radiometer Suite (VIIRS) and Moderate Resolution Imaging Spectroradiometer (MODIS) sensors provide near-real-time information on forest fires (Schroeder et al., 2014; Giglio et al., 2016), but the coarse spatial resolution of the data (375 m for VIIRS and 1 km for MODIS) does not enable confident discrimination of forest and non-forest fires close to forest edges. This issue is particularly significant for deforested landscapes, where relatively small patches of the remaining forests are intertwined with areas previously cleared for agriculture. Examples of such landscapes are “fishbone” forest clearing by settlers in the Brazilian Amazon and slash-and-burn farming areas throughout the tropics. Higher spatial resolution data distinguishing between forest and non-forest fires in these deforested landscapes would inform land use decisions and policy changes aimed to preserve primary forest remnants.
Existing global burned area maps (Andela et al., 2019; Giglio et al., 2018; Lizundia-Loiola et al., 2020) have a coarse resolution of 250–500 m and do not distinguish between forest fires resulting in tree cover loss (stand-replacement fires) and those that do not (non–stand-replacement fires). The Food and Agriculture Organization of the United Nations (FAO) Forest Resources Assessment (FRA) 2020 (FAO, 2020) has reported a regional total of “tree cover area burned” by intersecting a 500-m resolution burned area map (Giglio et al., 2018) with the year 2000 global 30-m tree cover map by Hansen et al. (2013). This approach includes the area of seasonal non–stand-replacement forest fires and area of slash-and-burn agriculture (where fires are ignited after the trees are cut down) together with stand-replacement fires. Eastern and Southern Africa and Western and Central Africa are thus highlighted in the 2020 FRA as two major regions of “tree cover area burned,” even though most fires in these regions occur in fire-adapted parkland and woodland savannas with little or no tree mortality. Such reporting is misleading from the carbon accounting perspective and obscures potential increases in tree cover loss due to fire in the areas where forest fires rarely occur, such as tropical rainforests (Cochrane, 2003). Other global assessments report the area of stand-replacement forest fires by combining 500-m burned area maps (Giglio et al., 2018) with 30-m resolution global forest loss data (Hansen et al., 2013) aggregated to 500 m to match the burned area data (Liu et al., 2019) or by relying on country-reported statistics (van Lierop et al., 2015), with both approaches affected by inconsistencies in input data resolutions and definitions. Existing high spatial resolution (≤30 m) regional- and national-scale remote sensing studies of stand-replacement forest fires are mostly focused on the temperate and boreal forests of North America and Eurasia (Krylov et al., 2014; Harvey et al., 2016; Guindon et al., 2018; Huo et al., 2019; Schleeweis et al., 2020). No high-resolution global satellite-based assessment of forest loss due to fire employing consistent definitions and methods across biomes has been available to date.
The current study fills this global information gap by producing a map of forest loss due to fire for 2001–2019 (Figure 1), adding to the suite of global 30-m forest cover monitoring products (Hansen et al., 2013), updated annually as a part of the Global Forest Watch initiative (https://www.globalforestwatch.org/). By limiting the area of interest of our loss due to fire map to within the spatial extent of forest loss mapped by Hansen et al. (2013), we have excluded low-intensity and understory forest fires that do not result in substantial tree canopy loss at the scale of a 30-m pixel. Fires within recent forest loss due to other drivers are also excluded. For example, we did not include burning of felled logs following mechanical canopy removal, which is common in slash-and-burn agriculture and large-scale deforestation, into our definition of forest loss due to fire. Forest loss due to fire was mapped using global Landsat-based annual change detection metrics for 2001–2019 (Potapov et al., 2020) as input data to a set of regionally calibrated classification tree ensemble models (see Methods for more details and Figure 2A for model region boundaries). Consistent with the global forest loss map (Hansen et al., 2013), we have mapped only the first stand-replacement forest disturbance for each pixel between 2001 and 2019. Therefore, areas of forest loss due to fire that occurred when forest regrowth followed an initial disturbance early in the study period have not been detected in the current analysis. The result of the mapping process can be viewed as a set of binary maps (forest loss due to fire vs. other drivers), each identified by the choice of a boundary between the two classes based on a continuous output from a decision tree. No further change in these maps occurs in the remainder of the methodology.
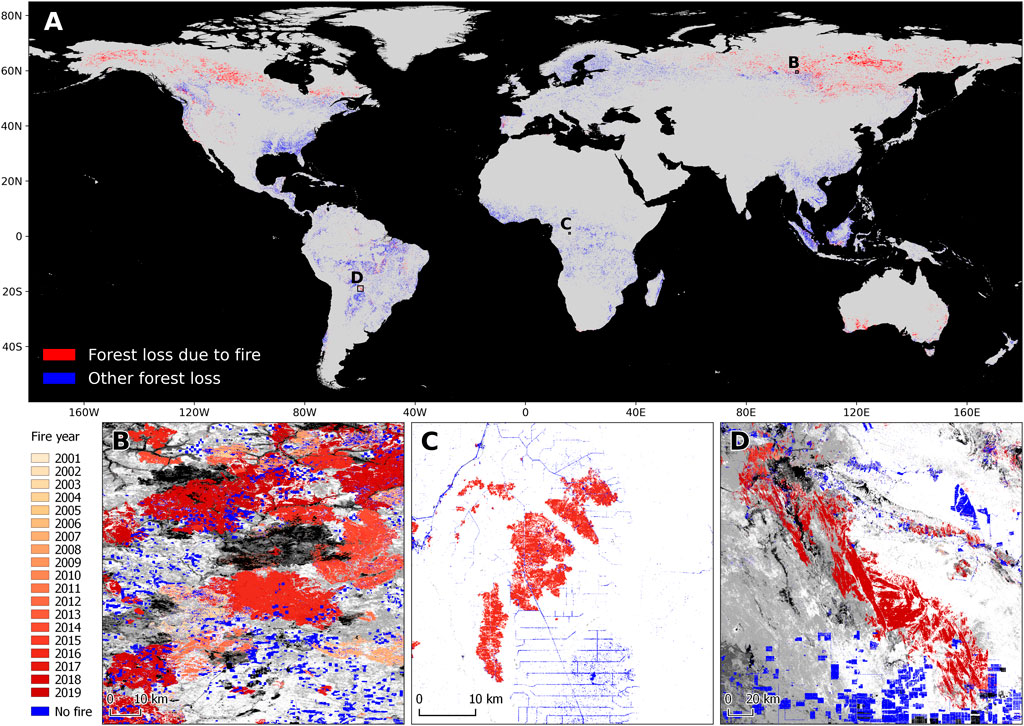
FIGURE 1. Global disaggregation of 2001–2019 Hansen et al. (2013) 30-m forest loss map into forest loss due to fire vs. other direct drivers of loss (A) and examples of the annual maps of forest loss due to fire: (B) mosaic of annual fires and clear-cuts in the boreal forests of Krasnoyarsk region, Russia; (C) 2016 fire in a region of selective logging in the humid tropical forest in northern Republic of the Congo; (D) 2019 fire in dry tropical forests of Bolivia. Year of forest loss due to fire is from Hansen et al.(2013) with annual updates. The map area shown as forest loss due to fire matches the sample-based area estimate at the regional level (see Materials and Methods for details). The grayscale background image is year 2000 % tree cover with black corresponding to 0% and white to 100% tree cover. The global forest loss due to fire map within the entire extent of the global forest loss map by Hansen et al.(2013) is available at https://glad.umd.edu/dataset/Fire_GFL/.
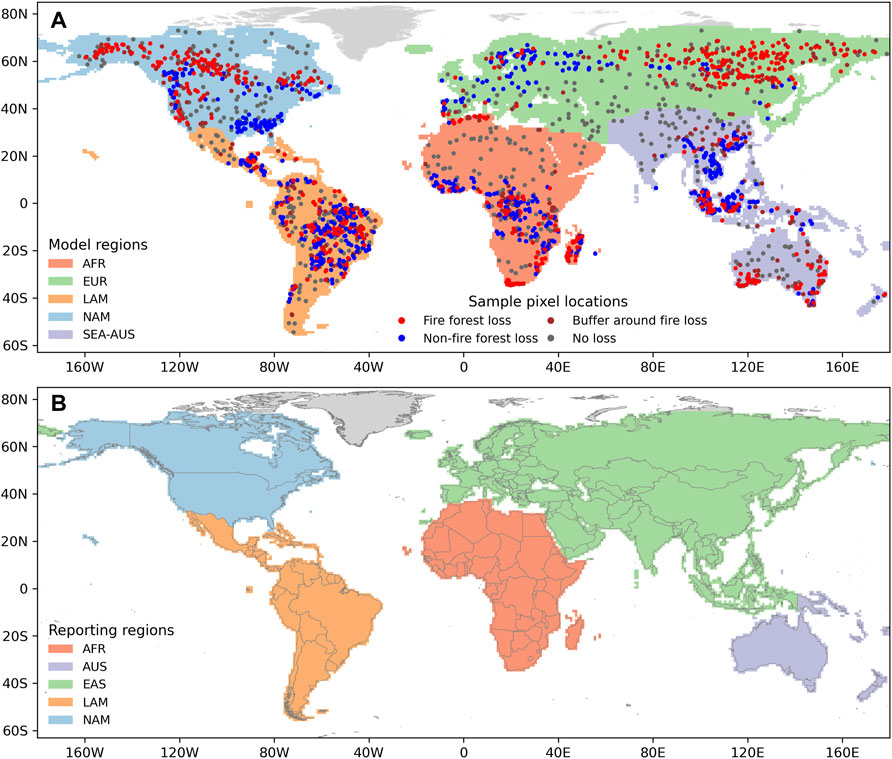
FIGURE 2. Study regions and sample pixel locations. (A) Mapping and accuracy assessment regions with sample pixel locations; (B) reporting regions. Sample pixels are colored by stratum presented in Table 2. AFR: Africa, AUS: Australia and Oceania, EUR: Northern Eurasia, EAS: Eurasia, LAM: Latin America, NAM: North America, and SEA-AUS: combined South and Southeast Asia, and Australia and Oceania.
Following the initial mapping, the sample-based unbiased estimators of the total area of forest loss due to fire for each model region from 2001–2019 were obtained based on the interpretation of satellite imagery for a probability sample of pixels (Olofsson et al., 2014). These area estimates were used to select each regional map from a set of existing binary candidate maps such that at the regional level, the map-based area of forest loss due to fire (derived by counting pixels of the map) matches the sample-based area estimate (Figure 3; Table 3). We incorporated sampling variability (±standard error) into the map selection protocol for all regions except Africa (Figure 4), which allows us to produce sub-regional map-based area estimates (e.g., for climate domains or countries) with a measure of uncertainty. Using the sample data, we also evaluated the direction of temporal trends in the mapped area of forest loss due to fire at the regional scale (Figure 5) and year agreement for the individual sample pixels (Figure 6).
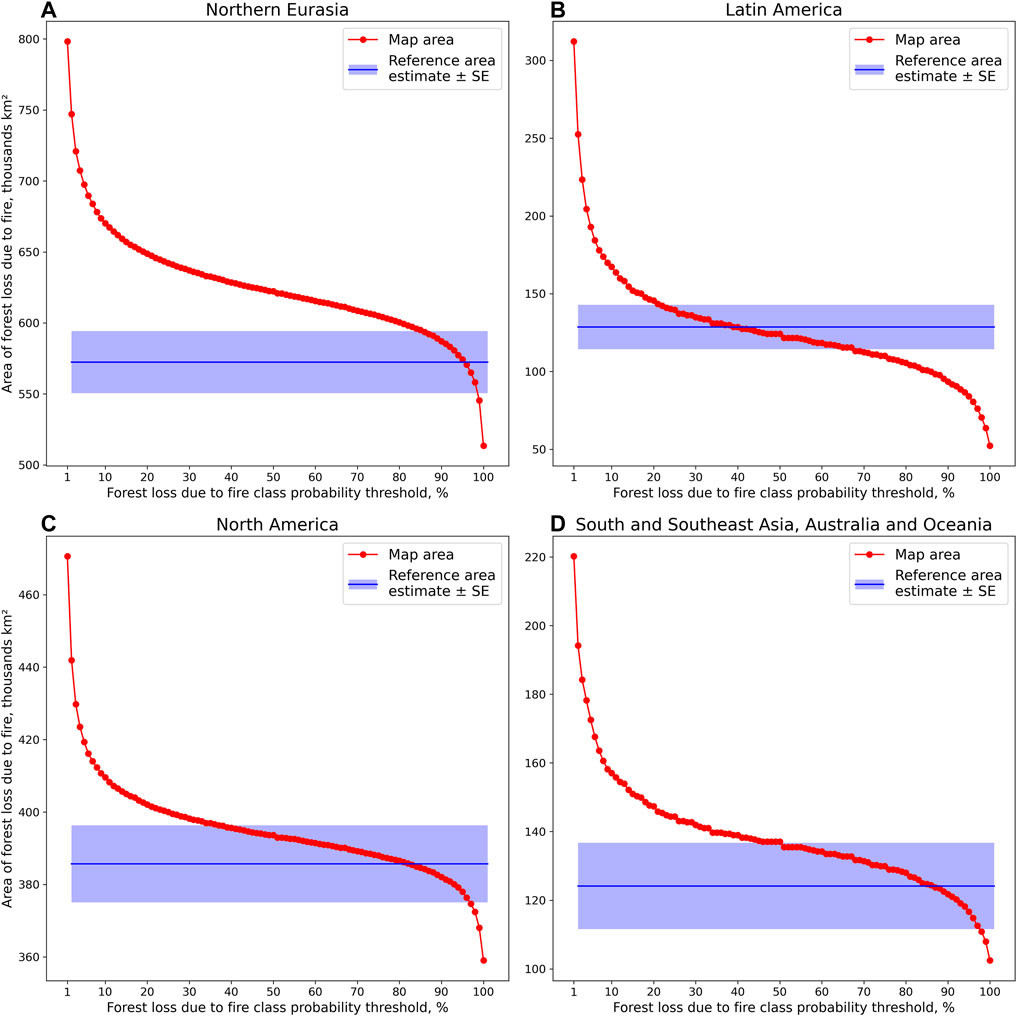
FIGURE 3. Map area of forest loss due to fire for all possible integer fire probability thresholds ≥X% (red), and reference estimate of fire disturbance area within forest loss strata ± SE, derived from a sample (blue). Africa is not shown since the only forest loss due to fire probability thresholds present in a map were 0 and 100%, and hence, only one candidate map was available. Region boundaries are presented in Figure 2A.
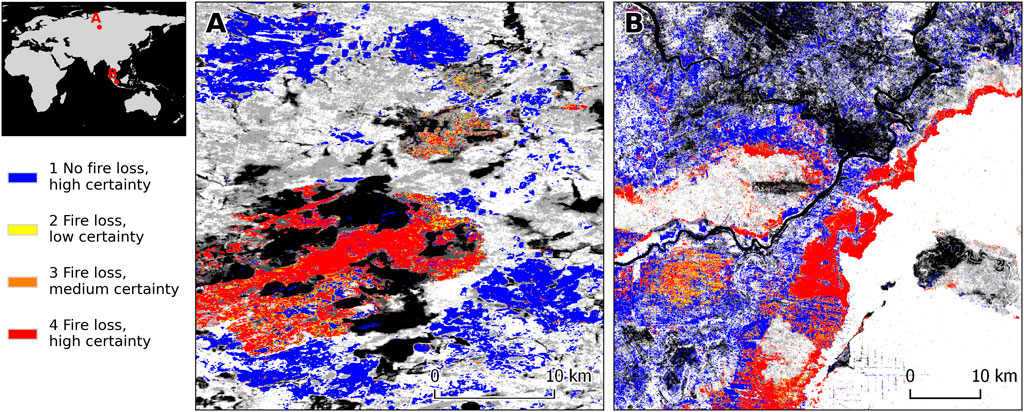
FIGURE 4. Example of areas with patches of low and medium certainty of mapped forest loss due to fire: (A) Tomsk region, Russia, confusion with silk moth damage; (B) Sumatra, Indonesia, confusion with burning on land cleared for large-scale industrial agriculture. Map codes 3 + 4 correspond to the sample estimate of the area of forest loss due to fire, code 4 to the sample area estimate minus one SE, and codes 2 + 3 + 4 to the sample estimate plus one SE. Grayscale background image is year 2000 % tree cover with black corresponding to 0% and white to 100% tree cover.
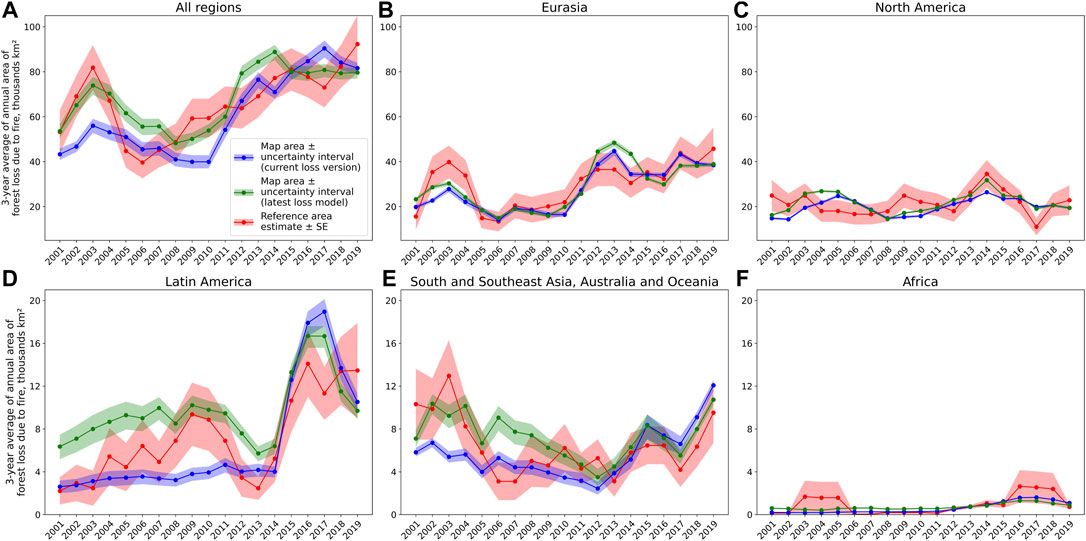
FIGURE 5. Annual area of forest loss due to fire (3-year averages) from the map (blue and green) and from the reference sample (red) for (A) all regions; (B) Northern Eurasia; (C) North America; (D) Latin America; (E) combined South and Southeast Asia, and Australia and Oceania; (F) Africa. Blue line corresponds to the forests loss due to fire model applied annually within the current version (1.7) of Hansen et al.(2013) forest loss map; green corresponds to the fire model applied to the prototype of the new global forest loss map, derived by applying the latest annual forest loss model to all years starting from 2001. Map estimates are within the global forest loss map and year 2000 tree cover >0% (Hansen et al., 2013); sample-based estimates are for all strata (within the entire land area). Error bands for the sample-based area estimates represent ±SE, and error bands for the map-based estimates represent the uncertainty interval from the sample-matched map. Region boundaries are presented in Figure 2A.
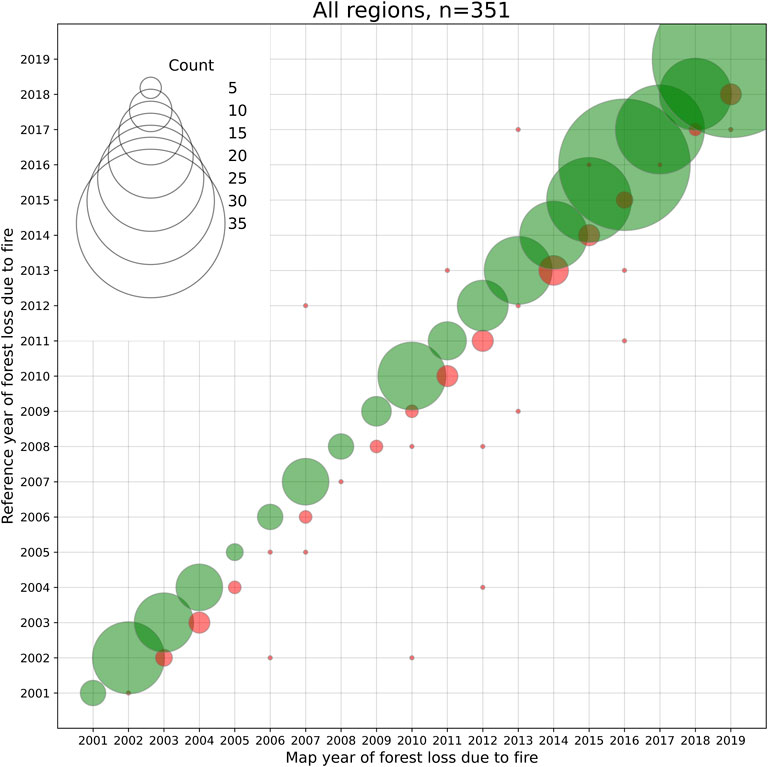
FIGURE 6. Year of forest loss due to fire from the map and from the reference sample interpretation for the sample pixels identified as forest loss due to fire in both the map and the reference interpretation. Green corresponds to year agreement and red to disagreement.
We report the annual estimates of the forest loss due to fire areas and their trend between 2001 and 2019 globally and by the climate domain (Table 1; Figure 8, Supplementary Table S1) within each region/continent (Supplementary Table S2, Figures 7, 8), and by country (Supplementary Table S4, Figure 10). Additionally, we analyze forest loss due to fire trends separately in tropical primary forests (Supplementary Table S2, Figure 9), which have high biodiversity and ecosystem service value. All results presented (Figures 7–10; Table 1, Supplementary Tables S1–S4) are based on our new map selected to match the sample-based area estimate. Map-based areas of forest loss due to fire are reported within the joint extent of mapped tree cover in 2000 and forest loss from 2001 to 2019 (Hansen et al., 2013), thus representing the first stand-replacement forest loss due to fire within forests established by the year 2000. Based on the reference probability sample, an estimated 8% of the global area of forest loss due to fire has been omitted by this version of our new map (Table 4). Consequently, our reported map-based estimates of forest loss due to fire are conservative. Additional discussion of map versions and their accuracy is presented in Materials and Methods.
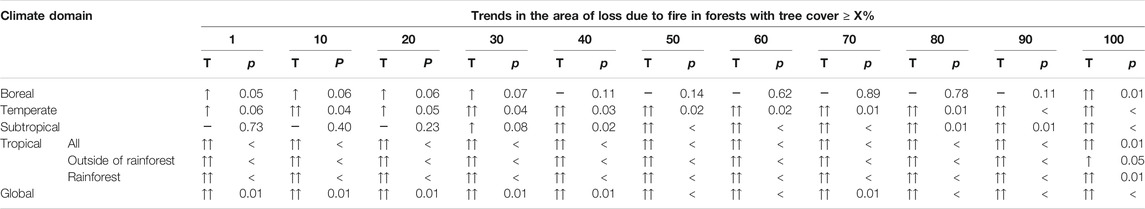
TABLE 1. Trends in the area of forest loss due to fire when forests are defined using different % tree cover thresholds. T signifies trend direction (two-sided Mann–Kendall test, with significance level set at α = 0.05 and 0.10) and p stands for p-value. Two upward arrows signify increasing trend with α = 0.05; one upward arrow signifies increasing trend with α = 0.10; dash indicates no statistically significant trend (α = 0.10); and less-than (<) indicates a p-value < 0.01. Climate domains and a tropical rainforest ecoregion are from the FAO Global Ecological Zones 2010 (FAO, 2012). The % tree cover for the year 2000 is from Hansen et al.(2013).
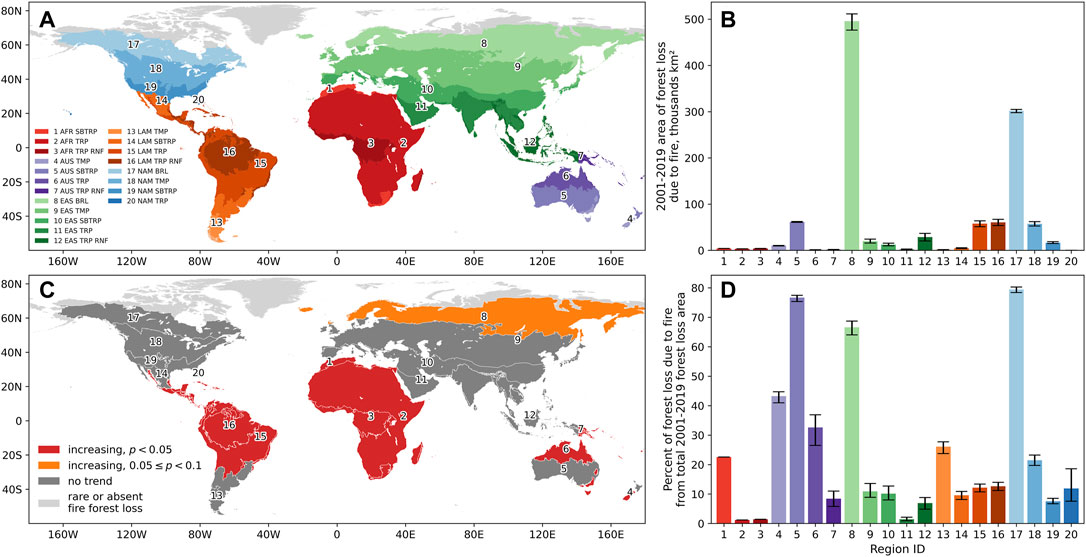
FIGURE 7. Forest loss due to fire between 2000 and 2019 in (A) climate domains and regions: (B) total area; (C) annual area trend (two-sided Mann–Kendall test, with significance level set at α = 0.05 and 0.10, regions with mean annual area of forest loss due to fire <10 km2/yr. are excluded from trend analysis); (D) area of forest loss due to fire as percent of total 2001–2019 forest loss area from the Hansen et al.(2013) map. Area estimates and uncertainty intervals are map-based, within the joint extent of mapped tree cover in 2000 and forest loss from 2001 to 2019 (Hansen et al., 2013). AFR: Africa, AUS: Australia and Oceania, EAS: Eurasia, LAM: Latin America, and NAM: North America. Climate domains are the following aggregations of climate domains and a tropical rainforest ecoregion from the FAO Global Ecological Zones 2010 (FAO, 2012): BRL: boreal, TMP: temperate, SBTRP: subtropical, TRP: tropical outside of rainforests, TRP RNF: tropical rainforests. Regions are labeled with their numeric IDs from (A) in (B–D). Data are available in Supplementary Table S2.
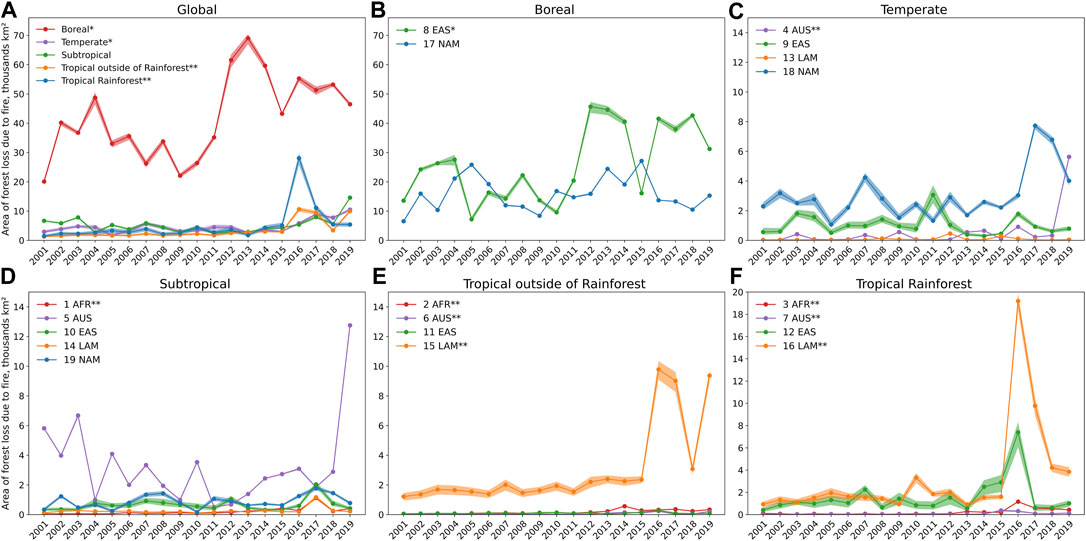
FIGURE 8. Annual area of forest loss due to fire by climate domain globally (A) and by region (B–F). Climate domains and a tropical rainforest ecoregion are from the FAO Global Ecological Zones 2010 (FAO, 2012). AFR: Africa, AUS: Australia and Oceania, EAS: Eurasia, LAM: Latin America, and NAM: North America. Region boundaries are presented in Figure 2B. Area estimates and uncertainty intervals are map-based, within the joint extent of mapped tree cover in 2000 and forest loss from 2001 to 2019 (Hansen et al., 2013). Data are available in Supplementary Tables S1, S2. Regions with statistically significant increasing trend of forest loss due to fire are marked with ** (Mann–Kendall test, p < 0.05) and * (0.05 ≤ p < 0.10).
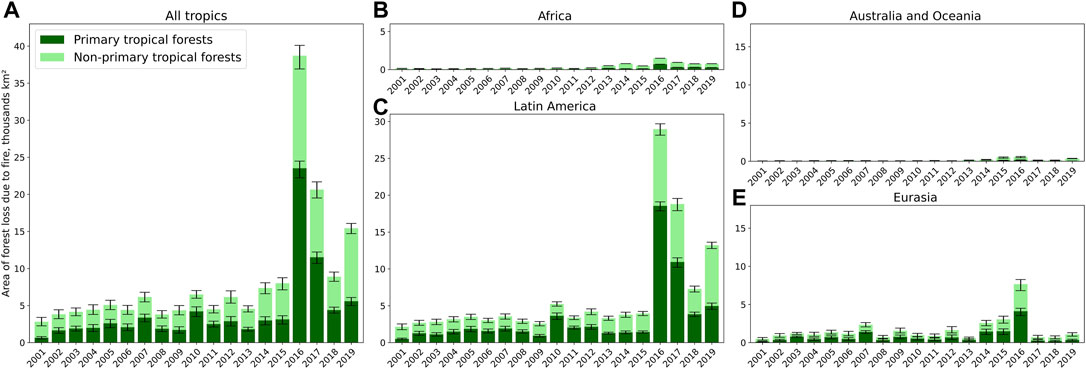
FIGURE 9. Annual area of forest loss due to fire in primary vs. non–primary tropical forests in (A) all tropics; (B) Africa; (C) Latin America; (D) Australia and Oceania; (E) Eurasia. Area estimates and uncertainty intervals are map-based, within the joint extent of mapped tree cover in 2000 and forest loss from 2001 to 2019 (Hansen et al., 2013). Primary forests are defined using the map of Turubanova et al. (2018). Tropical climate domain boundaries are from FAO Global Ecological Zones 2010 (FAO, 2012). Region boundaries are presented in Figure 2B. Data are available in Supplementary Table S3. Primary and non–primary tropical forests of all regions exhibit increasing trends of forest loss due to fire (Mann–Kendall test, p < 0.05; Asian tropical non-primary forests 0.05 ≤ p < 0.10), except for Asian tropical primary forests, where no statistically significant trend is detected (p = 0.73).
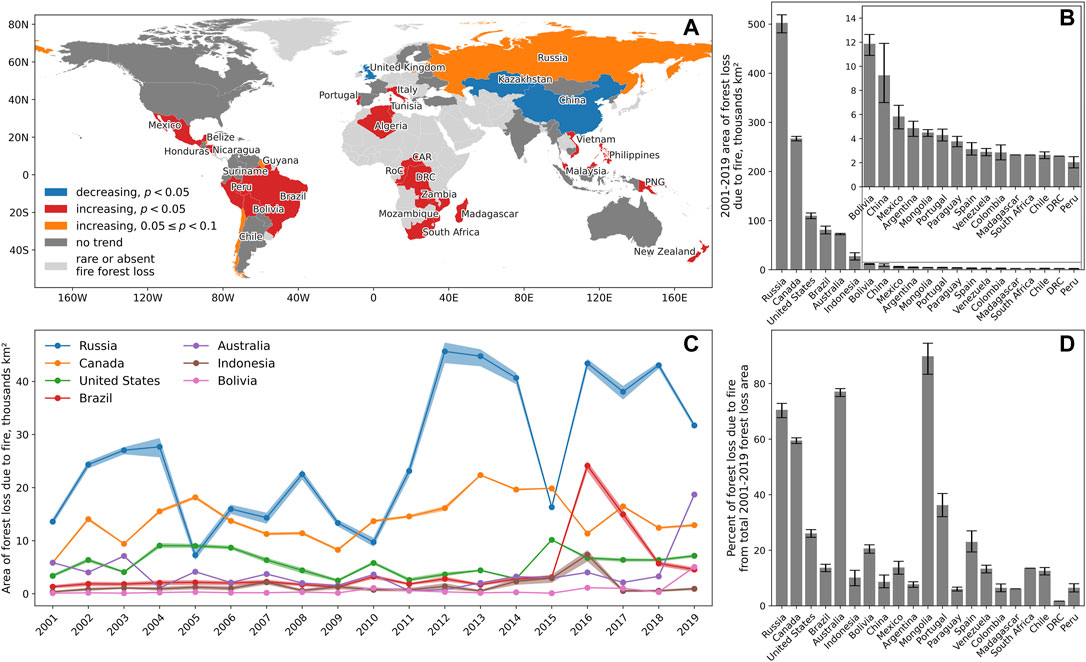
FIGURE 10. Forest loss due to fire between 2000 and 2019 by country. (A) Area trend (two-sided Mann–Kendall test with significance levels set at α = 0.05 and α = 0.10, countries with mean annual area of forest loss due to fire <10 km2/yr. are excluded from trend analysis); (B) total area; (C) annual area for countries with total 2001–2019 area of forest loss due to fire >10,000 km2; (D) area of forest loss due to fire as percent of total 2001–2019 forest loss area from Hansen et al.(2013) map. Area estimates and uncertainty intervals are map-based, within the joint extent of mapped tree cover in 2000 and forest loss from 2001 to 2019 (Hansen et al., 2013). Data are available in Supplementary Table S4.
Materials and Methods
The general overview of the methods (including mapping and sampling) is presented in Supplementary Figure S1. For the overview of the sample-based component of the study, please refer to the end of Sample-Based Map Selection and Accuracy Assessment.
Definitions
Forest loss (stand-replacement disturbance or tree cover loss) is defined, following Hansen et al. (2013), as the removal of woody vegetation exceeding 5 m in height. Forest loss due to fire was mapped only within the extent of the global 30-m resolution 2000–2019 forest loss data set (Hansen et al., 2013), and only the first stand-replacement forest disturbance between 2001 and 2019 was labeled as attributed to fire or non-fire for each pixel. Stand-replacement forest fires are defined as natural or human-ignited fires, resulting in direct loss of tree canopy cover exceeding 5 m in height. This definition includes wildfires, escaped fires from slash-and-burn agriculture, hunting and other human activities, and intentionally set fires (e.g., for land grabbing). Burning of previously felled trees is excluded from our definition of forest loss due to fire because the initial driver of forest loss in this case is mechanical removal. Burning of felled trees is common in large-scale deforestation in Brazil and Indonesia (Morton et al., 2006; Gaveau et al., 2014) and is a part of the slash-and-burn subsistence farming cycle. In the current article, we are reporting the areas and trends of forest loss due to fire only within the forests established by the year 2000 [with year 2000 % tree cover (Hansen et al., 2013) above zero]. We do not employ a single % tree cover threshold to define forests, but rather report trends for a variety of possible forest definitions with 10% tree cover increments (Table 1). The full version of our new map (available for download from https://glad.umd.edu/dataset/Fire_GFL/) disaggregates all pixels of the global forest loss map (Hansen et al., 2013) (including areas with 0% year 2000 tree cover) into forest loss due to fire vs. due to other drivers; therefore, it may include stand-replacement fires in the forests that have regrown to meet the 5-m height criterion between 2001 and 2019.
Fire vs. Non-Fire Forest Loss Mapping
The primary inputs for classification of forest loss into loss due to fire and loss that is not fire-related are Landsat-based annual change detection metrics (Potapov et al., 2020). To create these metrics, normalized clear-sky Landsat observations have been aggregated by a 16-day observation interval for each year. All intervals within a year are then ranked using spectral reflectance from separate bands and normalized band ratios to produce aggregate spectral metrics for the current year (e.g., maximum, minimum, and average of 16-day intervals ranked by the value of Landsat Red band). The differences in spectral reflectance and index values for the same 16-day interval between the current and the three preceding years are computed and ranked. The selected ranks (highest, second highest, lowest, and second lowest) of these differences are extracted to produce metrics highlighting interannual changes of spectral reflectance. In addition to the spectral metrics, we used topography metrics (aspect and slope) derived from the void-filled seamless Shuttle Radar Topography Mission digital elevation data (http://srtm.csi.cgiar.org) and ASTER DEM (https://asterweb.jpl.nasa.gov/gdem.asp). The code to compute the annual change detection metrics from 16-day Landsat observations is a part of the University of Maryland Global Land Analysis and Discovery (GLAD) team's Landsat Analysis Ready Data (ARD) package, which is available online (https://glad.umd.edu/ard/home, Change detection metrics A).
Per pixel supervised classification of the annual change detection metrics was performed within mapped 2000–2019 forest loss (Hansen et al., 2013) using classification and regression trees (Breiman et al., 1984) with bootstrap aggregation (21 bagged trees). The training data for fire vs. non-fire forest loss were collected via visual interpretation of annual last observation Landsat composites within mapped forest loss (Hansen et al., 2013), supplemented by visual inspection of high-resolution imagery available on Google Earth and national fire databases (Canadian National Fire Database, 1980–2019, Canadian Forest Service http://cwfis.cfs.nrcan.gc.ca/ha/nfdb; US Historical fire perimeters, 2000–2019, Geospatial Multi-Agency Coordination Group https://rmgsc.cr.usgs.gov/outgoing/GeoMAC/). Manually drawn fire and non-fire training polygons were used to sample individual Landsat pixels to train classification tree models (with a sampling rate of 1% for each tree, resulting in millions of individual pixels sampled to train each regional model). More detailed descriptions of the training data collection and classification procedures, as well as links to the tools, are also available from the GLAD ARD package (https://glad.umd.edu/ard/home, User Manual).
The classification models were regionally calibrated, with five separate regional models for North America, Latin America, Africa, Northern Eurasia, and combined South and Southeast Asia, Australia, and Oceania (Figure 2A). The boundaries of the regional models correspond to the GLAD ARD 1 × 1 degree tile grid and were selected to avoid crossing any large forest massifs, thus virtually eliminating the boundary effects from stitching model results into a global map. Each regionally calibrated model utilized a full set of annual change detection metrics (Potapov et al., 2020).
Each regional classification model disaggregating the global forest loss map into fire vs. non-fire classes was applied to the annual Landsat-based change detection metrics for the year of forest loss from the Hansen et al. (2013) map as well as for the subsequent year. Inclusion of the following year's metrics facilitated the identification of late-season forest fires that may have been detected in the global forest loss map, but do not have sufficient data in the current year to identify them as forest loss due to fire. The output of the classification model was the probability of a forest loss due to fire class, which represents the relative proportion of fire vs. non-fire training pixels in each leaf node of the bagged tree model. This means that if an end node of a classification tree (called “leaf node”) includes only fire or non-fire training pixels, all the pixels in the classification output that belong to this node will have either a 100% or a 0% probability of belonging to forest loss due to fire class (our target mapping class). Mixed leaf nodes (containing both fire- and non-fire training pixels, where the model could not make an unequivocal split between the classes) result in classification outputs with lower probability of the target class, reflecting the proportion of the training pixels within each node. For example, a leaf node with 60% of training pixels labeled as forest loss due to fire and 40% of training pixels labeled as forest loss due to other drivers results in output map pixels classified as a 60% probability of a forest loss due to fire class.
To produce the initial version of the forest loss due to fire map, which was used as a stratification for allocating the reference sample, we thresholded fire probability layers derived from the model applied to the current and following years' (relative to the year of mapped forest loss) metrics. We assigned a pixel to the fire class if it had a fire class probability of ≥50% in at least one of the two annual model results. We have also performed initial filtering by the annual occurrence of water (Pickens et al., 2020): pixels with ≥30% of annual observations that were marked as “water” in the current or following year were marked as non-fire forest loss. Thus the initial forest loss due to fire vs. non-fire map was derived by thresholding the two annual fire model results and two annual % water maps (for the current and following years) for each pixel in order to subdivide the global forest loss map into two strata: likely forest loss due to fire and loss due to other direct drivers. These strata were used to increase the sample size in the loss due to fire strata in Latin America, Africa, and combined South and Southeast Asia, and Australia and Oceania, where the forest loss due to fire is relatively rare, and to increase the sample size in the forest loss due to other drivers stratum in Northern Eurasia (Table 2). The final forest fire vs. non-fire forest loss map was the map for which the areas of fire loss and non-fire loss matched their corresponding sample-based area estimates within the extent of the global forest loss map (Hansen et al., 2013) (see next section for further details).
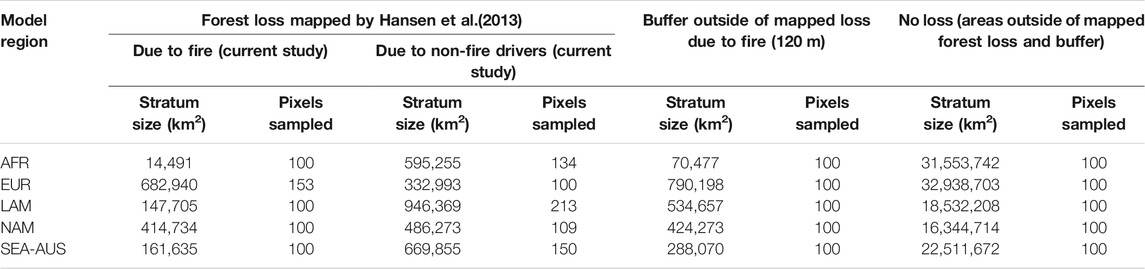
TABLE 2. Sampling design. AFR: Africa, EUR: Northern Eurasia, LAM: Latin America, NAM: North America, and SEA-AUS: combined South and Southeast Asia, and Australia and Oceania. Region boundaries are presented in Figure 2A.
Sample-Based Map Selection and Accuracy Assessment
The first use of the reference probability sample data was to evaluate whether the following methodological steps improved final map accuracy: 1) applying forest loss due to fire model to the subsequent year change detection metrics and 2) applying % annual water threshold to classification results. For each model region, the set of candidate binary maps of forest loss due to fire vs. other drivers was created using all possible fire probability thresholds from the model applied to the current and next year metrics and their combinations, and all possible % annual water thresholds. The last step in the protocol was to select the map in the candidate set for which the area of loss due to fire matched the sample-based area estimate within the extent of the global forest loss map (Figure 3; Table 3). To incorporate uncertainty in the map selection protocol due to variability of the sample-based area estimate, we selected two additional maps from the candidate set of maps. One map was selected so that the map-based area of forest loss due to fire matched the sample-based area minus one standard error, and the other map was selected to match the sample-based area plus one standard error. These two additional maps provide an indication of how the results may vary due to estimating the target area from a probability sample.
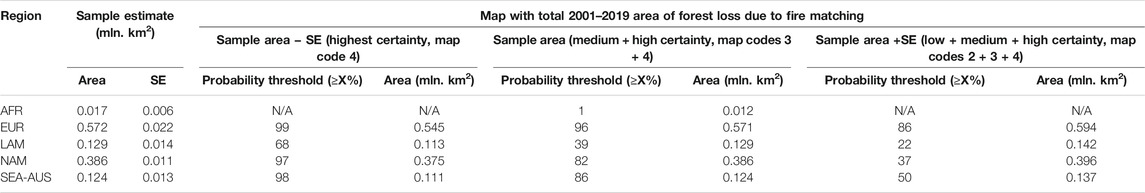
TABLE 3. Thresholds of forest loss due to fire class probability used to select the map with area matching the sample-based estimate ±SE within the extent of the global forest loss map; corresponding map- and sample-based estimates. AFR: Africa, EUR: Northern Eurasia, LAM: Latin America, NAM: North America, and SEA-AUS: combined South and Southeast Asia, and Australia and Oceania. For regional boundaries see Figure 2A. The codes assigned to map pixels with the corresponding certainty levels are: code 4 for map pixels with the highest certainty of forest loss due to fire; code 3: medium certainty; and code 2: low certainty. Africa does not have a map uncertainty interval.
For the objectives outlined above, we sampled only within the extent of forest loss mapped by Hansen et al. (2013). The mapped forest loss areas were subdivided into two fire substrata within each of the mapping regions using the initial map of forest loss due to fire, resulting in a total of 10 forest loss strata (Table 2). We allocated 100 sample pixels each in all strata that had an area smaller than the average area across all forest loss strata. For the larger than average strata, we computed the sample size as 100 × stratum size/average stratum size. This gave us a sample size of 1,259 pixels, which based on the resulting standard errors (SEs) was deemed sufficient to evaluate the model performance and estimate the total 2001–2019 area of forest loss due to fire within the Hansen et al. map for each mapping region. The resulting relative SEs of regional area estimates are 2.8% and 3.8% in North America and Northern Eurasia, 10.1% in combined South and Southeast Asia, and Australia and Oceania, 11.1% in Latin America, and 37.4% in Africa (Table 3). The area estimates of forest loss due to fire from this initial sample within mapped forest loss were then used as targets for selecting the map that matched the estimated area in each model region (Figure 3; Table 3). The sample pixel locations are shown in Figure 2A.
A second set of sampling strata was created covering the spatial region not mapped as forest loss by Hansen et al. (2013) (Table 2). These strata were added to estimate the area of forest loss due to fire that was omitted in our new map due to the omission of forest loss in the global map (Hansen et al., 2013). The full sample, both within and outside of the global loss map, was then used to estimate the total area of forest loss due to fire globally and by the map region and to assess the accuracy of our new area-matched map of forest loss due to fire. The strata outside of the mapped forest loss (Hansen et al., 2013) include the area within a 120-m buffer around the pixels mapped as forest loss due to fire (after selecting the map to match to the sample estimate within the forest loss strata) and all other land areas outside of the mapped loss and buffer. Using a buffer to intensify sampling where omission errors in the map are most likely is a recommended practice (Olofsson et al., 2020). The 120-m buffer was selected following our previous study in the Brazilian Amazon (Tyukavina et al., 2017), and it is likely a conservative buffer distance for a global analysis. We have sampled an additional 100 pixels in the buffer stratum and in the no forest loss stratum in each map region (Table 2), resulting in the total sample size of 2,259 pixels. This sample size was considered sufficient for map accuracy assessment because it resulted in the relative SE of the global estimate of the total area of forest loss due to fire of 3.3% (Table 4). The SEs of the global estimates of user's accuracy (UA) and producer's accuracy (PA) of the forest loss due to fire map class were 1.7% and 2.8%, respectively. The relative standard errors of the regional area estimates ranged from 4.0% to 12.3%, with the exception of Africa (36.7%); the SEs of regional estimates of UA ranged from 1.7% to 8.9% and the SEs of PA ranged from 3.4 to 12.7%, with the exception of Africa, where the SE of PA was 37.6% (Table 4).
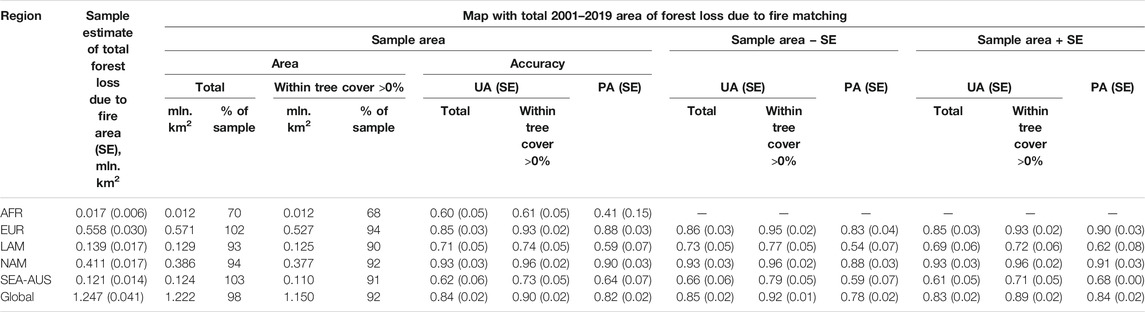
TABLE 4. Sample- and map-based estimates of the total area of forest loss due to fire, and the accuracy of the mapped forest loss due to fire. Sample estimates are for all strata (within the entire land area); map estimates are within the global forest loss map (Hansen et al., 2013) only. Map version “within tree cover >0%” has all areas with zero % tree cover in the year 2000 (Hansen et al., 2013) mapped as “no forest loss”. AFR: Africa, EUR: Northern Eurasia, LAM: Latin America, NAM: North America, and SEA-AUS: combined South and Southeast Asia, and Australia and Oceania. Region boundaries are presented in Figure 2A. PA: producer's accuracy; UA: for user's accuracy of the forest loss due to fire class. SE denotes standard error.
The global forest loss data are stored in a rectangular grid of geographic coordinates (latitude/longitude in the geographic reference system WGS84). This means that closer to the poles, the actual area that each pixel represents gets smaller than a pixel on the equator. To increase the sample size of pixels near the equator, we implemented a sampling protocol that selected pixels with probability proportional to their area, following the approach of Pickens et al. (2020). The equations for estimating the forest loss due to fire area and its standard error, and UA and PA of this target map class with their respective SEs, for the weighted sampling with replacement are provided in the Supplementary Material. The Python codes for implementing these equations along with the input data to compute the sample-based area of forest loss due to fire and the accuracy of the sample-matched map along with their SEs globally and for each model region (Figure 2A) are available at https://github.com/sashatyu/Fire_GFL.
For each sample pixel, we created a set of reference data for 2000–2019, including annual and bimonthly Landsat image composites, time-series of spectral indexes (NDVI and NDWI), and an SWIR Landsat band based on the 16-day cloud-filtered GLAD ARD data, and a link to the pixel location in Google Earth. Each sample pixel was visually examined independently by two experts; all sample pixels with mapped forest loss for Latin America and insular Southeast Asia (831 out of 2259, 37%) were additionally interpreted by a regional land cover expert. At the first stage of interpretation, each analyst assigned the following labels to each sampled pixel: fire/no fire forest disturbance, confidence of fire forest disturbance (high, low), year of fire, and confidence of fire year (high, low). Interpreters looked for the spectral signature of ash and distinct spatial patterns of burning, which are well documented in remote sensing literature (Giglio, 2007; Roy et al., 2013). They also compared pre- and post-fire time-series of NDVI, NDWI, and SWIR Landsat band to identify whether the fire resulted in considerable vegetation damages, corresponding to our stand-replacement fire definition. These initial sample interpretations were performed blind (interpreters not knowing the stratum and forest loss year from the maps). The agreement of the fire/no fire labels after this initial round of sample interpretation was high; all interpreters agreed about the presence of fire-related forest loss for 80% of the sample pixels, and at least two interpreters agreed for 96% of the sampled pixels. After this initial round, the interpreters worked together to reach a consensus for those sample pixels with interpretation disagreements and low confidence of interpretation. At this stage, interpreters also used the year of loss from the Hansen et al. (2013) map because in many cases a sample pixel experienced multiple change events between 2001 and 2019. Interpreters considered the change event closest to the date detected by the global forest loss map as the reference change event. The resulting consensus fire/no fire sample labels have high interpretation confidence for 93% of the sampled pixels.
From these fire/no fire reference sample labels, we estimated the area of fire-related disturbances within the forest loss strata, which was used as a target for map selection (see Table 3 and Figure 3 for more details). However, there may be some areas incorrectly mapped as forest loss in the global map that burned according to our initial sample interpretation, but might not have reached the 5-m height threshold before burning. There is no way of reliably visually distinguishing whether woody vegetation reached this height threshold by the time of burning from the satellite imagery. Therefore, to distinguish our initial reference sample labels into stand-replacement forest fires and burning of other vegetation, we used an auxiliary % tree cover data set for the year 2000 (Hansen et al., 2013). The sample pixels identified as a fire disturbance in the initial visual sample interpretation were considered stand-replacement forest fires only if a sampled pixel had the year 2000 tree cover above zero. While acknowledging that the % tree cover map is not perfect and that some tree cover in the tropics might have regrown between year 2000 and the time of burning, we find the addition of the tree cover mask to the reference sample useful for distinguishing between forest and non-forest fires in sparse canopy forests, particularly in the boreal regions and in Australia. The final sample-based area of forest loss due to fire and accuracy of the selected map (Table 4) were estimated from the sample reference labels with burning of year 2000 zero tree cover areas considered as “no forest loss due to fire”. All reference sample data, along with the final sample interpretation results are available online (https://glad.umd.edu/Fire_GFL).
From the reference sample, we found that using the subsequent year's model in addition to the current year's results decreased the accuracy of the final map. We also found that including an annual % water threshold did not improve the map accuracy. Therefore, the final map selection was from a set of candidate maps based only on the current year model's fire probability values (classification tree model applied to the annual change detection metrics of the same year as the year of loss from the global map).
To select the map from a candidate map set based on the current year model's fire probability values, we computed sample-based estimates of the area of fire disturbances within the forest loss strata (Table 3) for each of the model regions, along with the standard errors of the area estimates. We then selected three maps for each region, determining the probability thresholds that corresponded to the maps matching the sample-based area estimate minus one SE, the sample-based area estimate, and the sample-based area estimate plus one SE (Table 3; Figure 3). The classification model for Africa had only 0 and 100 probability values of forest loss due to fire since the target class in Africa is very small and the selected training data sampling rate resulted in a classification tree model with pure end leaf nodes (no nodes with mixed training data). Because intermediate target class probability values were not available in Africa, we had only one candidate map of forest loss due to fire. However, the total 2001–2019 map area of forest loss due to fire in Africa falls within ±SE of the sample-based area estimate, and therefore, we consider the map to have negligible bias in Africa relative to the area of the sample-based estimate.
Figure 4 further illustrates the impact of sampling variability of the sample-based area estimate on the map selection protocol: the sum of red map pixels (code 4) corresponds to the sample area estimate minus one SE (i.e., those pixels with the highest certainty of forest loss due to fire class), adding orange (code 3) to red (code 4) pixels results in a map area matching the sample-based area estimate, and adding yellow (code 2) pixels to orange and red (codes 3 and 4) yields a map area matching the sample area estimate plus one SE. Thus, the pixels coded with yellow (code 2) have the lowest certainty of belonging to the target class. Note that most orange and yellow pixels (codes 2 and 3) are located on the boundaries of high certainty (red, code 4) fire or high certainty no fire (blue, code 1) pixel patches. Relatively large patches of lower certainty fire pixels are found in a few areas with uncertain boundaries between thematic classes. One such example is where insect damage is found in the same landscape with forest fires (Figure 4A) as occurs with the mountain pine beetle in the Rocky Mountains of North America (Jenkins et al., 2014) and the Siberian silk moth in the Tomsk region of Russia (Kharuk et al., 2017). In the tropics, uncertain areas are found in the regions with intensive slash-and-burn agriculture (e.g., Madagascar) and where large-scale industrial forest clearing is often followed by burning of the felled trees (Gaveau et al., 2014) to clear the area for agricultural use or land grabbing (e.g., Sumatra, Indonesia, Figure 4B). The final sample-matched map with incorporated uncertainties is available for download and as an interactive map from https://glad.umd.edu/dataset/Fire_GFL/.
For applications not requiring uncertainty of the forest loss due to fire class, this final map could be converted into the binary map by assigning pixels with codes 3 and 4 to the forest loss due to fire class and assigning pixels with codes 1 and 2 to forest loss due to other drivers. To derive a conservative forest loss due to fire map, code 4 alone could be used as the forest loss due to fire class. The map for Africa has codes 5 (forest loss due to fire) and 1 (other drivers) due to the lack of an uncertainty interval for that region.
Globally, the map area of forest loss due to fire corresponding to the sample area estimate within the global forest loss map (Hansen et al., 2013) is 2% smaller than the full sample-based estimate of forest loss due to fire area, derived from all sampling strata (Table 4, total map area vs. sample estimate). This is the full version of the map, which includes loss due to fire in forests, established by the year 2000, and in forests that have regrown between 2001 and 2019. UA and PA of the forest loss due to fire class in this full map are 0.84 (SE 0.02) and 0.82 (0.02), respectively (Table 4, total map accuracy). The global area of forest loss due to fire, omitted by our new map, is estimated from the reference sample at 0.22 (SE 0.03) million km2, 46% of which or 0.10 (0.02) million km2 is within the 120-m buffer around the mapped forest loss due to fire, and the rest is misattributed as other drivers of forest loss within the extent of the global forest loss map (Hansen et al., 2013). Most of the omission errors in the buffer stratum are related to underestimation of stand-replacement forest loss within fire events partially captured by the global forest loss (Hansen et al., 2013) map. No omission errors were found in the no loss stratum outside of the buffer. Another 0.20 (0.02) million km2 was falsely identified in our map as forest loss due to fire (commission errors).
To produce the version of our new map, representing forest loss due to fire in the forests established by the year 2000, we labeled all pixels with absent tree cover in the year 2000 as “no forest loss.” This version of our new map has reduced area of forest loss due to fire commission errors of 0.11 (0.02) million km2 and improved UA of mapped forest loss due to fire class of 0.90 (0.02) (Table 4, UA within tree cover >0%), compared to the full version of the map. This version of the map was used for area and trend reporting in the current study to eliminate the inconsistencies of forest loss detection in regrowing forests and in very sparse tree cover, which are possibly present in the annually updated global forest loss map (Hansen et al., 2013). Thus, in the Results section, we report the map-based areas and trends of forest loss due to fire within a static year 2000 forest mask.
The continental accuracies of both map versions vary (Table 4): North America and Northern Eurasia, where wildfires are widespread, have the highest UA and PA of forest loss due to fire class, and Africa, where wildfires are very rare, has the lowest accuracy. The largest difference in UA between the two map versions is observed in Australia and Northern Eurasia, were stand-replacement fires in sparse opened-canopy forests are common, and therefore the global forest loss map (Hansen et al., 2013) has high ambiguity in distinguishing between forested and non-forested burned patches.
When we are reporting forest loss due to fire expressed as a percent of the total forest loss (Figures 2D, 5D; Table 5, Supplementary Tables S1–S4), the area of the total forest loss is obtained from the global map by Hansen et al. (2013). The global accuracy of the forest loss class reported in the original publication [UA, 0.87 (0.03) and PA, 0.88 (0.03)] is balanced, meaning that the global area of forest loss is neither significantly overestimated nor underestimated, providing a representative base area from which we have calculated the percentages. The UA of the version of forest loss due to fire map, which is used for area reporting (Table 4, UA within tree cover >0%), is similar [0.90 (0.02)], while its PA is lower [0.82 (0.02)]. This greater omission results in the reported area of forest loss due to fire globally being underestimated by about 8% (Table 4, map area within tree cover >0% vs. sample estimate), which means that the global percentage of forest loss due to fire could also be underestimated by 8%. Therefore, the global % of forest loss due to fire reported in Table 5 (26–29%) could in reality be as high as 28–32%. For Africa, where relative omission of forest loss due to fire is the highest (Table 4), this percentage could change from a reported 2 to 3%. These potential underestimations are not large and strengthen our findings of higher proportions of forest loss due to fire from the total forest loss when compared to previous studies (Krylov et al., 2014; Curtis et al., 2018; Guindon et al., 2018).
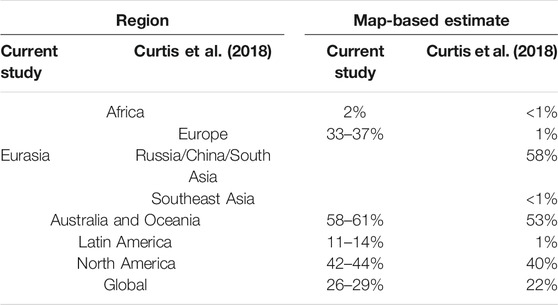
TABLE 5. Map-based estimates of percent forest loss due to fire from the total 2001–2019 forest loss in the current study, and from 2001–2015 forest loss in Curtis et al. (2018). The range of percentages in the current study corresponds to the map uncertainty interval (see Methods). For boundaries of reporting regions from the current study refer to Figure 2B; region boundaries are aligned with those from the Curtis et al. (2018) study.
The map-based areas of forest loss due to fire within non-zero year 2000 tree cover are reported by countries (Figure 10, Supplementary Table S4) using GADM version 2 country boundaries (https://gadm.org/) and by FAO Global Ecological Zones 2010 (FAO, 2012). FAO global ecological zones were aggregated into four climate domains (boreal, temperate, subtropical, and tropical), and the tropical domain was then subdivided into two zones: within and outside of tropical rainforests, resulting in five reporting zones (Figure 7, Supplementary Table S2). Polar ecozones were excluded due to the absence of tree cover. Within the tropical climate domain, the area of forest loss due to fire is also reported separately for primary and non-primary forests (Figure 9) defined using the pan-tropical primary forest map (Turubanova et al., 2018).
Below is the summary of the sample-based map selection and accuracy assessment steps, described in this section of Methods:
1) The initial sample of 1259 pixels was selected from two strata defined within mapped global forest loss (Hansen et al., 2013) (fire-related and non-fire–related forest loss, Table 2, Figure 2A). These sample pixels were visually interpreted to identify whether the mapped loss event was associated with fire or not. These data were used for the following:
a) to identify that applying the fire vs. no fire classification model to next year's change detection metrics (Potapov et al., 2020), as well as using % water threshold (Pickens et al., 2020) to filter classification results, did not improve the accuracy of fire detection. The final map was selected from a set of candidate maps based on the decision tree model applied to only the current year change detection metrics;
b) from the set of potential candidate maps based on the current year's metrics, to select the binary map (fire and non-fire classes) for each model region (Figure 2A) for which the mapped area of fire disturbances matches the sample-based area estimate within the target region defined by mapped forest loss (Figure 3; Table 3);
c) to construct map uncertainty intervals for each model region by selecting the maps that correspond to the sample-based area estimates ± one standard error (Figure 3; Table 3).
2) An additional sample of 1000 pixels was selected from two strata defined within all land pixels outside of the mapped global forest loss (Hansen et al., 2013): one stratum was the area represented by a 120-m buffer around the forest cover loss (Hansen et al., 2013) and the other stratum was a no loss stratum within all remaining land pixels (Table 2; Figure 2A). This additional sample was used to quantify the omission of forest loss due to fire outside of the area of mapped forest loss. The additional sample pixels were visually interpreted in the same manner as the initial sample to identify the presence or absence of fire within the study period.
3) The final “forest loss due to fire” reference labels for the full sample of 2259 pixels were derived by combining the fire vs. no fire visual interpretation results with the year 2000 % tree cover map: only the fire sample pixels within non-zero year 2000 % tree cover were considered “forest loss due to fire.”
4) This final interpretation of the full reference sample was used to assess the accuracy of the two versions of the forest loss due to fire map (Table 4):
a) original sample–matched map within mapped global forest loss (Hansen et al., 2013), which is available to download from https://glad.umd.edu/dataset/Fire_GFL/and
b) a version of the map used for area and trend reporting in the Results section of this article, also within the extent of mapped global forest loss (Hansen et al., 2013), where all the areas with zero % tree cover in the year 2000 (Hansen et al., 2013) were mapped as “no forest loss.” This was done to limit the impact of forest loss commission errors in sparse tree cover areas in the original forest loss map (Hansen et al., 2013) on reported trends. This map version includes forest loss due to fire only in the forests established by the year 2000, while the full version available for download might include stand-replacement fires in post-2000 forest regrowth.
Forest Loss Date and Trend Assessment
The date of forest loss in the current study is derived from the Hansen et al. (2013) global forest loss map and represents the first stand-replacement forest disturbance detected between 2001 and 2019 for each pixel. A trend analysis was performed using the pyMannKendall package (Hussain and Mahmud, 2019). We did not intend to modify the dates of forest loss on the map using the reference sample data. However, we did collect a date of loss for the sampled pixels identified as forest loss due to fire when interpreting the sample. Our reference sample is not large enough to provide precise estimates of the annual area of forest loss due to fire in each of the model regions. Therefore, for the purposes of comparison of the map and sample-based annual results, we computed 3-year average annual areas of forest loss due to fire for all model regions (Figure 5).
The latest version (1.7) of the global forest loss map includes annual updates based on improved classification models, hence there are temporal inconsistencies in loss detection rates between the early 2000s and recent years, previously reported in regional studies (Tyukavina et al., 2017, 2018). To test if these model differences affect the trends of forest loss due to fire, we have applied the latest global annual forest loss detection model retroactively starting from 2001, thus constructing a prototype of the temporally consistent global forest loss map. We have then applied the fire detection model from the current study within the updated forest loss extent map for each year (2001–2019). The map-based estimates of 3-year averaged annual areas forest loss due to fire within the current and the prototype global forest loss maps are shown in Figure 5 (in blue and green, respectively). The overall trend direction in the 3-year averaged sample data agrees with both versions of the map: increasing trend in the area of forest loss due to fire (Mann–Kendall test, p < 0.05) is observed globally, in Northern Eurasia, Latin America, and Africa; the trend is absent (p > 0.05) in North America and combined South and Southeast Asia, and Australia and Oceania. This supports our results that report the presence of trends in the map of forest loss due to fire (Figures 7C, 10A, Supplementary Table S1, S2). As an additional verification of the observed trends in forest loss due to fire, we have analyzed the distribution of active fire detections from MODIS and VIIRS sensors within our mapped fire- and non-fire forest loss classes (Supplementary Material Results, section 2.1).
The differences between the sample- and map-based annual rates of forest loss due to fire are mostly related to map errors. The sample pixels that were classified as forest loss due to fire in both the map and the reference samples had a very high date agreement (Figure 6), as 277 out of 351 pixels (79%) had a matching year of loss and 60 pixels (17%) had a map date 1 year later than the reference date. This agrees with Hansen et al. (2013), who reported that 96.7% of the forest loss events occurred within 1 year from the mapped forest loss date (vs. 96.0% in the current study), with the mean absolute deviation of 0.29 years. The mean date difference in the current study across all regions (map minus reference) is 0.26 years, varying from 0.23 in Northern Eurasia to 0.31 in combined South and Southeast Asia, and Australia and Oceania.
Results
According to our new map, 26–29% (range corresponds to map uncertainty interval) of global 2001–2019 forest loss was due to fire, which is higher than previous estimates of 21–25% for 2001–2015 (Curtis et al., 2018) and 12–18% for 2003–2014 (Liu et al., 2019). These differences are related to the finer spatial scale of the current study and a longer time interval that captured recent high fire years (Figure 8A). Estimates of regional proportions of forest loss due to fire range from 58–61% in Australia and Oceania to 2% in Africa (Table 5). The largest difference with the previous aggregate-scale study (Curtis et al., 2018) is observed in Latin America (11–14% in this study vs. 1% in Curtis et al., 2018). Globally, boreal forests have the highest proportion of forest loss due to fire (69–73%), followed by subtropical (19–22%), temperate (17–21%), and tropical forests (all tropical forests 6–9%, rainforests 7–9%) (Supplementary Table S1).
Our new map reveals an increasing global trend of forest loss due to fire between 2001 and 2019 (Mann–Kendall test, Supplementary Table S1) regardless of which % tree canopy cover threshold is chosen to define forests (Table 1). The increasing trend in closed-canopy forests, in particular, is consistent with previously published results for 1998–2015 (Andela et al., 2017). Furthermore, the increasing trend is also observed in forests of the tropical and temperate climate domains, regardless of whether sparse tree cover is excluded or included into the analysis (Table 1), which disagrees with previous reports of decreasing forest loss due to fire in tropical forests for 2003–2012 (van Lierop et al., 2015) and 2003–2014 (Liu et al., 2019). When the tropical climate domain is subdivided into tropical rainforests and the rest of the tropical climate domain (dry and moist tropical forests outside of rainforests), increasing trends of forest loss due to fire from our new 2001–2019 map are observed in both subregions (Table 1). Subtropical forests did not show a consistent trend in the area of forest loss due to fire as increasing trends are observed only when sparse tree cover (up to 30%) is excluded from the forest definition (Table 1). Boreal forests show an increasing trend of forest loss due to fire when forests with 0–30% canopy cover are included (0.05 ≤ p < 0.10) or when 100% tree canopy cover is considered separately (p = 0.01, Table 1). No climate domain within each of the map regions (Figures 7, 8) exhibits decreasing trends of forest loss due to fire.
Among climate domain subregions, boreal forests in Eurasia and North America have the largest absolute area of forest loss due to fire (Figure 7B) and, along with subtropical forests of Australia and Oceania, the highest percent of forest loss due to fire from the total 2001–2019 forest loss area (Figure 7D). Combined, the two boreal subregions account for 68–72% of the global area of forest loss due to fire (42–45 and 26–27%, respectively). In North American boreal forests, 78–80% of forest loss area is due to fire, and Eurasian boreal forests closely follow with 64–69%. In boreal forests (Figure 1B), fires are a part of the natural succession cycle spanning decades (Kasischke and Stocks, 2000). In our study (Figures 7C, 8B, Supplementary Table S2), we observed an increasing trend of forest loss area due to fire in Eurasian boreal forests between 2001 and 2019 (Mann–Kendall test, 0.05 ≤ p < 0.10 for tree cover ≥1–50% and p < 0.01 when 100% tree canopy cover is considered separately), and an absence of a trend in boreal forests of North America (all % tree cover thresholds). The difference in trends between the Eurasian and North American boreal forests might be due to the relatively short study period of our study (19 years) that may not adequately capture the frequency of peak fire years in boreal forests.
Tropical regions of both Latin America and Africa (Figure 7C) exhibit increasing trends in forest loss due to fire between 2001 and 2019 (Mann–Kendall test, 0.05 ≤ p < 0.10 for 100% tree cover in tropical Latin America outside of rainforests, p < 0.05 for all other % tree cover thresholds, Supplementary Table S2), while forests of Tropical Asia do not show a significant trend (p > 0.10 for all % tree cover thresholds except 100% tree cover in tropical rainforests, where an increasing trend with p < 0.01 is observed). Stand-replacement forest fires in the tropics are much rarer than in boreal regions (Figures 7B, 8), but the severe El Niño event of 2015–2016 (Rifai et al., 2019; Wigneron et al., 2020) increased fire-related forest loss in the tropical rainforests of Latin America and Asia tenfold (Figure 8F). Model simulations under El Niño and no–El Niño scenarios for 2015–2016 indicate that South America experienced the largest fire response to El Niño across the tropics (Burton et al., 2020). The peak around 2016 was also observed in the tropical rainforests of Africa (Figure 1C), although much less pronounced, which agrees with a simulated equivocal effect of El Niño on the burned area in Africa (Burton et al., 2020). Fire-related forest loss remained higher than pre-2015 rates in tropical rainforests of both Africa and Latin America but returned to pre-2015 rates in South and Southeast Asia, which is reflected in the absence of a trend in the region. This result agrees with Wigneron et al. (2020) who reported that 2017 aboveground carbon stocks in the humid forests of Tropical Asia were similar to pre-El Niño levels but declined in tropical Africa and America. This outcome is explained by lower drought stress levels (indicated by climate variables) in Tropical Asia compared with the rest of the tropics.
To further investigate the dynamics of forest loss due to fire in the tropics, we intersected our map with the pan-tropical 30-m resolution primary forest loss map by Turubanova et al. (2018). In all tropical forests, the percent of forest loss due to fire from the total 2001–2019 loss is higher in primary forests than non–primary forests (11–15% vs. 4–6%, Supplementary Table S3). From the regions with a mean annual area of forest loss due to fire ≥10 km2/yr, Latin America has the highest proportion of fire-related forest loss in primary forests (16–19%) and Africa, the lowest (3%). The majority of tropical primary forest loss due to fire takes place in Latin America (Figure 9B). Increasing trends are observed in primary and non–primary tropical forests in all tropics combined, in Latin America, Africa, and Australia and Oceania regardless of the % tree cover threshold used to define forests (p < 0.01, Figures 9A–D, Supplementary Table S3). No trend in forest loss due to fire is detected in Asian tropical primary forests (p > 0.10, Figure 9E, Supplementary Table S3).
Subtropical forests exhibit increasing trends of forest loss due to fire in Africa (Mann–Kendall test, p < 0.05 for all % tree cover thresholds, Supplementary Table 2); this trend is exhibited only in dense forests in Australia and Oceania (≥50% tree cover, p < 0.05) and when 100% tree cover is considered separately (p < 0.01) in North America. No trend of forest loss due to fire is detected in subtropical Eurasia and Latin America regardless of the % tree cover threshold used to define forests (Supplementary Table S2 and Figure 8D). In North Africa, the interannual variability of burned area and the occurrence of large fires is linked to extreme weather events caused by hot and dry Saharan Sirocco winds (Belhadj-Khedher et al., 2020) and, in South Africa, to increased temperatures and precipitation patterns within the El Niño–La Niña cycle (Strydom and Savage, 2016; Burton et al., 2020). Extensive fires in dry subtropical forests related to droughts also occurred in Europe and North America (San-Miguel-Ayanz et al., 2013): in Portugal (2003, 2005, and 2017), Spain (2006), Greece (2007, 2018), and California (2007, 2013, 2014, 2018, and 2020). Subtropical Australia and Oceania, along with Eurasian and North American boreal forests, lead in terms of the absolute extent of forest loss due to fire among subregions (Figure 7B). Forest loss due to fire in this region was high at the beginning and end of the study period (Figures 8D, 10C), with relatively low fire years in the middle. While subtropical forest fires in Australia are relatively common, 2019 was marked by the unprecedented burning of Australian temperate broadleaf forests, with over 20% of the biome burned in a single season (Boer et al., 2020). This extreme fire year contributed to an increasing trend of forest loss due to fire in temperate Australia and Oceania (Figures 7C, 8C). The rest of the temperate climate domain, where forests are intensively managed and little natural forest remains, does not exhibit a statistically significant trend (Figure 7C). Chile is an exception, with an increasing national trend of forest fire (p = 0.06, Figure 10A) due to recent extensive fires in the massive forest plantations of exotic fire-prone tree species (pine and eucalyptus) in South and Central Chile (de la Barrera et al., 2018).
Among the countries with a mean annual area of forest loss due to fire ≥10 km2/yr (Figure 10A), an increasing trend in forest loss due to fire between 2001 and 2019 (Mann–Kendall test, p < 0.10) is observed in all African countries, in Belize, Bolivia, Brazil, Chile, Guyana, Honduras, Mexico, Nicaragua, Peru, and Suriname in Latin America; in Malaysia, Papua New Guinea, Philippines, and Vietnam in Southeast Asia; in Portugal and Italy in Europe; in Russia; and in New Zealand. Indonesia and the countries of northern South America (Colombia, Ecuador, and Venezuela) are the only places with extensive primary tropical forest cover not exhibiting increased trends in forest loss from stand-replacement fires. The only countries with a decreasing trend are China (p = 0.02), Kazakhstan (p < 0.01), and the United Kingdom (p < 0.01). Russia and Canada lead in terms of the absolute area of forest loss due to fire (Figure 10B), largely contributed by the boreal forest fires. Proportions of fire from total 2001–2019 loss for Russia (68–73%) and Canada (58–60%) from the current study (Figure 10D) are higher than 65.5% (Krylov et al., 2014) and 54% (Guindon et al., 2018), respectively, as has been previously estimated for 2001–2012. Mongolia and Australia have the highest contribution of fire among all forest loss drivers (Figure 10D).
Discussion and Conclusion
The current study is a continuation of previous work on mapping multiple drivers of forest loss at a coarse spatial resolution of 10 km (Curtis et al., 2018). Here, we have mapped just one direct driver of forest loss, namely, fire, but have done so at the finer 30-m spatial scale, matching the state-of-the-art global forest extent and loss maps (Hansen et al., 2013). Distinguishing fire from other direct drivers of forest loss, particularly from forest clearing for commodity production, is essential for shaping local and national land use policies and on-the-ground interventions, and informing international climate agreements, conservation efforts, and corporate zero-deforestation commitments. The current map of forest loss due to fire will be updated annually using the same methodology to ensure the comparability of operational annual updates with the 2001–2019 baseline established here. This will enable us to extend the time-series of fire-induced forest loss, which is important considering that interannual forest fire dynamics in the tropical, subtropical, and boreal regions alike are heavily influenced by extreme fire years. Further research directions include mapping other major drivers of forest loss at 30-m resolution, namely, slash-and-burn agriculture, forestry, commodity crops, urbanization, and resource extraction. A sample-based analysis of higher resolution (1–5 m) satellite imagery will likely be required to assess the accuracy of resulting maps and to quantify the extent of forest degradation due to insect infestations, droughts, and selective logging.
We propose that the method of electing the map to be consistent with the sample-based area estimate become a common practice for global land cover monitoring products. This approach serves as a compromise between rigorous sample-based assessments that provide estimates of the area in the aggregate but lack spatial detail as to how this area is spatially distributed (Tyukavina et al., 2015, 2017, 2018) and wall-to-wall maps crucial for many monitoring tasks that lack rigorous quantification of uncertainty. In our approach, the continuous map layer representing probabilities from a decision tree-based output results in a set of completed maps each with different accuracies corresponding to a threshold probability specified to produce a binary map (Figure 3). The reference probability sample is not used in the model training process that produces this set of maps. A map can then be selected from the set of available maps so that the map area matches a specified area of the target class. We select the map whose area matches the sample-based area at the spatial scale of interest, in our case continental. The process is similar to what would be done if we had multiple maps of a region of interest and we selected the map with the best accuracy where accuracy was estimated from a reference probability sample. Selecting one of these maps in this hypothetical scenario does not alter the accuracy of any of the candidate maps, and the logical choice is the map with the best accuracy. In our approach the selected map is unbiased in that the map area matches the unbiased sample-based area estimate, satisfying the good practice guidance (GFOI, 2016) that the map neither underestimates nor overestimates the area of the target class. Examples of previous studies in which this map selection approach has been implemented include mapping wetlands in the Congo (Bwangoy et al., 2010), forest loss in Indonesia (Broich et al., 2011), and soybean cover in the United States (Song et al., 2017) and South America (Song et al., 2021).
The reference sample-based area estimate is subject to sampling variability as quantified by the standard error of the estimated area. Therefore, a different outcome (realization) of the sampling design would result in selecting a different map from the set of available maps, and maps selected to match different estimated areas will have different accuracy. Sampling variability does not alter the set of possible maps available to select from or the accuracy of those maps, but sampling variability would result in selecting a different map to match the area estimate of the sample obtained. That is, nothing about the classification procedure used to produce the set of available maps is changed over the possible different reference samples (sample realizations); only the map selected from the same available set of maps would be different. To represent the uncertainty associated with sampling variability, we provide two additional maps, one selected to match the estimated area minus one standard error and one selected to match the estimated area plus one standard error (Table 3). The accuracy estimates and standard errors for these two maps are provided as well (Table 4). The uncertainties of both sample-based area and accuracy estimates are small, indicating that the reference sample size is sufficient for the purpose of the study.
Our results provide a global-scale but locally relevant baseline for monitoring stand-replacement forest disturbances due to fire. Although a comprehensive comparison of our maps with existing Landsat-resolution national maps of burned area and forest loss due to fire is outside of the scope of the current study, we have performed a spatially explicit comparison with fire data for Canada (Supplementary Material Results, section 2.2). This comparison demonstrates a high level of agreement of the temporal trends and spatial patterns, despite some definitional and methodological differences. Numerous Landsat-scale products attributing forest loss due to fire exist for the United States of America (Vogelmann et al., 2011; Sleeter et al., 2013; Cohen et al., 2016; Huo et al., 2019; Schleeweis et al., 2020), each using slightly different definitions, temporal extent, spatial resolution, and coverage (most, excluding Alaska). This multitude of data products for the US in the absence of the officially published map database of forest fires similar to that of Canada makes comparison of our results with existing data sets more challenging. We therefore considered that analyzing the differences between published national-scale data sources in the US and elsewhere in the world merits a separate future study or studies.
The increase in fire-related forest loss in the tropics observed in the current study agrees with previously detected climate anomalies and modeled carbon losses (Burton et al., 2020; Wigneron et al., 2020). Disagreement with previous studies regarding the trends of tropical fire-related forest loss (van Lierop et al., 2015; Liu et al., 2019) stems from the shorter monitoring periods of previous studies not capturing recent extreme El Niño fire years and their aftermath of increased forest fire vulnerability. While tropical forest fires are still relatively rare, the fact that the increasing trend of forest loss due to fire is observed in primary tropical forests of Latin America and Africa (Figure 9) is an alarming sign. The projected increase in the severity and frequency of extreme weather events (Mann et al., 2017) is likely to further increase fire pressure on forests, presenting fire management challenges (Stephens et al., 2020) and leading to long-term ecosystem changes and climate feedbacks.
Data Availability Statement
The map of forest loss due to fire produced in the current study is available for download in a GeoTIFF format and as a Google Earth Engine Image Collection. Download links and Image Collection IDs along with metadata are available at Available at: https://glad.umd.edu/dataset/Fire_GFL/ Interactive data visualization is also available: https://glad.earthengine.app/view/global-forest-loss-due-to-fire Reference data for the validation sample data and final sample interpretations are available from https://glad.umd.edu/Fire_GFL/ Python code and the input data to compute sample-based area of forest loss due to fire and the accuracy of the map along with their SEs globally and for each model region are available at: https://github.com/sashatyu/Fire_GFL.
Author Contributions
AT, MH, and PP designed the study; PP prepared satellite data for mapping and reference sample interpretation; SS, AT, AP, and PP performed sampling design and statistical analysis; AT performed training data collection for classification models; AT, ST, DP, and VZ interpreted the reference sample; AL and AT performed comparison with active fire data; IK, AT, and AP developed web data download and visualization pages; AT wrote the article with contributions from all coauthors.
Funding
This study was supported through the Global Forest Watch project and funded by the government of Norway’s International Climate and Forest Initiative and the USGS/NASA Landsat Science Team grant number 140G0118C0013.
Conflict of Interest
The authors declare that the research was conducted in the absence of any commercial or financial relationships that could be construed as a potential conflict of interest.
The reviewer RH declared a past coauthorship with several of the authors: AT, PP, MH, ST, and NH to the handling editor.
Publisher’s Note
All claims expressed in this article are solely those of the authors and do not necessarily represent those of their affiliated organizations, or those of the publisher, the editors, and the reviewers. Any product that may be evaluated in this article, or claim that may be made by its manufacturer, is not guaranteed or endorsed by the publisher.
Supplementary Material
The Supplementary Material for this article can be found online at: https://www.frontiersin.org/articles/10.3389/frsen.2022.825190/full#supplementary-material
References
Andela, N., Morton, D. C., Giglio, L., Chen, Y., Van Der Werf, G. R., Kasibhatla, P. S., et al. (2017). A Human-Driven Decline in Global Burned Area. Science 356, 1356–1362. doi:10.1126/science.aal4108
Andela, N., Morton, D. C., Giglio, L., Paugam, R., Chen, Y., Hantson, S., et al. (2019). The Global Fire Atlas of Individual Fire Size, Duration, Speed and Direction. Earth System Science Data 11 (2), 529–552. doi:10.5194/essd-11-529-2019
Aragão, L. E. O. C., Anderson, L. O., Fonseca, M. G., Rosan, T. M., Vedovato, L. B., Wagner, F. H., et al. (2018). 21st Century Drought-Related Fires Counteract the Decline of Amazon Deforestation Carbon Emissions. Nat. Commun. 9, 536. doi:10.1038/s41467-017-02771-y
Belhadj-Khedher, C., El-Melki, T., and Mouillot, F. (2020). Saharan Hot and Dry Sirocco Winds Drive Extreme Fire Events in Mediterranean Tunisia (North Africa). Atmosphere (Basel). 11, 1–17. doi:10.3390/atmos11060590
Boer, M. M., Resco de Dios, V., and Bradstock, R. A. (2020). Unprecedented Burn Area of Australian Mega forest Fires. Nat. Clim. Chang. 10, 170. doi:10.1038/s41558-020-0716-1
Breiman, L., Friedman, J. H., Olshen, R., and Stone, C. J. (1984). Classification and Regression Trees. Wadsworth and Brooks: Cole Statistics/Probability Series, Monterey (Calif.).
Broadbent, E. N., Asner, G. P., Keller, M., Knapp, D. E., Oliveira, P. J. C., and Silva, J. N. (2008). Forest Fragmentation and Edge Effects from Deforestation and Selective Logging in the Brazilian Amazon. Biol. Conserv. 141, 1745–1757. doi:10.1016/j.biocon.2008.04.024
Broich, M., Hansen, M. C., Potapov, P., Adusei, B., Lindquist, E., and Stehman, S. V. (2011). Time-series Analysis of Multi-Resolution Optical Imagery for Quantifying forest Cover Loss in Sumatra and Kalimantan, Indonesia. Int. J. Appl. Earth Observ. Geoinform. 13, 277–291. doi:10.1016/j.jag.2010.11.004
Burton, C., Betts, R. A., Jones, C. D., Feldpausch, T. R., Cardoso, M., and Anderson, L. O. (2020). El Niño Driven Changes in Global Fire 2015/16. Front. Earth Sci. 8, 1–12. doi:10.3389/feart.2020.00199
Bwangoy, J.-R. B., Hansen, M. C., Roy, D. P., Grandi, G. D., and Justice, C. O. (2010). Wetland Mapping in the Congo Basin Using Optical and Radar Remotely Sensed Data and Derived Topographical Indices. Remote Sens. Environ. 114, 73–86. doi:10.1016/j.rse.2009.08.004
Cardil, A., De-Miguel, S., Silva, C. A., Reich, P. B., Calkin, D. E., Brancalion, P. H. S., et al. (2020). Recent Deforestation Drove the Spike in Amazonian Fires. Environ. Res. Lett. 15, 121003. doi:10.1088/1748-9326/abcac7
Cascio, W. E. (2018). Wildland Fire Smoke and Human Health. Sci. Total Environ. 624, 586–595. doi:10.1016/j.scitotenv.2017.12.086
Cohen, W. B., Yang, Z., Stehman, S. V., Schroeder, T. A., Bell, D. M., Masek, J. G., et al. (2016). Forest Disturbance across the Conterminous United States from 1985-2012: The Emerging Dominance of forest Decline. For. Ecol. Manage. 360, 242–252. doi:10.1016/j.foreco.2015.10.042
Curtis, P. G., Slay, C. M., Harris, N. L., Tyukavina, A., and Hansen, M. C. (2018). Classifying Drivers of Global forest Loss. Science 361, 1108–1111. doi:10.1126/science.aau3445
de la Barrera, F., Barraza, F., Favier, P., Ruiz, V., and Quense, J. (2018). Megafires in Chile 2017: Monitoring Multiscale Environmental Impacts of Burned Ecosystems. Sci. Total Environ. 637-638, 1526–1536. doi:10.1016/j.scitotenv.2018.05.119
FAO (2012). Global Ecological Zones for FAO forest Reporting: 2010 Update. Rome: Forest Resources Assessment Working Paper, Food and Agriculture Organization of the United Nations.
FAO (2020). Global Forest Resources Assessment 2020: Main Report. Rome: Food and Agriculture Organization of the United Nations.
Flannigan, M., Cantin, A. S., de Groot, W. J., Wotton, M., Newbery, A., Gowman, L. M., et al. (2013). Global Wildland Fire Season Severity in the 21st century. For. Ecol. Manage. 294, 54–61. doi:10.1016/j.foreco.2012.10.022
Gaveau, D. L., Salim, M. A., Hergoualc'h, K., Locatelli, B., Sloan, S., Wooster, M., et al. (2014). Major Atmospheric Emissions from Peat Fires in Southeast Asia during Non-drought Years: Evidence from the 2013 Sumatran Fires. Sci. Rep. 4, 6112–6117. doi:10.1038/srep06112
GFOI (2016). Integration of Remote-Sensing and Ground-Based Observations for Estimation of Emissions and Removals of Greenhouse Gases in Forests: Methods and Guidance From the Global Forest Observations Initiative. Edition 2.0. Rome: Food and Agriculture Organization.
Ghazoul, J., Burivalova, Z., Garcia-Ulloa, J., and King, L. A. (2015). Conceptualizing Forest Degradation. Trends Ecol. Evol. 30, 622–632. doi:10.1016/j.tree.2015.08.001
Giglio, L., Schroeder, W., and Justice, C. O. (2016). The Collection 6 MODIS Active Fire Detection Algorithm and Fire Products. Remote Sens. Environ. 178, 31–41. doi:10.1016/j.rse.2016.02.054
Giglio, L., Boschetti, L., Roy, D. P., Humber, M. L., and Justice, C. O. (2018). The Collection 6 MODIS Burned Area Mapping Algorithm and Product. Remote Sens. Environ. 217, 72–85. doi:10.1016/j.rse.2018.08.005
Giglio, L. (2007). Characterization of the Tropical Diurnal Fire Cycle Using VIRS and MODIS Observations. Remote Sens. Environ. 108, 407–421. doi:10.1016/j.rse.2006.11.018
Guindon, L., Bernier, P., Gauthier, S., Stinson, G., Villemaire, P., and Beaudoin, A. (2018). Missing forest Cover Gains in Boreal Forests Explained. Ecosphere 9 (1), e02094. doi:10.1002/ecs2.2094
Hansen, M. C., Potapov, P. V., Moore, R., Hancher, M., Turubanova, S. A., Tyukavina, A., et al. (2013). High-Resolution Global Maps of 21st-Century Forest Cover Change. Science 342, 850–853. doi:10.1126/science.1244693
Hansen, M. C., Wang, L., Song, X. P., Tyukavina, A., Turubanova, S., Potapov, P. V., et al. (2020). The Fate of Tropical forest Fragments. Sci. Adv. 6, eaax8574–10. doi:10.1126/sciadv.aax8574
Harvey, B. J., Donato, D. C., and Turner, M. G. (2016). Drivers and Trends in Landscape Patterns of Stand-Replacing Fire in Forests of the US Northern Rocky Mountains (1984-2010). Landscape Ecol. 31, 2367–2383. doi:10.1007/s10980-016-0408-4
Huo, L. Z., Boschetti, L., and Sparks, A. M. (2019). Object-based Classification of forest Disturbance Types in the Conterminous United States. Remote Sens. 11, 477. doi:10.3390/rs11050477
Hussain, M., and Mahmud, I. (2019). pyMannKendall: a Python Package for Non Parametric Mann Kendall Family of Trend Tests. Joss 4, 1556. doi:10.21105/joss.01556
Jenkins, M. J., Runyon, J. B., Fettig, C. J., Page, W. G., and Bentz, B. J. (2014). Interactions Among the Mountain Pine Beetle, Fires, and Fuels. For. Sci. 60, 489–501. doi:10.5849/forsci.13-017
Jolly, W. M., Cochrane, M. A., Freeborn, P. H., Holden, Z. A., Brown, T. J., Williamson, G. J., et al. (2015). Climate-induced Variations in Global Wildfire Danger from 1979 to 2013. Nat. Commun. 6, 7537. doi:10.1038/ncomms8537
Kasischke, E. S., and Stocks, B. J. (2000). Fire, Climate Change, and Carbon Cycling in the Boreal Forest. New York: Springer-Verlag.
Kharuk, V. I., Im, S. T., Ranson, K. J., and Yagunov, M. N. (2017). Climate-induced Northerly Expansion of Siberian Silkmoth Range. Forests 8, 301. doi:10.3390/f8080301
Krylov, A., McCarty, J. L., Potapov, P., Loboda, T., Tyukavina, A., Turubanova, S., et al. (2014). Remote Sensing Estimates of Stand-Replacement Fires in Russia, 2002-2011. Environ. Res. Lett. 9, 105007. doi:10.1088/1748-9326/9/10/105007
Liu, Z., Ballantyne, A. P., and Cooper, L. A. (2019). Biophysical Feedback of Global forest Fires on Surface Temperature. Nat. Commun. 10, 214–219. doi:10.1038/s41467-018-08237-z
Lizundia-Loiola, J., Otón, G., Ramo, R., and Chuvieco, E. (2020). A Spatio-Temporal Active-Fire Clustering Approach for Global Burned Area Mapping at 250 M from MODIS Data. Remote Sens. Environ. 236, 111493. doi:10.1016/j.rse.2019.111493
Mann, M. E., Rahmstorf, S., Kornhuber, K., Steinman, B. A., Miller, S. K., and Coumou, D. (2017). Influence of Anthropogenic Climate Change on Planetary Wave Resonance and Extreme Weather Events. Sci. Rep. 7, 45242. doi:10.1038/srep45242
Moritz, M. A., Batllori, E., Bradstock, R. A., Gill, A. M., Handmer, J., Hessburg, P. F., et al. (2014). Learning to Coexist with Wildfire. Nature 515, 58–66. doi:10.1038/nature13946
Morton, D. C., DeFries, R. S., Shimabukuro, Y. E., Anderson, L. O., Arai, E., del Bon Espirito-Santo, F., et al. (2006). Cropland Expansion Changes Deforestation Dynamics in the Southern Brazilian Amazon. Proc. Natl. Acad. Sci. 103, 14637–14641. doi:10.1073/pnas.0606377103
Olofsson, P., Foody, G. M., Herold, M., Stehman, S. V., Woodcock, C. E., and Wulder, M. A. (2014). Good Practices for Estimating Area and Assessing Accuracy of Land Change. Remote Sens. Environ. 148, 42–57. doi:10.1016/j.rse.2014.02.015
Olofsson, P., Arévalo, P., Espejo, A. B., Green, C., Lindquist, E., McRoberts, R. E., et al. (2020). Mitigating the Effects of Omission Errors on Area and Area Change Estimates. Remote Sens. Environ. 236, 111492. doi:10.1016/j.rse.2019.111492
Pickens, A. H., Hansen, M. C., Hancher, M., Stehman, S. V., Tyukavina, A., Potapov, P., et al. (2020). Mapping and Sampling to Characterize Global Inland Water Dynamics from 1999 to 2018 with Full Landsat Time-Series. Remote Sens. Environ. 243, 111792. doi:10.1016/j.rse.2020.111792
Potapov, P., Hansen, M. C., Laestadius, L., Turubanova, S., Yaroshenko, A., Thies, C., et al. (2017). The Last Frontiers of Wilderness: Tracking Loss of Intact forest Landscapes from 2000 to 2013. Sci. Adv. 3, e1600821–14. doi:10.1126/sciadv.1600821
Potapov, P., Hansen, M. C., Kommareddy, I., Kommareddy, A., Turubanova, S., Pickens, A., et al. (2020). Landsat Analysis Ready Data for Global Land Cover and Land Cover Change Mapping. Remote Sens. 12, 426. doi:10.3390/rs12030426
Pütz, S., Groeneveld, J., Henle, K., Knogge, C., Martensen, A. C., Metz, M., et al. (2014). Long-term Carbon Loss in Fragmented Neotropical Forests. Nat. Commun. 5, 5037. doi:10.1038/ncomms6037
Rifai, S. W., Li, S., and Malhi, Y. (2019). Coupling of El Nino Events and Long-Term Warming Leads to Pervasive Climate Extremes in the Terrestrial Tropics. Environ. Res. Lett. 14, 105002. doi:10.1088/1748-9326/ab402f
Roy, D. P., Boschetti, L., and Smith, A. M. S. (2013). “Satellite Remote Sensing of Fires,” in Fire Phenomena and the Earth System: An Interdisciplinary Guide to Fire Science. Editor C. M. Belcher (John Wiley & Sons).
San-Miguel-Ayanz, J., Moreno, J. M., and Camia, A. (2013). Analysis of Large Fires in European Mediterranean Landscapes: Lessons Learned and Perspectives. For. Ecol. Manage. 294, 11–22. doi:10.1016/j.foreco.2012.10.050
Schleeweis, K. G., Moisen, G. G., Schroeder, T. A., Toney, C., Freeman, E. A., Goward, S. N., et al. (2020). US National Maps Attributing forest Change: 1986-2010. Forests 11, 1–20. doi:10.3390/f11060653
Schroeder, W., Oliva, P., Giglio, L., and Csiszar, I. A. (2014). The New VIIRS 375 M Active Fire Detection Data Product: Algorithm Description and Initial Assessment. Remote Sens. Environ. 143, 85–96. doi:10.1016/j.rse.2013.12.008
Sleeter, B. M., Sohl, T. L., Loveland, T. R., Auch, R. F., Acevedo, W., Drummond, M. A., et al. (2013). Land-cover Change in the Conterminous United States from 1973 to 2000. Glob. Environ. Change 23, 733–748. doi:10.1016/j.gloenvcha.2013.03.006
Song, X.-P., Potapov, P. V., Krylov, A., King, L., Di Bella, C. M., Hudson, A., et al. (2017). National-scale Soybean Mapping and Area Estimation in the United States Using Medium Resolution Satellite Imagery and Field Survey. Remote Sens. Environ. 190, 383–395. doi:10.1016/j.rse.2017.01.008
Song, X.-P., Hansen, M. C., Potapov, P., Adusei, B., Pickering, J., Adami, M., et al. (2021). Massive Soybean Expansion in South America since 2000 and Implications for Conservation. Nat. Sustain. 4, 784–792. doi:10.1038/s41893-021-00729-z
Stephens, S. L., Westerling, A. L., Hurteau, M. D., Peery, M. Z., Schultz, C. A., and Thompson, S. (2020). Fire and Climate Change: Conserving Seasonally Dry Forests Is Still Possible. Front. Ecol. Environ. 18, 354–360. doi:10.1002/fee.2218
Strydom, S., and Savage, M. J. (2016). A Spatio-Temporal Analysis of Fires in South Africa. S. Afr. J. Sci. 112, 1–8. doi:10.17159/sajs.2016/20150489
Turubanova, S., Potapov, P. V., Tyukavina, A., and Hansen, M. C. (2018). Ongoing Primary forest Loss in Brazil, Democratic Republic of the Congo, and Indonesia. Environ. Res. Lett. 13, 074028. doi:10.1088/1748-9326/aacd1c
Tyukavina, A., Baccini, A., Hansen, M. C., Potapov, P. V., Stehman, S. V., Houghton, R. A., et al. (2015). Aboveground Carbon Loss in Natural and Managed Tropical Forests from 2000 to 2012. Environ. Res. Lett. 10, 074002. doi:10.1088/1748-9326/10/7/074002
Tyukavina, A., Hansen, M. C., Potapov, P. V., Stehman, S. V., Smith-Rodriguez, K., Okpa, C., et al. (2017). Types and Rates of forest Disturbance in Brazilian Legal Amazon, 2000-2013. Sci. Adv. 3, e1601047–16. doi:10.1126/sciadv.1601047
Tyukavina, A., Hansen, M. C., Potapov, P., Parker, D., Okpa, C., Stehman, S. V., et al. (2018). Congo Basin forest Loss Dominated by Increasing Smallholder Clearing. Sci. Adv. 4, eaat2993. doi:10.1126/sciadv.aat2993
van Lierop, P., Lindquist, E., Sathyapala, S., and Franceschini, G. (2015). Global forest Area Disturbance from Fire, Insect Pests, Diseases and Severe Weather Events. For. Ecol. Manage. 352, 78–88. doi:10.1016/j.foreco.2015.06.010
Vogelmann, J. E., Kost, J. R., Tolk, B., Howard, S., Short, K., Chen, X., et al. (2011). Monitoring Landscape Change for LANDFIRE Using Multi-Temporal Satellite Imagery and Ancillary Data. IEEE J. Sel. Top. Appl. Earth Observ. Remote Sens. 4, 252–264. doi:10.1109/jstars.2010.2044478
Walker, X. J., Baltzer, J. L., Cumming, S. G., Day, N. J., Ebert, C., Goetz, S., et al. (2019). Increasing Wildfires Threaten Historic Carbon Sink of Boreal forest Soils. Nature 572, 520–523. doi:10.1038/s41586-019-1474-y
Wigneron, J. P., Fan, L., Ciais, P., Bastos, A., Brandt, M., Chave, J., et al. (2020). Tropical Forests Did Not Recover from the strong 2015-2016 El Niño Event. Sci. Adv. 6, eaay4603–11. doi:10.1126/sciadv.aay4603
Keywords: forest loss, fire, trends, Landsat, mapping, sampling
Citation: Tyukavina A, Potapov P, Hansen MC, Pickens AH, Stehman SV, Turubanova S, Parker D, Zalles V, Lima A, Kommareddy I, Song X-P, Wang L and Harris N (2022) Global Trends of Forest Loss Due to Fire From 2001 to 2019. Front. Remote Sens. 3:825190. doi: 10.3389/frsen.2022.825190
Received: 30 November 2021; Accepted: 14 February 2022;
Published: 15 March 2022.
Edited by:
Garik Gutman, National Aeronautics and Space Administration (NASA), United StatesReviewed by:
Yufang Jin, University of California, Davis, United StatesMark A. Cochrane, University of Maryland Center for Environmental Science (UMCES), United States
Richard Houghton, Woodwell Climate Research Center, United States
Copyright © 2022 Tyukavina, Potapov, Hansen, Pickens, Stehman, Turubanova, Parker, Zalles, Lima, Kommareddy, Song, Wang and Harris. This is an open-access article distributed under the terms of the Creative Commons Attribution License (CC BY). The use, distribution or reproduction in other forums is permitted, provided the original author(s) and the copyright owner(s) are credited and that the original publication in this journal is cited, in accordance with accepted academic practice. No use, distribution or reproduction is permitted which does not comply with these terms.
*Correspondence: Alexandra Tyukavina, atyukav@umd.edu