Serengeti’s futures: Exploring land use and land cover change scenarios to craft pathways for meeting conservation and development goals
 Rebecca W. Kariuki1,2,3*
  Claudia Capitani4
  Linus K. Munishi1
  Anna Shoemaker5,6
  Colin J. Courtney Mustaphi7
  Njonga William8
  Paul J. Lane9,10
  Rob Marchant2
- 1School of Life Sciences and Bio-Engineering, Nelson Mandela - African Institution of Science and Technology, Arusha, Tanzania
- 2Department of Environment and Geography, York Institute for Tropical Ecosystems, University of York, York, United Kingdom
- 3Rachel Carson Center for Environment and Society, Ludwig Maximilian University of Munich, Munich, Germany
- 4Joint Research Centre, Ispra, Italy
- 5Professional Archaeological Consulting Services, Terra Archaeology, Victoria, BC, Canada
- 6Department of Archaeology and Ancient History, Uppsala University, Uppsala, Sweden
- 7Department of Environmental Sciences, Geoecology, University of Basel, Basel, Switzerland
- 8Department of Land and Natural Resources, Tarime District Council, Tarime-Mara, Tanzania
- 9Department of Archaeology, University of Cambridge, Cambridge, United Kingdom
- 10School of Geography, Archaeology and Environmental Science, University of the Witwatersrand, Johannesburg, South Africa
Rapid land use transformations and increased climatic uncertainties challenge potential sustainable development pathways for communities and wildlife in regions with strong economic reliance on natural resources. In response to the complex causes and consequences of land use change, participatory scenario development approaches have emerged as key tools for analyzing drivers of change to help chart the future of socio-ecological systems. We assess stakeholder perspectives of land use and land cover change (LULCC) and integrate co-produced scenarios of future land cover change with spatial modeling to evaluate how future LULCC in the wider Serengeti ecosystem might align or diverge with the United Nations’ Sustainable Development Goals and the African Union’s Agenda 2063. Across the wider Serengeti ecosystem, population growth, infrastructural development, agricultural economy, and political will in support of climate change management strategies were perceived to be the key drivers of future LULCC. Under eight scenarios, declines in forest area as a proportion of total land area ranged from 0.1% to 4% in 2030 and from 0.1% to 6% in 2063, with the preservation of forest cover linked to the level of protection provided. Futures with well-demarcated protected areas, sound land use plans, and stable governance were highly desired. In contrast, futures with severe climate change impacts and encroached and degazetted protected areas were considered undesirable. Insights gained from our study are important for guiding pathways toward achieving sustainability goals while recognizing societies’ relationship with nature. The results highlight the usefulness of multi-stakeholder engagement, perspective sharing, and consensus building toward shared socio-ecological goals.
Introduction
Land use and land cover change (LULCC) processes and trends reflect the influence of biophysical, socio-economic, and governance factors in driving environmental change at local, regional, and national scales. Economic globalization and infrastructure development have led to deforestation, agricultural expansion, urbanization, and increased habitat fragmentation (Forman and Alexander, 1998; Lambin and Meyfroidt, 2011). The environmental and climatic impacts of LULCC involve the alteration of local and regional climates through greenhouse gas emissions (Ramankutty et al., 2008; Pörtner et al., 2021), the fragmentation of wildlife habitats, environmental degradation, and reductions in the ability of species to move to habitats with favorable climates when shifts in ranges occur due to climate change (Aukema et al., 2017). LULCC laws, norms, and policies are also important and can mitigate the impacts of land cover change and provide a sense of control and ownership to communities, thereby enhancing synergies between economic development and environmental sustainability (Tesfaw et al., 2018). The history of human land use, which includes hunting, burning, and cultivation among others, can account for changes in biodiversity, climate, and ecosystem processes (Ellis et al., 2013).
The interaction between land use, climate, and socio-economic changes influences the resilience and the inherent sustainability of social-ecological systems. Whereas agricultural and infrastructural development are necessary to meet the food, transport, and market demands of rapidly growing populations, climate change exacerbates negative environmental impacts brought by LULCC. Consequently, solutions to sustainable land uses ultimately involve trade-offs between food production, development, and environmental sustainability (Ramankutty et al., 2008). Africa holds 60% of global uncultivated arable land (AfDB and WWF, 2015), which is rapidly being converted to agriculture, either through large-scale enterprise or smallholder expansion (Estes et al., 2012; Aukema et al., 2017), to meet food production requirements for growing populations and markets (van Soesbergen et al., 2017). Given the pivotal role of land, there is an urgent need for understanding LULCC drivers and the consequences of change for the sustainability of African landscapes and societies. This need is particularly important for conservation as the Convention on Biological Diversity and Intergovernmental Science-Policy on Biodiversity and Ecosystem Services decisions depend on framing some of the challenges to sustain space for wildlife, people, and development. An estimated 6%–11% of biodiversity in Africa is further projected to be pushed out of current dispersal ranges in protected areas by the mid-21st century due to climate change (Tabor et al., 2018), underscoring the necessity for assessing future LULCC and probable trade-offs between agricultural production and conservation in densely populated and biodiversity rich landscapes, such as those in northern Tanzania (Courtney Mustaphi et al., 2019).
Protected areas in East Africa cover 28% of the total land surface with nearly 50% of Tanzania’s land being under some form of protected area designation (UNEP-WCMC and IUCN, 2018). However, some protected areas are small in relation to wildlife dispersal ranges (Sinclair et al., 2015), and others lack the landscape heterogeneity required to accommodate wildlife dispersal when climate-induced habitat changes occur (Tabor et al., 2018), implying that buffer zones should be protected and the corridors between protected areas made habitable (Shackelford et al., 2015).
Protected areas in East Africa also influence land use options for adjacent communities whose livelihoods depend on natural resources (Estes et al., 2012; Kariuki et al., 2018) and need to be managed sustainably to protect biodiversity and support rural livelihoods. However, “hard boundaries” established between boundaries of protected areas and community land by rapidly growing human populations and agricultural and urban expansion fragment wildlife habitats and cause the overutilization of resources (Reid, 2012; Veldhius et al., 2019), which, in turn, erodes the value of protected areas. With limited understanding of sustainable approaches to managing rangelands for biodiversity and rural livelihoods (McGranahan and Kirkman, 2013), and the fact that protected areas discourage agricultural production and natural resource extraction, there are concerns about the potential of protected areas to alleviate poverty and support development among adjacent communities (Ferraro et al., 2011). Recognizing the linkages between conservation, climate, and land use is vital for guiding policies and planning for multifunctional social-ecological systems (Pörtner et al., 2021), to create new and diversified approaches to conserved areas (Obura et al., 2021), especially under anticipated climatic and socio-economic changes.
Determining future LULCC is complex and uncertain and often utilizes perspectives from diverse stakeholders to identify the drivers and consequences of alternate LULCC scenarios. Involving diverse stakeholders in scenario development incorporates multiple perspectives grounded in local knowledge, promotes social learning, and improves the quality and relevance of the scenarios (Saito et al., 2019). Scenarios are coupled with models to translate the consequences of projected social-ecological change for people and environments (Aguiar et al., 2019) and to explore appropriate policies and management interventions for meeting the sustainability targets of global development agendas (Saito et al., 2019). Together, scenarios and models connect local and expert knowledge with data in a framework that is logical, consistent, and reproducible (Nicholson et al., 2019). In East Africa, LULCC scenarios and models have assessed the impacts of future LULCC on natural capital (Capitani et al., 2019), agricultural development and biodiversity (van Soesbergen et al., 2017), and there is a need to connect the environmental impacts of future LULCC scenarios with sustainable development.
This paper has an objective of linking place-based visions for the future with continental and international sustainability agendas. The study uses insights from a diverse range of stakeholders to develop future LULCC scenarios and models for northwestern Tanzania around the wider Serengeti ecosystem and assesses the implications of future LULCC on the United Nations’ Sustainable Development Goals (SDGs) and African Union’s (AU) Agenda 2063 sustainability targets. Importantly, the study demonstrates how local to global approaches can be used for developing new conservation paradigms in a world that is altered by climatic and economic factors, to evaluate what alternatives are expected, plausible, and desired or undesired and to provide a stakeholder-driven starting point (not ending point) for further negotiations and discussion. These insights are applicable across the globe and particularly in contexts where conservation and human development goals need to coexist rather than being in conflict. Specific objectives of this paper are as follows: to 1) assess the factors and events that drove historical land use change over the past 100 years and identify possible drivers of future LULCC; 2) co-produce scenarios of future LULCC for 2030 and 2063; 3) integrate co-produced scenario narratives with spatial modeling to determine spatial trends and the possible extents of land cover change for 2030 and 2063; 4) assess the implications for co-produced scenarios of future LULCC in meeting SDG 13 (climate action), SDG 15 (life on land), and SDG 2 (zero hunger) targets, and AU Agenda 2063 goal 7 (environmentally sustainable and climate-resilient economies and communities) and goal 6 (modern agriculture for increased productivity; Figure 1) targets; and 5) identify desirable and undesirable future for communities in northwestern Tanzania in 2030 and 2063.
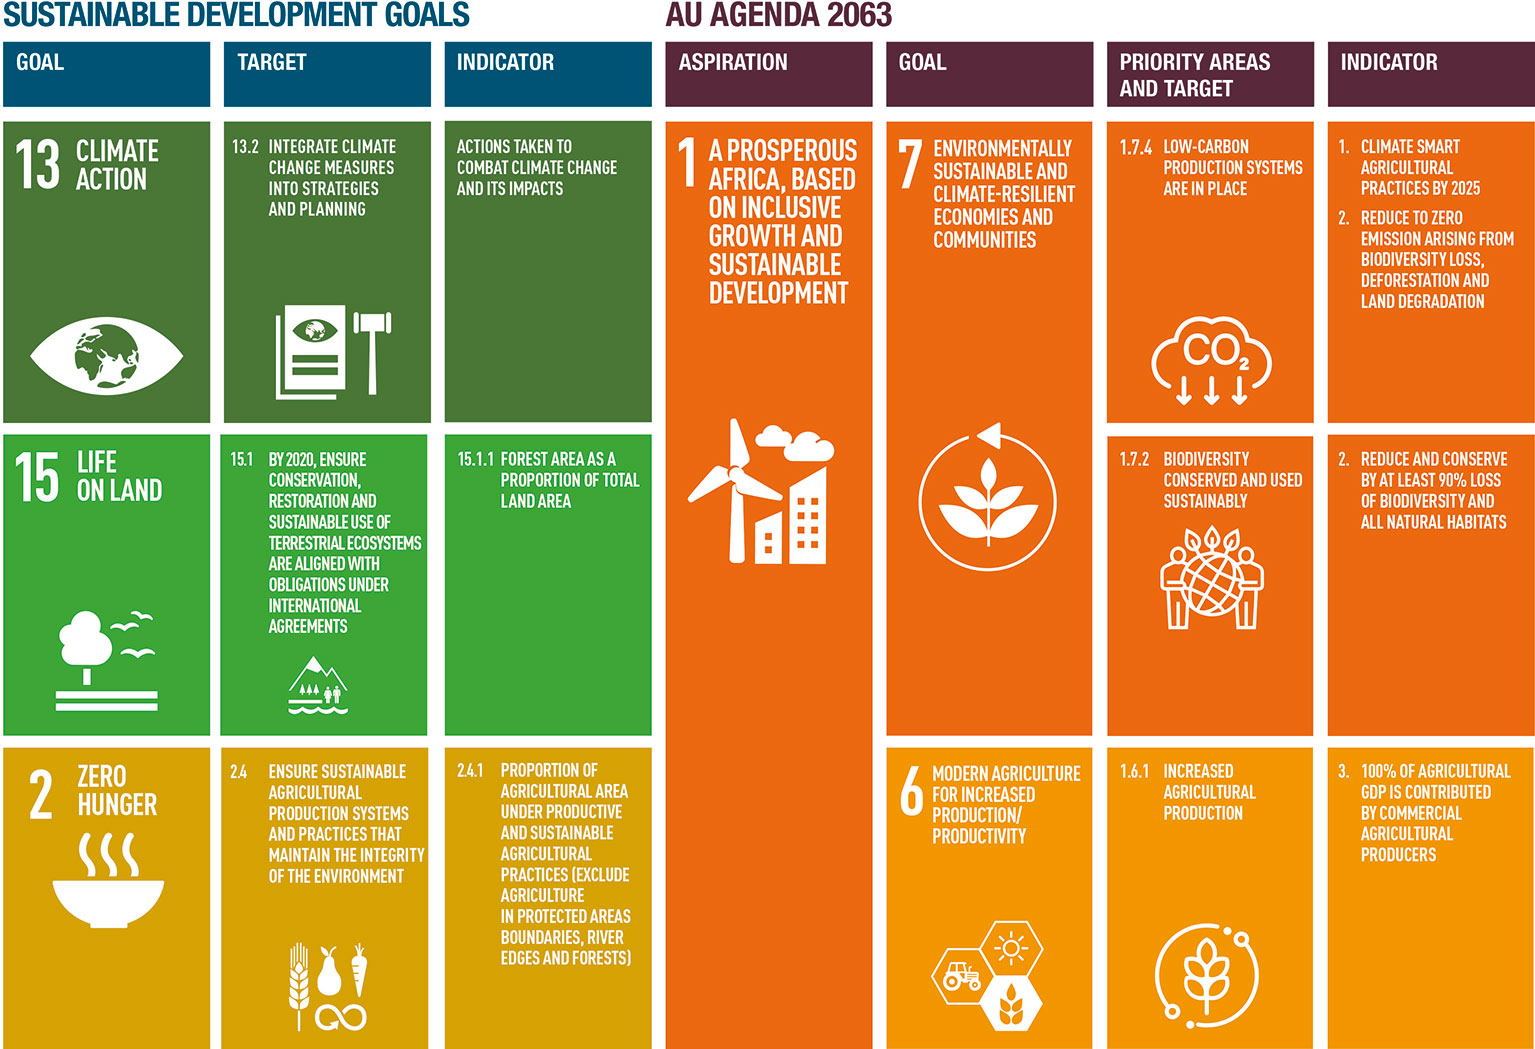
Figure 1 Link between the Sustainable Development Goals (SDG) targets, and indicators for 2030 (UN, 2015) and AU Agenda 2063 aspiration, goals, priority areas and targets, and indicators (AUC, 2015) used in this study.
Methods
Geographical and environmental scope
The Serengeti ecosystem comprises a series of protected areas surrounded by community lands and can be divided into 1) northern and eastern and 2) southern and western Serengeti (Figure 2). The northern and eastern Serengeti area covers 36,590 km2 and includes the Ngorongoro, Serengeti, Tarime, Rorya, Musoma, Musoma Urban, Bunda, and Butiama districts. The southern and western Serengeti study area covers 33,138 km2 and includes Meatu, Kishapu, Maswa, Kwimba, Magu, Busega, and Itilima districts.
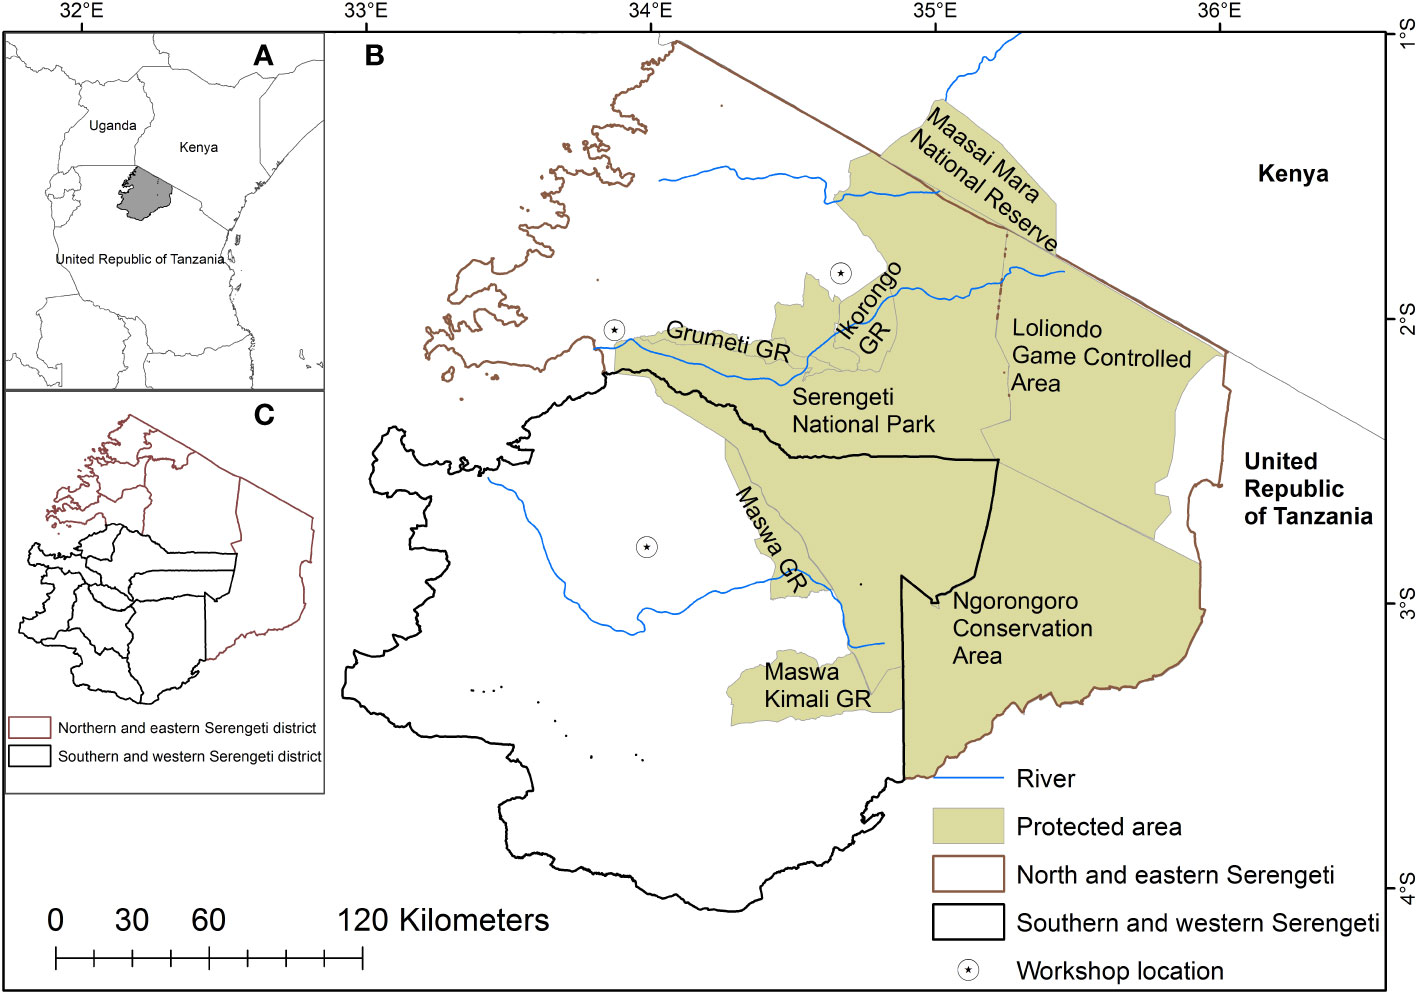
Figure 2 The study covered the wider Serengeti ecosystem located in northwestern Tanzania (A). The study area was divided into 1) northern and eastern Serengeti (shown by brown boundaries) and 2) southern and western Serengeti (shown by black boundaries) in images (B) and (C). The Serengeti National Park cuts across the two study areas. GR represents Game Reserve.
The protected areas that comprise the Serengeti ecosystem have varying management structures and jurisdictions. The 14,763 km2 Serengeti National Park (SNP) is managed by the Tanzania National Parks Authority and only allows wildlife tourism. The Ngorongoro Conservation Area (NCA) and the Loliondo Game Controlled Area (LGCA) accommodate multiple land uses including wildlife conservation, livestock keeping, and human settlement. LGCA also permits agriculture and wildlife hunting. West of SNP are the Ikorongo, Grumeti, Maswa, and Maswa Kimali Game Reserves (Figure 2), which are managed by the Tanzania Wildlife Management Authority. The Ikona and Makao Wildlife Management Areas (WMAs), located between the Game Reserves, are run by the local community and used for wildlife conservation, livestock keeping, agriculture, and human settlement.
The climate of Serengeti is characterized by two rainy seasons: the long rains (March to May) and the short rains (November to December) and a rainfall gradient of 600 mm year−1 in the southeast to 1,000 mm year−1 in the northwest (Estes et al., 2012). The northern and western extents of SNP are characterized by diverse woody and savanna plant species, whereas the southern area has shallow volcanic soils and is grassland dominated (Estes et al., 2012; Scoon, 2018), apart from Maswa Game Reserve that is flatter and has alluvial soils and dense Acacia woodland (Sinclair et al., 2015). The changing distribution of vegetation resources between the rainfall seasons drives the annual migration of Serengeti’s two million wildebeest, zebras, and gazelles from the grasslands in Serengeti to the savanna woodlands of the Mara ecosystem in Kenya (Holdo et al., 2011). The eastern, northern, and southern parts of the Serengeti are dry and largely occupied by pastoralists, whereas the wetter western Serengeti is occupied by smallholder farmers and agro-pastoralists (Sinclair et al., 2015). The Mara-Serengeti-Ngorongoro is a key conservation landscape valued for wildlife, paleoanthropological, archeological, and geological attributes, attracting innovative approaches to sustainable development and governance of natural resources (Reid, 2012; Sinclair et al., 2015; Scoon, 2018; Bushozi, 2019).
Demographic records show that the population of the Serengeti district has increased by 25% between 2002 and 2012 (Kisingo et al., 2016). The most densely populated areas of the Serengeti are around Lake Victoria, having an annual growth rate of 3.1% between 1988 and 2002 (Estes et al., 2012). Population growth has led to agricultural encroachment along protected area boundaries, increased human-wildlife conflicts, and increased livestock-wildlife disease transmission (Kisingo et al., 2016).
Temporal scope
The year 1927 was used as a historical baseline—a choice that was made due to this being the approximate extent of people’s lived memories in the community today. The future time horizons are 2030 and 2063 to match the targeted dates for the SDG Agenda 2030 and the AU Agenda 2063 (Figure 1). The goals and targets of the SDG and AU agendas overlap in issues related to poverty eradication, environmental sustainability, climate action, and economic development. However, Agenda 2030 is focused on addressing climate change and inequalities in education, healthcare, and infrastructure, whereas Agenda 2063 focuses on democracy and continental integration.
During the decades covered by this study, East Africa has experienced warmer temperatures, declining rainfall, drier long rainy seasons, wetter short rainy seasons, altered seasonality, and frequent and severe droughts (Marchant et al., 2018; Haile et al., 2019). Documented records for the Serengeti ecosystem indicate a decline in wet season rainfall for 40 years from 1960 and an increase in dry season rainfall between 1931 and 2001 (Bartzke et al., 2018). Future climate projections indicate a warmer and wetter East Africa (IPCC, 2021) with early cessation of the long rainy season, late onset and cessation of the short rainy season, wetter short rainy season, and increased frequency, duration, and intensity of droughts driven by high seasonal and interannual variability of the climate system (Haile et al., 2019). In the near future, 2011–2040, Tanzania is projected to have wetter short rainy seasons and a decline of up to 420 mm over the long rainy season (Gebrechorkos et al., 2019). In the mid-future, 2041–2070, precipitation during long rainy seasons in Tanzania is projected to reduce further, by up to 500 mm (Gebrechorkos et al., 2019) with the Serengeti ecosystem projected to have wetter short rainy season and drier long rainy season in 2055 compared with 1975 under Representative Concentration Pathway (RCP) 4.5 and 8.5 (Platts et al., 2015; Figure 3).
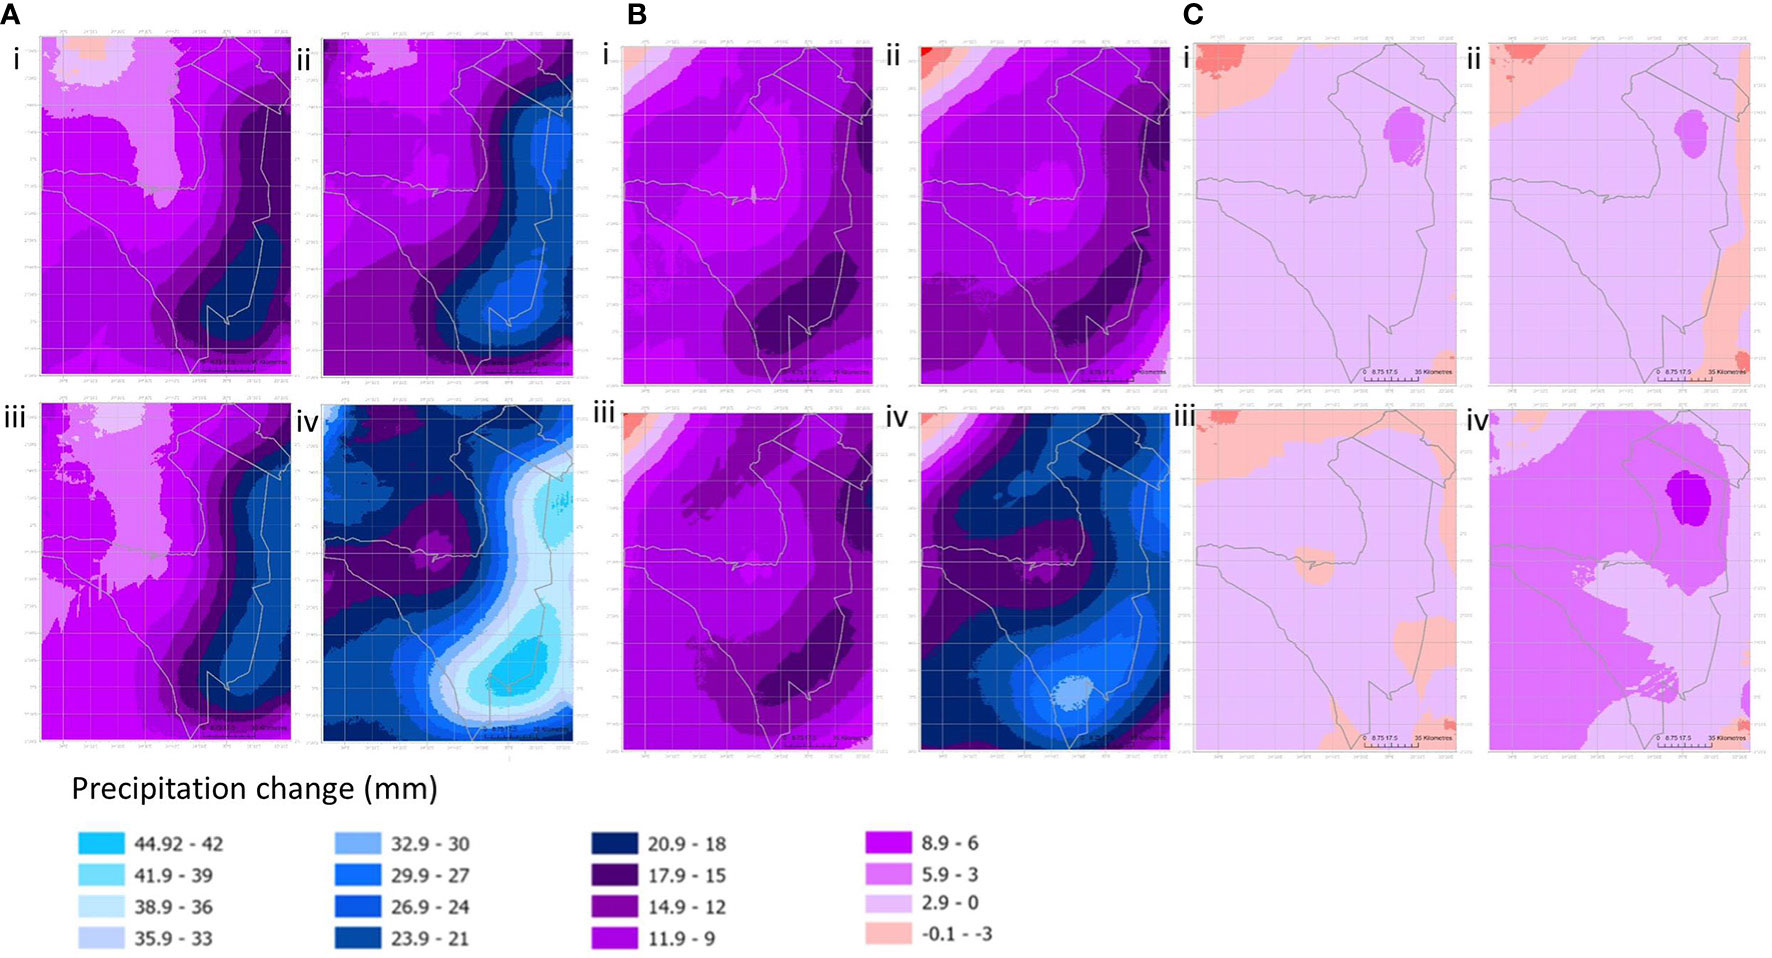
Figure 3 Predicted changes in mean precipitation during the short rainy season (A), long rainy season (B) and dry season (C) for the wider Serengeti ecosystem. For each panel, there is a comparison of mean precipitation change from 1975 to (i) to 2055 under RCP4.5, (ii) to 2085 following RCP4.5, (iii) to 2055 following RCP8.5, and (iv) to 2085 following RCP8.5. All are multiple-model ensemble derived from AFRICLIM (Platts et al., 2015; Miatt, 2022).
Stakeholder selection and stakeholder engagement workshops
To account for variation in LULCC perceptions across the Serengeti ecosystem, we held two workshops and selected 24 stakeholders to represent northern and eastern Serengeti and 30 stakeholders to represent southern and western Serengeti. All stakeholders (Supplementary Table 1) were selected by researchers from the Adaptation and Resilience to Climate Change (ARCC) project and were chosen to represent diverse voices with varied expertise and lived experience in issues of land use change, livestock grazing, agriculture, wildlife conservation, protected area management, natural resource management, infrastructure, and economic development. The selection also accounted for the heterogeneous social agents and the high ecological variability characteristic of resource-dependent social-ecological systems (Gray et al., 2015). Stakeholders were drawn from government bodies, non-governmental bodies, community-based organizations, local communities (comprising farmers, pastoralists, hunter-gatherers, and businesses), and academic and research institutions (Supplementary Table 1).
The northern and eastern Serengeti workshop was held in Mugumu on 5–7 August 2019 and the southern and western Serengeti workshop in Bariadi on 28–30 August 2019. Each workshop took 3 days and had similar formats that involved presentations, breakout discussion groups, plenary discussions, and individual activities.
Historical information and co-production of scenario narratives
Co-production of future LULCC scenarios followed the Kesho framework (Capitani et al., 2016; Kariuki et al., 2021), to incorporate stakeholders’ perspectives within spatial modeling to produce qualitative, quantitative, and spatial scenarios of future LULCC. The workshops started by participants discussing and identifying a timeline, based on living memories, of key events that shaped past LULCC in Serengeti. In northern and eastern Serengeti, the base years selected for the timeline were 1928–1930 when the Serengeti ecosystem, including the Ngorongoro ecosystem, was declared a game reserve. Participants at the southern and western Serengeti workshop identified 1927, when a key trading center called Maswa was transferred to its current location, as the base year for their timeline. Activities then identified and ranked drivers of historical and present LULCC.
On the second day, participants engaged in the Kesho scenario development approach for envisioning future change, discussed how past drivers of LULCC might be linked to future LULCC drivers, identified key drivers of LULCC scenarios for 2030 and 2063, developed a 2 × 2 scenario matrix and scenario narratives (van't Klooster and van Asselt, 2006) for each scenario at 2030 and in 2063, analyzed the plausibility and consistency of the scenario narratives, and explored attributes of desirable and undesirable future for the Serengeti ecosystem. Prior to developing the scenario matrix and narratives, participants and ARCC researchers discussed documented, observed, and projected climatic variability for the Serengeti ecosystem. The objective of the discussion was to provide a common understanding of ongoing and projected climate change trends. As the workshops were focused on developing LULCC scenarios, participants only discussed the potential influence of climate change in driving future LULCC patterns but not on the suitability of land for different uses in the future.
The 2 × 2 scenario matrix identified plausible drivers of future change, ranked the identified LULCC drivers from high to low, and selected two drivers with the highest rank (van't Klooster and van Asselt, 2006; Kariuki et al., 2021). Each workshop’s participants perceived the impacts of several drivers of future LULCC as significant. Consequently, several 2 × 2 matrices were produced by different break out groups. These were presented in plenary discussion and the final 2 × 2 matrix agreed on that would be used to co-produce the LULCC scenarios based on consensus among the participants. For northern and eastern Serengeti, the two drivers identified by participants to have the greatest influence on future LULCC were 1) population growth and associated infrastructure development and 2) political will in supporting climate change adaptation and mitigation strategies. Two extreme and opposing conditions that would characterize each axis were identified by the participants. The extreme conditions for population growth and infrastructure development were identified as “high” and “low”, whereas that for political will in supporting climate change adaptation and mitigation strategies were identified as “strong” and ‘weak”. Combining the conditions characterizing the two axes formed four scenarios: 1) high population growth and infrastructure development and weak political will in supporting climate change adaptation and mitigation strategies; 2) high population growth and infrastructure development and strong political will in supporting climate change adaptation and mitigation strategies; 3) low population growth and infrastructure development coupled with weak political will in supporting climate change adaptation and mitigation strategies; and 4) low population growth and infrastructure development coupled with strong political will in supporting climate change adaptation and mitigation strategies. The participants named scenario 1 “Wasiwasi” (“Uneasiness”), scenario 2 “Parks and People”, scenario 3 “The Dying Giant”, and scenario 4 “Life is Good” (Supplementary Figure 1). For southern and western Serengeti, participants identified that the two most important drivers of future LULCC would be 1) population growth described as either “high” or “low” and 2) the environmental state of the agricultural economy described as being “sustainable” or “unsustainable”. Participants defined a sustainable agricultural economy as one that meets the food needs of societies, is economically viable, integrates ecologically sound farming methods (such as agroforestry and mixed cropping), and uses climate smart strategies such as water harvesting. An unsustainable agricultural economy was defined as one with negative environmental impacts, food insecurity, basic climate smart agricultural technology and policies, and an inability to combat poverty and improve the livelihoods of farmers. The descriptions of the four scenarios for southern and western Serengeti represented by the 2 × 2 scenario matrix were 1) high population growth and an unsustainable agricultural economy, 2) high population growth and a sustainable agricultural economy, 3) low population growth and an unsustainable agricultural economy, and 4) low population growth and a sustainable agricultural economy. The participants named scenario 1 “Tutaponaje?” (“How will we recover?”), scenario 2 “Hamasika” (“add diligence”), scenario 3 “Tujikomboe” (“Let us redeem ourselves”), and scenario 4 “Yajayo Yanatufurahisha” (“The future makes us happy”; Supplementary Figure 1).
On the third day, participants identified the land cover change that would occur under each scenario from 2019 to 2030 and 2030 to 2063. For each of these time periods, participants also identified where they believed the land cover change would occur, what would drive the land transformation, and the percent likelihood of occurrence of each expected change by the years 2030 and 2063. To establish the current extent of different land cover types in the study area and to assign the percent likelihood of land cover change in the future, participants were provided with the current (2019) land cover map of the study area. Participants then discussed the likelihood of land transformation in groups and reached a consensus that considered a wide range of factors that would potentially lead to each land cover transformation before assigning a likelihood of change. To differentiate the influence of high and low population growth and their associated impacts across different scenarios, participants factored in the influence of a high or low population growth through the score (percentage) they assigned to the likelihood of future land cover change. For instance, under high population growth scenarios, land cover changes that were anticipated to increase in the future were assigned a higher percent likelihood of change and those anticipated to decrease given a lower score.
Data sets, scenario modeling, and scenario outputs validation
Simulations of land cover change scenarios at 2030 and 2063 did not directly involve participants, rather the process integrated insights from the scenario narratives generated in the workshops ( Supplementary Text 1) and the percent likelihood of anticipated land cover change by the participants, with secondary data sources. Quantitative outputs for the scenarios were produced using ESRI ArcMap 10.6 and R Core team (2019) software. Spatial data on elevation (Jarvis et al., 2008), crop suitability (URT, 2020), human population (WorldPop, 2013), distance to roads (SEDAC, 2020), distance to mines (Geological and Mineral Information System, 2020), distance to protected area boundaries (UNEP-WCMC and IUCN, 2018), distance to agricultural areas (Buchhorn et al., 2019), distance to built-up areas (Buchhorn et al., 2019), grazing impact (Robinson et al., 2014), and land cover in 2019 (Buchhorn et al., 2019) were clipped to the study area extent, the vector layers converted to raster layers, and all layers converted to a common spatial resolution of 0.00083333 decimal degrees (approximately 100 m). Human population was projected to 2030 and 2063 using the average annual population growth rate of 2.7% in Tanzania that is in line with the regional population growth rates (Estes et al., 2012; Kisingo et al., 2016). The crop suitability layer comprised the climatic and environmental attributes such as rainfall amount, length of rainy season, temperature, soil types, and soil pH and accounted for the environmental impacts on crop production.
The spatial layers had different units of measurements and were standardized by reclassifying each raster into categories from 1 to 8, which depicted the range of likelihood of land cover change from the lowest to the highest. The standardized layers were then used to create composite indicator layers (Trogu and Campagna, 2018) for each type of land cover change under each scenario in 2030 and 2063. The composite indicator for each type of anticipated land cover change under each scenario was produced by a linear combination of the standardized specific variables that are expected to drive that type of land cover change. Constraining factors were accounted for by converting them into mask (binary, 0 or 1) or weighted (continuous, 0–1) layers (Capitani et al., 2016). Note that the composite indicator does not directly reflect the key drivers of land cover change (nor the main scenario axes) rather the biophysical and socio-economic rules that can be identified as associated with the drivers and expected changes. The composite indicators were developed using standardized spatial layers of environmental and socio-economic variables and not participant perspectives. Participant perspectives informed what areas of the composite indicators would be converted to a different land cover under various scenarios.
To approximate the possible spatial extent of land cover change under each scenario in 2030 and 2063, the future demands on land for specific uses were calculated on the basis of projected estimates from secondary data sources (Supplementary Text 2). Future agricultural and livestock grazing land demands were estimated from the Food and Agricultural Organization (FAO) agricultural and livestock production land demand scenarios (FAO, 2018; Supplementary Text 2). The FAO scenarios are factored in to capture the growing influence of the agro-ecological growth; these incorporate climate change to calculate potential future land demand for food and livestock production of the wider agricultural sector. Specifically, FAO developed three scenarios: 1) the “Business as Usual” scenario associated with Representative Concentration Pathway (RCP) 6.0 and an increase of 3°C–4°C temperature by 2100, 2) the “Towards Sustainability” scenario associated with RCP 4.5 and a temperature increase of < 3°C by 2100, and 3) the “Stratified societies” scenario associated with RCP 8.5 and an average temperature increase of 4°C–5°C. Wood demand and wood loss for different scenarios were calculated using annual per capita household wood demands, annual per capita industrial wood demands, annual per capita wood loss from LULCC, annual per capita illegal felling for charcoal or lumber wood demands, and annual population growth rates for the Serengeti ecosystem (URT, 2012; MNRT, 2015; Supplementary Text 2). An annual urbanization growth rate of 5.2% year−1 (MNRT, 2015) was used to estimate built-up area expansion.
The land demand estimates provided the figures for how much change is going to happen in each scenario, but not on which land cover classes are going to be converted to fulfill that demand. Participants perspectives on the percent likelihood of future land cover change were then used when modeling the scenario to allocate the number of pixels that would be changed following the land demand estimates to the final land cover class over different baseline land cover classes. For instance, where the estimated land demand was high and participants assigned a higher percent likelihood of change, more pixels were changed from one land cover class to another, and where participants assigned a lower percent likelihood of change, fewer pixels were converted. Conversion from one land cover category to another was done sequentially in R software. Various constraints, raised by the participants, were incorporated in the modeling. First, the SNP and the NCA would continue receiving high government protection and enforcement that would prohibit direct human-induced LULCC inside the protected areas. Second, encroachment along SNP’s and NCA’s boundaries could occur to 500 m inside the border at 2030 and up to 5000 m at 2063. Third, built-up areas could not be converted to forest, shrubland, grassland, or agricultural land. Fourth, the sequence of land cover conversion would be forest, shrubland, grassland, agriculture, and built-up. Finally, high mining impacts and livestock grazing pressure would increase sparse vegetation and bare ground.
Following the simulation of the scenario outputs, a subset of participants from the two Serengeti workshops was invited to a scenario dissemination and validation workshop on 10–11 December 2020, in Bunda (Figure 2). At the workshop, ARCC researchers disseminated the results and discussed the simulated results with the participants, who then provided feedback on the simulated scenarios. Specifically, they gave feedback on whether the type and extent of simulated land cover change in 2030 and 2063 under each scenario was expected, realistic, and possible according to their consensus-driven estimate of land cover transformation from the first workshop. Where the participants agreed with the simulated scenario maps, no modifications were made but where they recommended a correction in either the type or extent of the land cover change, the simulated scenario maps were amended to reflect the feedback given. Other feedback from the participants included the reiteration that no farming was expected inside the SNP and NCA in 2030 and 2063 because they would still be under strict government protection. However, encroachment along the boundaries was expected for both time horizons.
Results
Key events that have shaped past and present LULCC patterns in Serengeti
Across the Serengeti ecosystem, key events perceived to shape LULCC were associated with climate, conservation, wildlife tourism, animal diseases, discovery and/or establishment of mining sites, new government policies, and economic initiatives (Figure 4). Climate-related events were associated with droughts in 1987–1988, 1994, 2006, and 2009 and the El Niño episode in 1997–1998 that reduced livestock numbers and livestock herding. The participants recalled, in particular, the 2006 drought that devastated livestock production in northern Tanzania and that President Jakaya Kikwete donated cows to families in Longido, Monduli, and Ngorongoro in 2007 to help them rebuild herds. Events associated with enhancing wildlife conservation land use included the designation of Serengeti as a Game Reserve in 1928–1930 and as a National Park in 1940; the designation of Maswa as a Game Controlled Area in 1962, as a Game Reserve in 1974 and changes in its boundaries in 1966, 1974, 1976, 1981/1983, and 1998; the establishment of National Parks in the 1950s; and the establishment of WMAs from 2002. Formation of protected areas converted agricultural, settlement, and livestock grazing land use to wildlife conservation land use. The establishment of Mweka wildlife college as a pioneer institution to train African wildlife managers in 1963 and anti-poaching initiatives by Tanzania’s government, namely, “Operation Uhai” in 1989 and “Operation Tokomeza” in 2013, reduced the loss of wildlife numbers. Environmental restoration programs, such as the Lake Victoria Environmental Management Program (LVEMP) of 1992 to 2017 and the “Shinyanga Soil Conservation Programme” that ran from 1986 to 2004, prevented land use change in wetlands, increased forest cover in unprotected areas, and increased pasture for livestock herders. Government policies perceived to drive LULCC involved the enactment of policies related to national economic development and the resettlement of people; examples include the Arusha Declaration of 1967 that was a socialist policy that largely advocated for collective ownership and use of natural resources and the Villagization (Ujamaa) Policy of 1974 that governed the distribution of settlements, agricultural land, infrastructure, and markets. The National Land Management Policy of 1995 was perceived to have provided the foundation for land use and land management strategies in Tanzania. Regulations on preserving wildlife corridors, dispersal areas, and buffer (integration) zones set up in 2018 were perceived as instrumental in conserving wildlife spaces within village land and reducing population pressures at protected area boundaries. Socio-economic factors related to improvement of roads, development of new roads, the collapse of the East African Community (1977), and free market economy policies (1985–1990) were associated with infrastructural and agricultural growth.
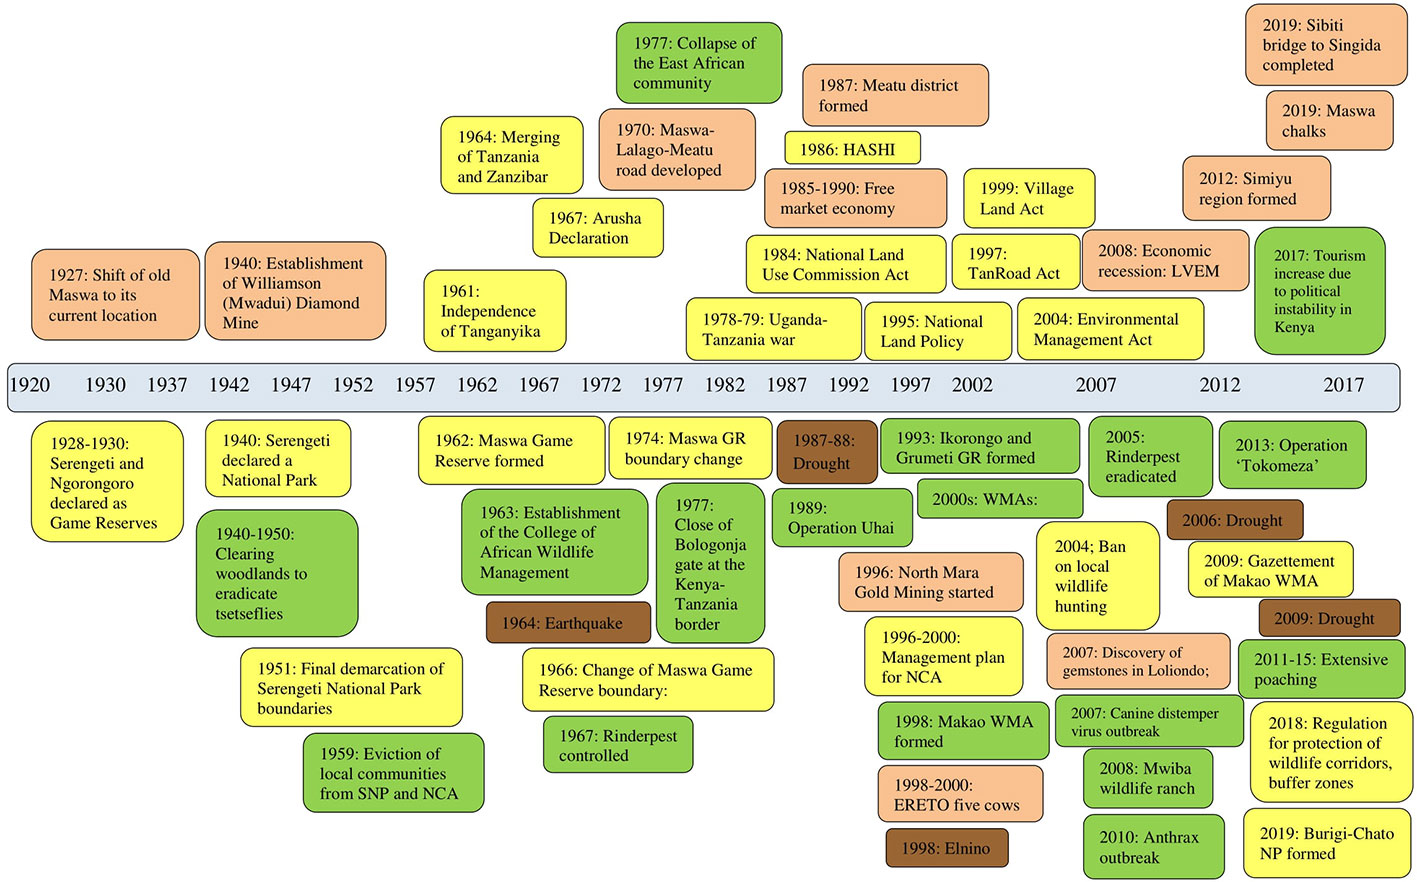
Figure 4 Timeline of events that influenced land use and land cover patterns in the wider Serengeti ecosystem. Events are categorized by color: administration, infrastructure development, and socio-economic factors (orange); legislation (yellow); use and management of natural resources such as wildlife and forests (green); and climate variability and natural catastrophe (brown).
Four alternate future LULCC scenarios for northern and eastern Serengeti
On the basis of the frequency of mentions, the main drivers of future LULCC in northern and eastern Serengeti in 2030 and 2063 were envisioned to be population growth (31% in 2030 and 33% in 2063), national policies and governance structure (18% in 2030 and 20% in 2063), level of environmental degradation (16% in 2030 and 9% in 2063), socio-economic development (16% in 2030 and 18% in 2063), climate change adaptation and mitigation strategies (13% in 2030 and 18% in 2063), and agricultural expansion (2% in 2030 and 2% in 2063). Population growth was associated with land scarcity, increased settlements, encroachment on protected areas, and the blockage of wildlife migratory corridors. Environmental degradation was associated with negative environmental impacts brought by deforestation, invasive species, soil erosion, and overgrazing. Socio-economic development was associated with increased access to social services, infrastructure growth (such as communication, transportation, water supply, and energy provision), industrial and technological advancement, access to markets, and livelihood diversification. Participants envisioned population growth, infrastructural development, and the state of climate change management interventions would be the main drivers of future LULCC in northern and eastern Serengeti and used them to coproduce the four alternate scenarios of future LULCC discussed below.
The scenario named “Wasiwasi” is described by a Swahili word meaning “uneasiness”. Under this scenario, the political leadership will prioritize economic development and disregard sustainability and equity in the protection, acquisition, access, and sharing of natural resource benefits. Ultimately, there will be forest loss, encroachment along protected area boundaries and water bodies, and expansion of unplanned built-up areas (Table 1; Supplementary Text 1; Supplementary Figure 1). By 2030, the prioritization of development over conservation, coupled with high population growth pressures, will lead to an expansion of agricultural land by 1,403 km2 and a reduction of forests by 1,371 km2 (Figure 5; Supplementary Table 2). Shrubland expansion south of the Loliondo highlands (Figure 5) will largely be driven by the loss of livestock grazing land and associated grazing pressure. Between 2030 and 2063, agricultural encroachment along the boundaries of SNP and NCA will extend up to 5000 m (Figure 5), and a decline of 1479 km2 of grassland and 2121 km2 of forest will occur. However, shrubland expansion in 2063 will decline as agricultural production was anticipated to be higher than livestock production (Supplementary Table 2).
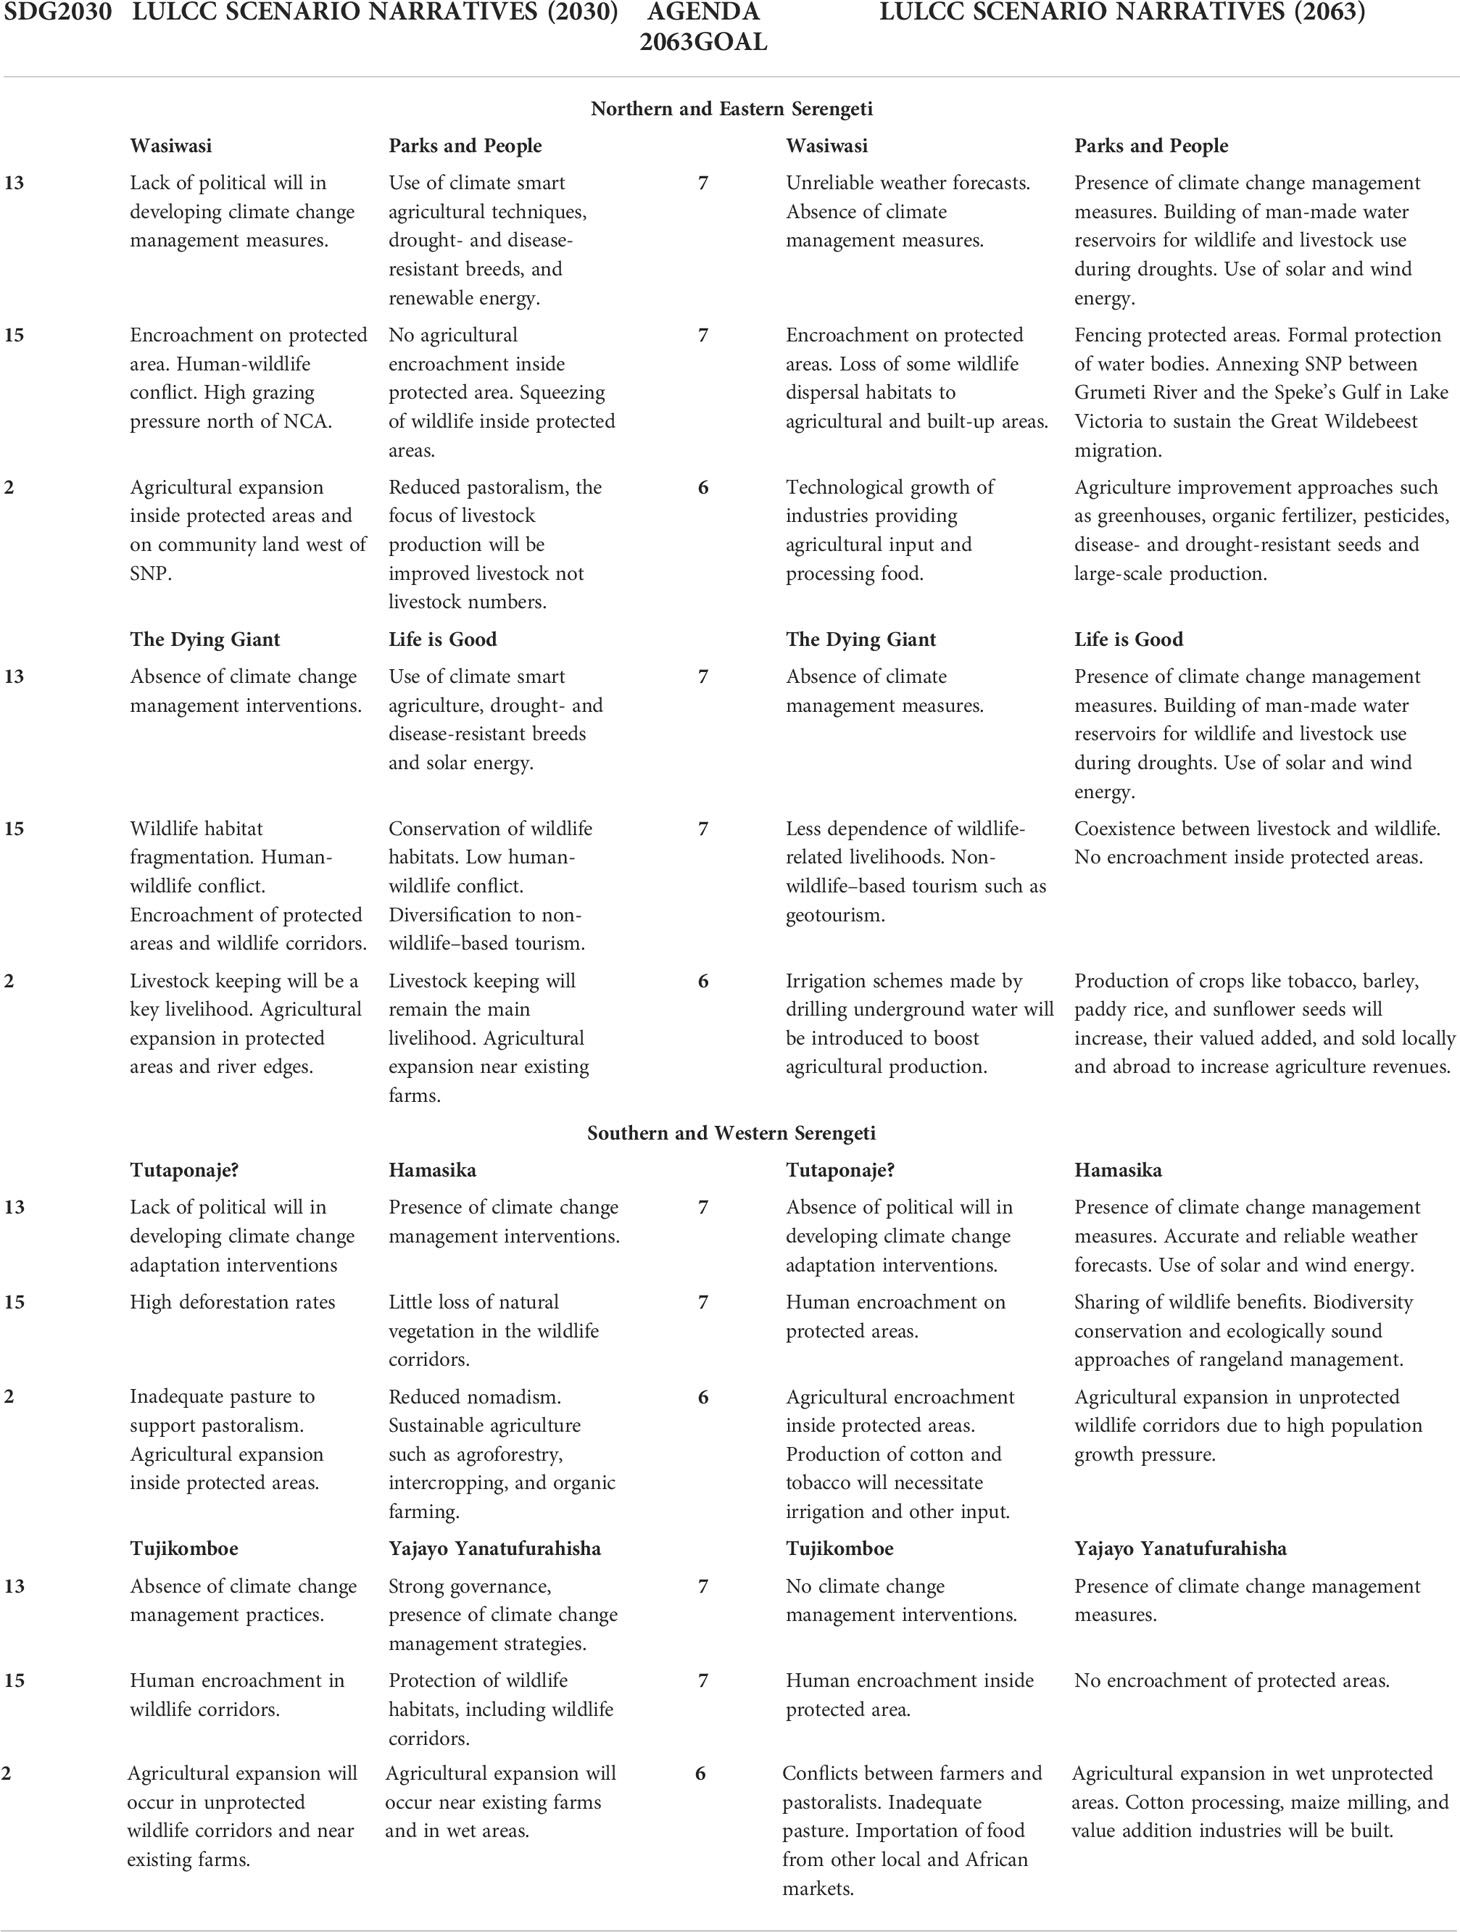
Table 1 Connection between co-produced scenarios of future LULCC, and SDGs 13 (climate action), 15 (life on land), and 2 (zero hunger) for 2030 and AU Agenda 2063 goals 7 (environmentally sustainable and climate-resilient economies and communities) and 6 (modern agriculture for increased production).
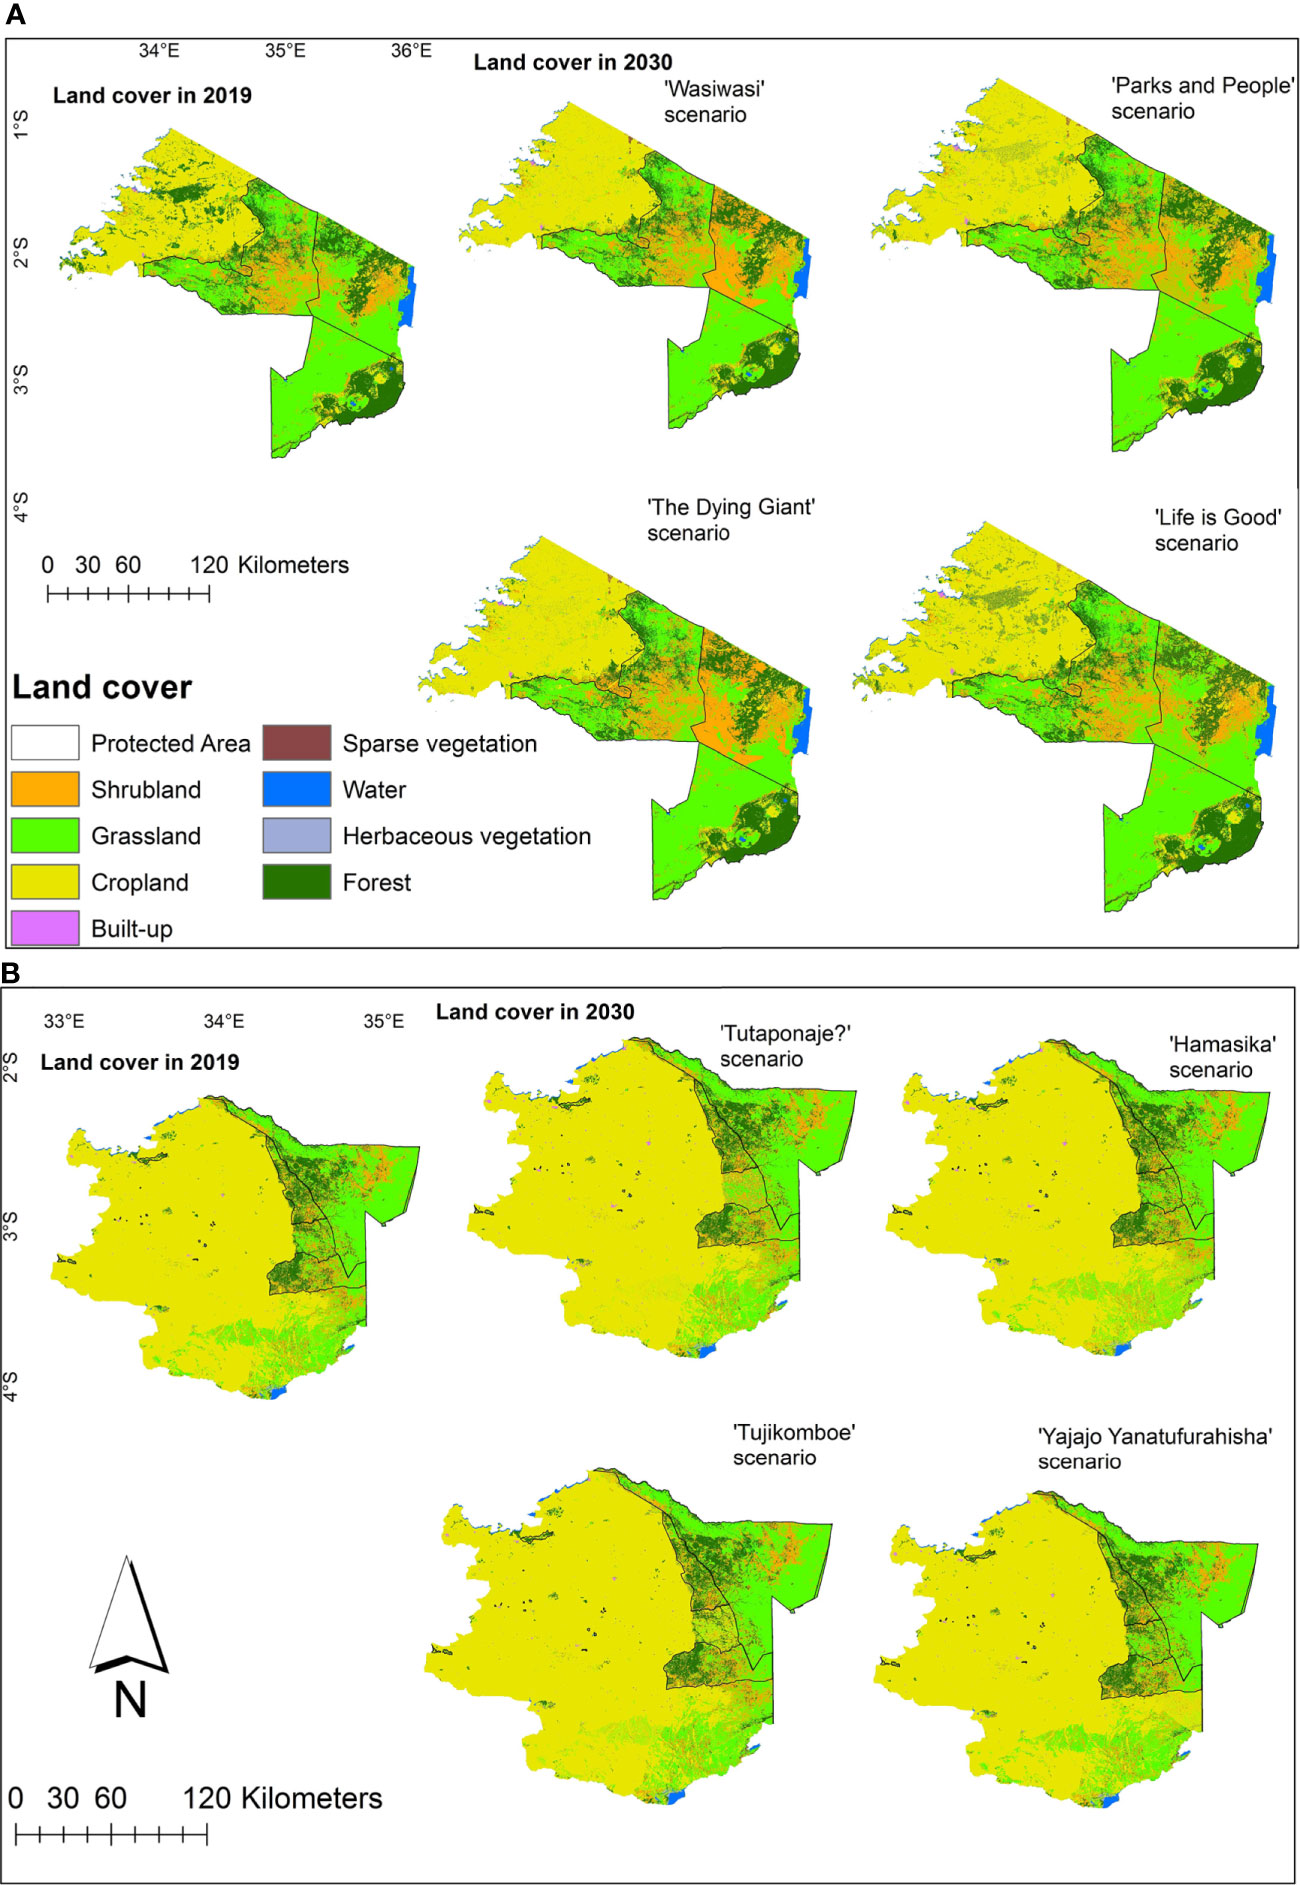
Figure 5 (A) Land cover change maps for northern and eastern Serengeti from 2019 to 2030 under the Wasiwasi, Parks and People, The Dying Giant, Life is Good scenarios. (B) Land cover maps for southern and western Serengeti from 2019 to 2030 under the Tutaponaje?, Hamasika, Tujikomboe, and Yajayo Yanatufurahisha.
The “Parks and People” scenario will be focused on balancing the infrastructural and agricultural land demands of a high population with the judicious use of natural resources and wildlife conservation by way of proactive political leadership in environmental matters and sustainable development (Table 1; Supplementary Figure 1). Between 2019 and 2030, cropland expansion will increase by 974 km2 in wet and unprotected areas to cater for the growing human population. Climate change management interventions and effective land use plans under this scenario will ensure that the decline of grasslands (943 km2) would be lower than those in the “Wasiwasi” scenario (Supplementary Table 2). Between 2030 and 2063, a loss of 1,905 km2 of highland forests and grasslands east of the SNP will largely be replaced by an increase 1,729 km2 agricultural land and 256 km2 shrubland (Figure 6). However, national and local leadership will ensure that the boundaries of protected areas are not encroached upon and shrubland expansion.
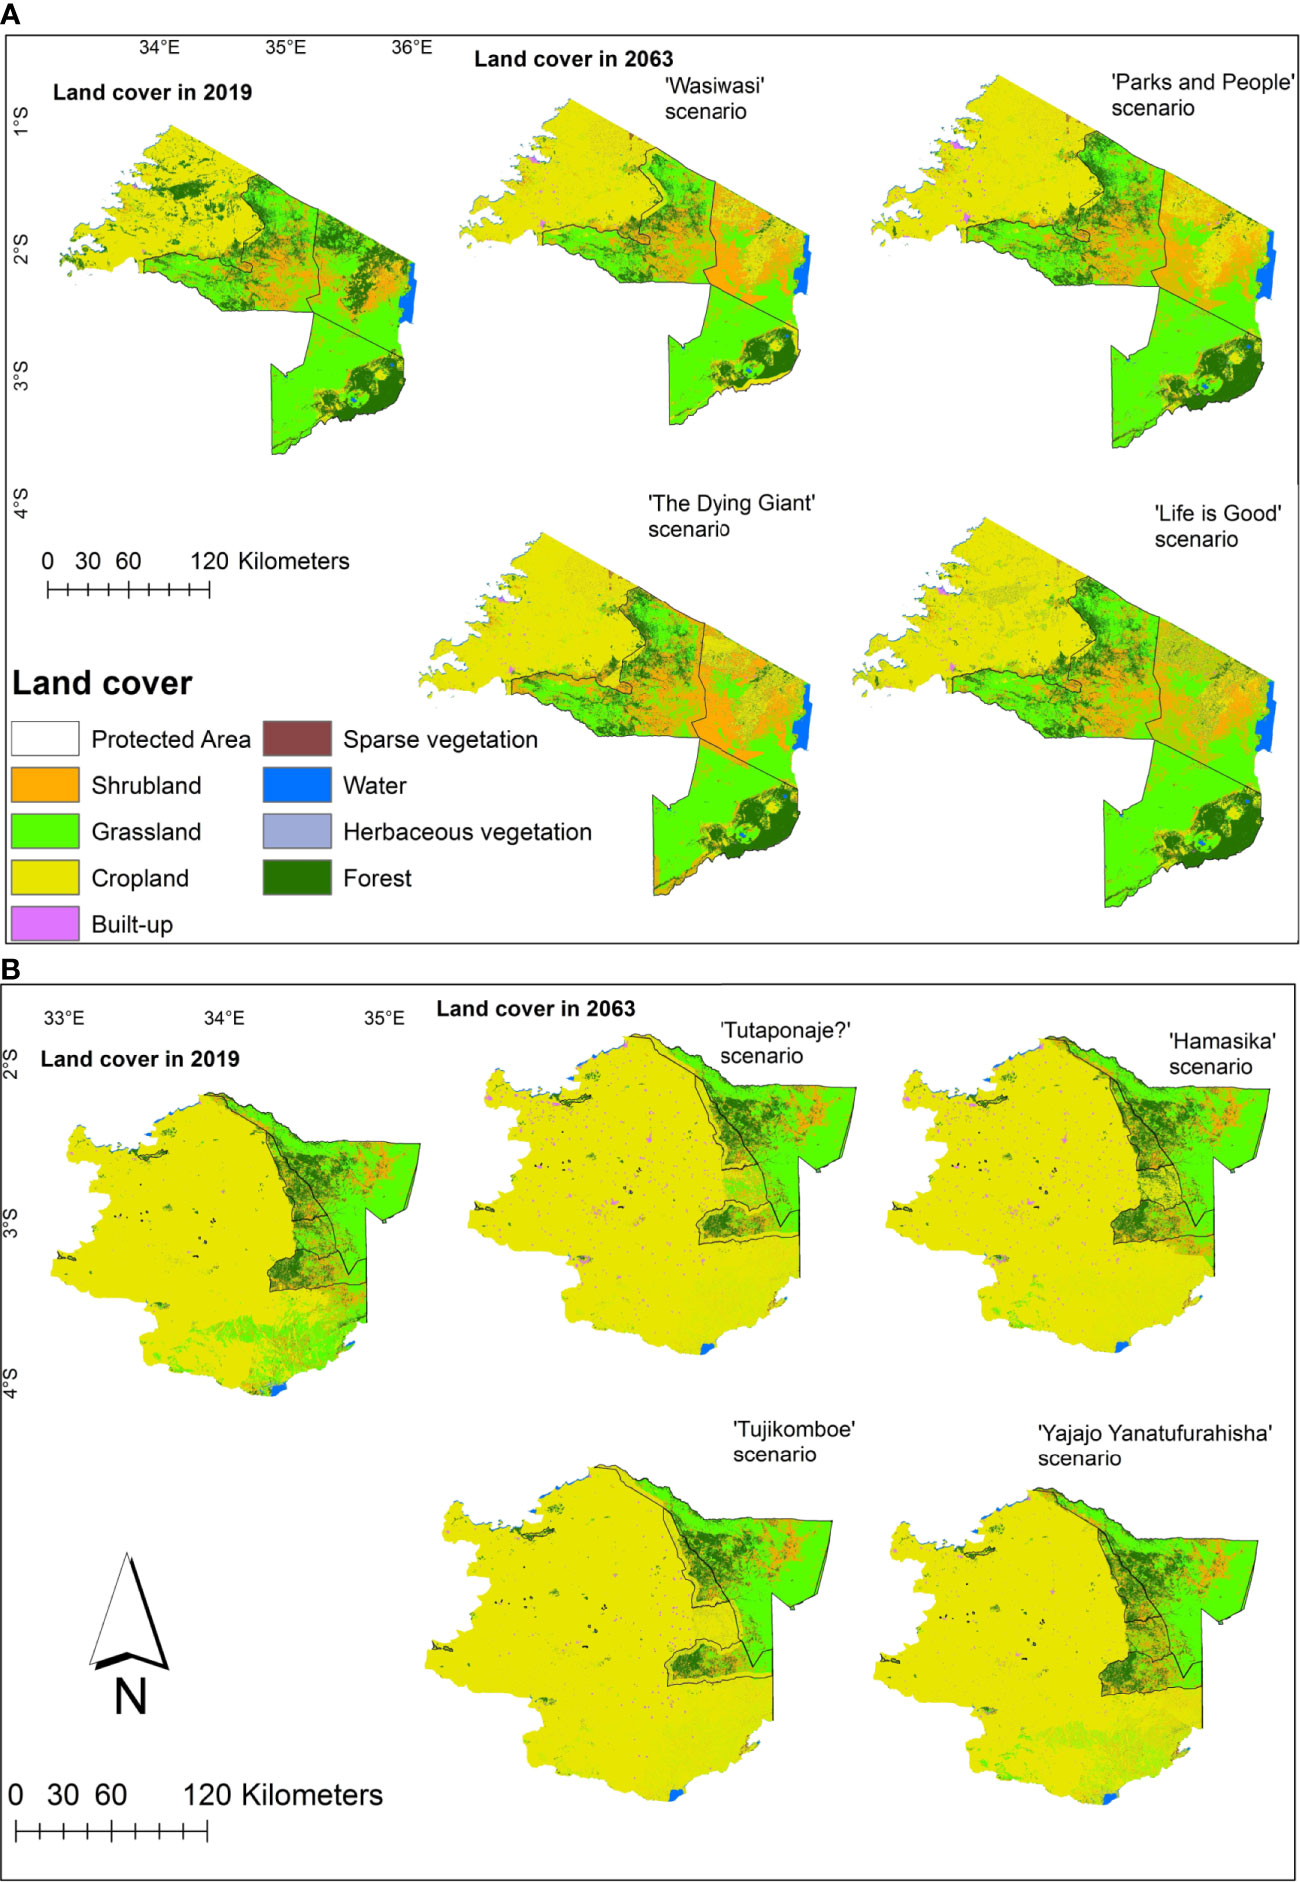
Figure 6 (A) Land cover maps for northern and eastern Serengeti from 2019 to 2063 under the Wasiwasi, Parks and People, The Dying Giant, Life is Good scenarios. (B) Land cover maps for southern and western Serengeti from 2019 to 2063 under the Tutaponaje?, Hamasika, Tujikomboe, and Yajayo Yanatufurahisha.
“The Dying Giant” scenario will be characterized by weak governance, a lack of climate change adaptation and mitigation strategies, and deficiencies in basic infrastructure in an environment that is rich in biodiversity, natural resources, and landscape and cultural heterogeneity. Weak climate change intervention strategies will lead communities to diversify their livelihoods (from smallholder agriculture and livestock keeping) to ecotourism and small-scale entrepreneurship (Supplementary Text 1). The main land cover change between 2019 and 2030 will be deforestation in Loliondo and the community areas west of the SNP by 1,302 km2, an increase of 1,573 km2 of shrubland along protected area boundaries and Loliondo, and an expansion of 1,361 km2 of smallholder agricultural land at the Ikona WMA, unprotected forests near existing agricultural areas and along the Grumeti River (Figure 5; Supplementary Table 2). Between 2030 and 2063, encroachment of up to 1281 km2 of agricultural land into protected areas, along rivers, and forests will occur. In addition, there will be an increase of sparse vegetation by 76 km2 (Figure 6).
The “Life is Good” scenario will be characterized by a low population, basic access to infrastructure, pro-environmental approaches in the use and management of natural resources, development of climate change management approaches, and effective land use plans (Supplementary Text 1). From 2019 to 2030, loss of forests (907 km2) and grassland (219 km2), increase in agriculture (563 km2), and built-up (20 km2) will be lower than for the other northern and eastern Serengeti scenarios (Supplementary Table 2). Between 2030 and 2063, political leadership will prohibit encroachment on protected area boundaries, expansion of 1,552 km2 of agricultural land will occur near existing farms in Loliondo, Ikona WMA, and in community areas (Figure 6), and the built-up area will increase by 73 km2 near Lake Victoria and near croplands.
Four alternate future LULCC scenarios for southern and western Serengeti
The main drivers envisioned to influence future LULCC in southern and western Serengeti, based on the number of times that they were mentioned were population growth (30% in 2030; 33% in 2063), climate variability (23% in 2030; 19% in 2063), socio-economic development (20% in 2030; 19% in 2063), agricultural expansion and status of agricultural technology (15% in 2030; 6% in 2063), level of environmental degradation (7% in 2030; 11% in 2063), and governance structures (5% in 2030; 11% in 2063). Participants envisioned population growth and the agricultural economy would be the key drivers of future LULCC scenarios for southern and western Serengeti and co-produced the four scenarios discussed below.
The scenario named “Tutaponaje?” is described by a Swahili question asking “how will we recover?”. The name portrays a scenario with high population growth, weak governance structures, reactive environmental conservation initiatives, and an unsustainable agricultural economy (Supplementary Figure 1; Supplementary Text 1). Between 2019 and 2030, deforestation and agricultural expansion in unprotected forests will reduce forest cover by 166 km2 (Supplementary Table 2). Participants expected that the forest loss would be higher than the simulated one if most forests under this scenario were not protected. Agricultural land use was anticipated to increase by 677 km2 south of Maswa Kimali Game Reserve and 500 m inside protected areas by 2030 (Figure 5) and would continue to expand by up to 2,815 km2 at the western and southern parts and along the boundaries of Maswa and Maswa Game Reserve in 2063 (Figure 6). Between 2030 and 2063, the built-up area will increase by 294 km2 near existing built-up lands and farms west of the study area (Figures 5).
The “Hamasika” scenario, meaning “add diligence”, will be characterized by high population growth, environmental awareness, and established climate change management interventions (Table 1). The management of protected areas will be geared to promote benefit sharing, sustainable wildlife resource use, biodiversity conservation, and ecologically sound approaches of rangeland management (Supplementary Text 1). However, high population growth will reduce livestock mobility. Between 2019 and 2030, losses of 74 km2 of shrubland, 531 km2 of grassland, and 41 km2 of forests and expansion of 586 km2 of agricultural land and 62 km2 of built-up areas will occur. However, contrary to the “Tutaponaje?” scenario, there will be no loss of natural vegetation in the wildlife corridor between Maswa and Maswa Kimali Game Reserves (Figure 5). Between 2030 and 2063, forest loss will be lower than in the “Tutaponaje?” scenario by 367 km2. Pressure from high population growth will lead to expansion of 1925 km2 of agricultural land in unprotected areas (Figure 6).
The “Tujikomboe” scenario, described by a Swahili phrase meaning “let us redeem ourselves”, represents a scenario characterized by low population growth, unsustainable agricultural practices, poor governance, and the absence of climate change management practices (Supplementary Text 1; Supplementary Figure 1). Between 2019 and 2030, demand for fuelwood, timber, pasture, and land for smallholder agriculture will result in the loss of forests (96 km2), shrubland (232 km2), and grassland (464 km2; Supplementary Table 2). Agricultural expansion is projected in the unprotected area between Maswa and Maswa Kimali Game Reserves, south of Maswa Kimali Game Reserve, and near existing farms (Figure 5). Between 2030 and 2063, projected reduction of 1,717, 857, and 486 km2 of grassland, shrubland, and forests, respectively, will account for expansion of cropland, sparse vegetation, and the built-up area.
The “Yajajo Yanatufurahisha” (“the future makes us happy”) describes a scenario characterized by the strong governance of natural resources that will ensure that proper land use plans are in place; agriculture production is sustainable; and effective policies related to mining, wildlife conservation, and climate change management approaches are developed, regularly updated, and implemented (Supplementary Text 1; Supplementary Figure 1). The main land cover changes expected between 2019 and 2030 are loss of forests (53 km2), shrubland (189 km2), and grassland (262 km2) outside the southern boundary of the SNP (Supplementary Table 2; Figure 5). Built-up areas will expand by 31 km2 near existing towns, settlements, and farms west of SNP. From 2030 to 2063, there will be forests and grassland loss of 79 km2 and 1203 km2, respectively, and herbaceous wetlands near croplands will be converted to other land cover types. However, unlike the other southern and western Serengeti scenarios, natural vegetation along the boundaries of protected areas and in the unprotected wildlife corridors will not be encroached on by other land cover classes (Figure 6).
Desirable and undesirable future for northern and eastern Serengeti
Most participants identified the most desirable future for northern and eastern Serengeti in 2030 as those with controlled population growth (17%), good and stable governance structures (13%), green infrastructure and energy (10%), and education curricula on sustainable land use available to the community (9%). A desirable future with climate change adaptation strategies in place, reduced land conflicts between different users, accurate forecasting strategies for changes in weather and natural resources, and the protection of wildlife habitats was perceived as achievable through good governance that would integrate a bottom-up approach and effective government policies that would be implemented in a timely manner. In 2063, the two most desirable future goals based on the number of mentions were controlled human population growth (14%) and good and stable governance (9%). Other desirable future goals for 2063 were generally similar to those of 2030 although the frequency of mentions was different (Supplementary Table 3). A future with a highly educated populace, land use, and land cover improvements in the Mara River headwaters region, technological advancement to simplify people’s lives, and well-understood anthropogenic impacts on the environment was mentioned for 2063, though not 2030. A future without invasive species was desired for 2030 but not made explicit for 2063.
The most undesirable future for northern and eastern Serengeti in 2030 was those with uncontrolled human population growth (19%), degraded land (11%), bad governance (9%), and encroachment along the boundaries of protected areas (9%). An undesirable livelihood future was perceived as those characterized by: basic agricultural production techniques, unstable livestock and tourism economies, lack of social facilities, and economic growth that disregards environmental sustainability. Unrealized sustainability targets in the SDG and Tanzania’s Vision 2025 Development Agendas in 2030 were considered undesirable by 2% of the participants. In 2063, the disastrous impacts of climate change were perceived to be the most undesirable future. An undesirable future characterized by high water scarcity, unregulated investment in protected areas, mining in protected areas, and compromised water catchments was mentioned for 2030 and not 2063. On the other hand, an undesirable future, such as a lack of international involvement in wildlife conservation, food insecurity, and increased illegal activities in protected areas, was mentioned for 2063 and not 2030.
Desirable and undesirable future for southern and western Serengeti
On the basis of the percent of mentions, the most desirable future for southern and western Serengeti in 2030 is those characterized by well-demarcated and managed protected areas (17%), communities sensitized to issues of environmental change, sustainable land uses and climate change (10%), healthy environments inside and outside protected areas (10%), sound land use plans (10%), and green infrastructure that uses renewable energy to meet development and agricultural production targets (8%). Because of population growth, participants especially desired environmentally sensitized communities and better management policies for natural resources that would balance human and wildlife needs and eliminate poverty, food insecurity, and environmental degradation (Supplementary Table 4). Desirable future in 2063 was mostly similar to those of 2030 (Supplementary Table 4) in addition to a few divergent future where communities were involved in environmental conservation (5%), global carbon emissions were regulated (5%), there was provision and use of green infrastructure and renewable energy (2%), and agricultural and livestock production technology was improved and sustainable (2%). To facilitate the desirable future envisioned for 2063, participants perceived that good governance in all sectors, environmental awareness, use of participatory approaches in natural resource management, poverty eradication, and sustainable agricultural practices would be necessary. Renewable energy was perceived to be necessary for mitigating climate change.
The most undesirable future for southern and western Serengeti in 2030 was those characterized by encroached protected areas (11%), disastrous climate change impacts (11%), degraded land (8%), and poaching and hunting (6%). The clearing of natural vegetation to make room for agriculture was undesirable to 6% of participants who perceived it as unsustainable. As most of the undesirable future for 2030 was related to the environment (Supplementary Table 4), participants desired good governance, controls on invasive species, increased environmental awareness, and the creation of environmental restoration programs. In 2063, the most undesirable future was those associated with negative environmental change such as land degradation (18%), disastrous climate change impacts (12%), desertification (9%), and biodiversity loss (3%). The degazettement of protected areas was mentioned as an undesirable future in 2063 but not in 2030. To avoid depletions in natural resources and biodiversity losses in 2063, participants proposed changing policies from consumptive to non-consumptive wildlife uses, reforestation, afforestation, the use of clean energy sources, agroforestry, and climate smart agriculture. To avoid degazettement and encroachment into protected areas, participants perceived that better and more efficient land use plans, good governance, and the reliable implementation of policies would be necessary.
Discussion
The co-produced scenarios for northern and eastern Serengeti and southern and western Serengeti shared similarities in future LULCC character. This is not too surprising given the overarching drivers of population growth, the structures governing natural resource use, and the ensuing environmental degradation. However, they differed in land-based development opportunities, policy decisions, and the nature and type of anticipated land cover change in the future (Figures 5, 6; Supplementary Text 1; Supplementary Figure 1). We discuss the scenarios with reference to stakeholders’ perceptions of key drivers of LULCC in Serengeti and the implication of future LULCC scenarios on the sustainability of the Serengeti ecosystem with reference to SDGs 13 (climate action), 15 (life on land), and 2 (zero hunger) and AU Agenda 2063 goals 7 (environmentally sustainable and climate resilient economies and communities) and 6 (modern agriculture for increased production; Figure 1).
Climate action
Climate fluctuations have always been key traits of the Serengeti landscape that have shaped human-nature interactions for millennia (Marchant et al., 2018). For the last century, participants reported the influence of climate change on LULCC as severe droughts or El Niño events that devastated livestock and agricultural production (Kimaro et al., 2018; Kariuki et al., 2021) and changed the dispersal and abundance of wildlife in the Serengeti (Ogutu et al., 2008). With at least 70% of households in our Serengeti catchment dependent on climate sensitive livelihoods (URT, 2016; URT, 2016b), climate change was anticipated to be a significant driver of future LULCC. For northern and eastern Serengeti, political support provided for developing future climate change adaptation measures was considered key for avoiding livestock losses caused by recurrent droughts, inadequate pasture, and environmental degradation (Sinclair et al., 2015). Climate variability associated with drier wet seasons and wetter dry seasons in southern and western Serengeti (Mfunda and Røskaft, 2011; Fyumagwa et al., 2013) was anticipated to influence its agricultural economy.
Existing climate change adaptation strategies such as livestock mobility, changing herd compositions from cattle to small stock, agroforestry, crop rotation (Kimaro et al., 2018), and implementing green infrastructure such as grazing banks that will be practiced under LULCC scenarios with strong climate change actions (Parks and People, Life is good, Hamasika, and Yajayo Yanatufurahisha) will increase the likelihood of these scenarios to meet targets 13.2 and 1.7.4 of the SDGs and AU Agenda 2063. As some of these climate change adaptation measures are already practiced by communities in Tanzania (Mkonda and He, 2018), the effectiveness of their continued use will depend on how formal and informal institutions will mediate access to natural resources such as forests, rangelands, and water at the local scale (Goldman and Riosmena, 2013). At a national scale, various institutional frameworks in Tanzania hinder an effective and coordinated intersectoral approach to incorporating climate change into policies by the Tanzania National Adaptation Plan of Action of 2007 (Pardoe et al., 2018). Thus, fully meeting the climate action SDG targets at the local scale will further depend on the development of efficient and integrated approaches that incorporate climate change adaptation and mitigation into policy frameworks in Tanzania. Under scenarios with sustainable agricultural economies (Hamasika and Yajayo Yanatufurahisha), meeting SDG target 13 (climate action) in 2030 and AU Agenda 2063 target 1.7.4 (low carbon production systems) in 2063 requires the interaction between climate change adaptation measures and food production targets to be incorporated into policies, strategies, and planning. This integration would also lead to meeting SDG 2 target 2.4 (ensure sustainable agriculture production practices) in 2030. Under increased climatic variability and increased drought frequencies projected for eastern Africa toward the mid-21st century (Platts et al., 2015), LULCC scenarios with a high population but lacking climate change management measures (Wasiwasi and Tutaponaje)? will need to prioritize non-land–based livelihoods that are not climate sensitive, whereas scenarios with a relatively low population growth (The Dying Giant and Tujikomboe) will make policies that prioritize land restoration and management (Supplementary Figure 1).
Wildlife conservation
The designation of protected areas over a large part of the Serengeti-Mara landscape has heavily influenced LULCC in Serengeti for the last 80 years. Participants associated the establishment of protected areas with the eviction of local communities at SNP and NCA (Sinclair et al., 2015), the provision of livelihood options for communities (Randall et al., 2015; Kariuki et al., 2021b), the demarcation of buffer zones with regulated wildlife and human land uses (Thirgood et al., 2004), and the consequent appearance of human-wildlife conflict hotspots (Sinclair et al., 2015). In western Serengeti, the development of Wildlife Management Associations (WMAs), especially Makao WMA, from 1998 was associated with the management of wildlife conservation on community land and the sharing of wildlife-related benefits by communities (Reid et al., 2015; Rosa et al., 2018).
With forest area covering 7,425 km2 or 20% of the total study area in 2019, northern and eastern Serengeti has higher forest cover than southern and western Serengeti where forests cover an area of 2,339 km2 or 7% of the total study area (Supplementary Table 2). As at least 60% of the Serengeti ecosystem receives some form of legal protection (Figure 2) under local community or national governance structures, most of the forest loss is anticipated along the boundaries of protected areas and in unprotected forests (Figures 5, 6; Supplementary Table 2). Generally, the protection of wildlife conservation areas and forests in Tanzania by the national government limits the overexploitation of natural resources and lowers the rate of forest loss (Reid et al., 2015; Rosa et al., 2018). Reduced forest cover in Serengeti has, however, been associated with high population growth and associated increases in deforestation rates, higher demand for fuel and timber, illegal hunting, and agricultural expansion (Randall et al., 2015). All natural vegetation in southern and western Serengeti is currently inside protected areas; thus, abating forest loss (SDG target 15, indicator 15.1.1 and AU Agenda 2063 target 1.7.2, indicator 2) in 2030 and 2063 under high population scenarios (Tutaponaje? and Hamasika) implies the need to ensure strict protection of conservation areas; otherwise, human population growth pressure will continue to fragment wildlife spaces. Moreover, the most desirable future for southern and western Serengeti in 2063 was one where protected areas are well demarcated, managed, connected, and conserve biodiversity while abating human wildlife conflict (Supplementary Table 3), further emphasizing the need for the effective management of protected areas, in line with global biodiversity targets (Zafra-Calvo and Geldmann, 2020). In northern and eastern Serengeti, population growth along SNP’s boundaries is largely driven by economic opportunities related to wildlife-based tourism. This means that avoiding human-wildlife conflicts and encroachment along protected area boundaries and meeting biodiversity targets in Serengeti in 2030 and 2063 under scenarios with sustainable natural resource use (Parks and People, and Life is Good) should ensure that communities living near protected areas benefit from wildlife conservation and their socio-economic status is improved. However, the COVID-19 pandemic and its direct and cascading impacts on travel and international tourism across Africa have highlighted the fragility of tourism-dependent models for human-wildlife coexistence, with devastating impacts upon local communities relying on them (Stone et al., 2021). This shock may represent instead an opportunity for developing new visions for resilient and sustainable wildlife-based tourism that include innovative funding methods to support conservation and communities supporting conservation, domestic tourism, and diversification of ecotourism revenue streams (Mudzengi et al., 2022).
Participants envisioned livestock grazing by pastoralists would continue into the future, especially under scenarios with low population growth. For scenarios subject to weak governance of natural resources in northern and eastern Serengeti (Wasiwasi and The Dying Giant), participants envisioned community protected areas experiencing high livestock grazing pressure, such as the Ikona WMA, were likely to undergo shrubland expansion as they would lack efficient approaches to integrating livestock production with wildlife conservation under changing cultures, policies, and socio-economic development. Shrubland expansion in savannas is a form of land degradation (Hare et al., 2021) partly linked to overgrazing, and associated with suppressing the growth of palatable grasses for livestock and wildlife and the availability of grass fuel for savanna fires (Roques et al., 2001). In the Serengeti ecosystem, shrubland expansion has been reported in Maswa, Ikorongo, and Grumeti Game Reserves and has been associated with changing climates and rangeland management techniques (Kimaro and Treydte, 2021). Effective integration of livestock and wildlife is, however, possible and can be beneficial to the environment and to pastoral communities (Keesing et al., 2018). Overall, the governance of SNP by the national government of Tanzania has, so far, been deemed successful (Reid et al., 2015). Thus, avoiding projected future forest losses and meeting SDG 15 and AU Agenda 2063 target 1.7.2 requires concerted efforts in integrating environmental protection policies with sustainable, culturally sensitive development and ensuring that livestock grazing spaces are protected in the future.
Agricultural expansion
Participants associated trends and patterns in agricultural expansion in Serengeti with legislation such as the National Land Use Planning Commission of 1984 that evaluated, harmonized, and coordinated the demarcation of farms and towns in Tanzania (Kauzeni et al., 1993). The National Land Policy of 1995 and the Village Land Act of 1999 were perceived to influence the rights of land owners for using and managing public land for agriculture (Sylivester, 2013). Agricultural expansion was associated with pressure from population growth, which was considered an undesirable future for Serengeti in 2030 and 2063. Population growth can be perceived as a challenge where there is competition for resource access or as an opportunity for economic growth through increased labor, production, infrastructure, and markets (Aguiar et al., 2019). Western Serengeti being wetter and more populous than eastern Serengeti has experienced increased demand for local resources by immigrant agricultural communities (Knapp et al., 2015). Crop production in western Serengeti increased from 37% to 54% between 1984 and 2018 (Veldhius et al., 2019). Among pastoralist communities in northern and eastern Serengeti, smallholder agricultural expansion largely occurs to supplement income and food (Reid et al., 2015).
Future agricultural expansion across the Serengeti ecosystem is anticipated in the unprotected forests west of SNP and at the LGCA east of SNP in 2030 and 2063 under alternate scenarios. Loss of forests in Tanzania occurs, in part, to create room for agricultural and infrastructural development and due to the weak enforcement of policies on natural resource use (Rosa et al., 2018). In 2030, the proportion of agricultural areas anticipated to be inside protected area boundaries, river edges, and forests, under various scenarios for northern and eastern Serengeti, will be higher (577–1,401 km2) than for southern and western Serengeti (38–189 km2; Supplementary Table 2) because of the availability of unprotected forests in northern and eastern Serengeti. For scenarios with high population and good governance over natural resources (Parks and People, Hamasika), achieving SDG target 2.4 (ensure sustainable agricultural production) in 2030 would require developing and enforcing land use plans that ensure that forests, protected areas, and rivers are not encroached upon. Participants identified that a policy priority for such scenarios would be to formally protect rivers, from the headwaters to the rivers’ mouth. Under scenarios with an unsustainable agricultural economy in southern and western Serengeti (Tutaponaje? and Tujikomboe), agricultural encroachment along protected area boundaries would happen because that would be the only area available for conversion. Around the Serengeti ecosystem, the greatest conversion of existing vegetation to agriculture has been at the western border of SNP as areas close to Lake Victoria already have stable agriculture and the eastern SNP boundary is dominated by pastoralists (Estes et al., 2012; Veldhius et al., 2019). Most households use their land for subsistence agriculture and only 19% use theirs for cash crop farming (Sinclair et al., 2015). Cotton is the main cash crop grown in western Serengeti. However, its production is small-scale, rain-fed and has gradually declined due to lower market prices for cotton and crop raiding by wildlife (Mfunda and Røskaft, 2011).
Under all scenarios, achieving increased agricultural production (target 1.6.1 of AU Agenda 2063) will require trade-offs with targets 1.7.4 (low carbon production systems) and 1.7.2 (biodiversity is conserved and used sustainably) because commercial agriculture expansion could occur over carbon rich habitats, which are also dispersal zones for Serengeti’s abundant and diverse wildlife. Intensification of agriculture has also been associated with biodiversity loss and high carbon emissions. Given the current annual population growth rate of 2.7% per annum, it is expected that by 2063, northern and eastern Serengeti will have at least 7.5 million residents, whereas southern and western Serengeti will have 10 million residents. Future planning for the Serengeti would require factoring in coexistence between people and nature by enhancing an integrated policy approach for implementing SDG and AU Agenda 2063 targets, ensuring protected areas are effectively managed to conserve biodiversity, alleviate poverty, and promote sustainable development, and environmental degradation is halted by balancing agricultural production, infrastructural development, and natural resource use.
Study limitations
The Kesho framework used by our study effectively engages diverse participants to co-produce future LULCC scenarios, integrates participants’ perspectives with spatial modeling, and enhances common learning and a sense of ownership of outputs generated. However, it has several limitations. First, its dependency on participants’ perspectives and secondary data sources meant that the nature, extent, and area of projected LULCC were contingent on the composition, expertise, and interest of the participants, as well as data availability and the ease of quantifying anticipated mechanisms of future LULCC. Second, it was challenging to fully integrate participant perspectives with quantitative data to develop spatial outputs of future land cover change scenarios. Although land demand estimates were calculated to determine the spatial land demand for given land uses in the future, and the participants assigned the likelihood of future land cover change for each land cover change expected in each scenario, it would be useful to compare how alternative participatory approaches, such as fuzzy sets (Mallampali et al., 2016), would vary from the Kesho’s approach. In addition, the qualitative scenario narratives largely informed the scenario development and were not fully integrated with the quantitative data (Elsawah et al., 2020). Third, as our study was focused on co-developing LULCC scenarios, it did not directly integrate projected climate change scenarios with scenario modeling, rather the impacts of projected climate change on LULCC were captured through projected secondary data that factored in projected climate change and greenhouse gas emissions in calculating future land demand for agricultural and livestock production in Tanzania. Active use of future climate information, such as from the AFRICLIM data portal (Platts et al., 2015), is minimal, and more interactive incorporation of climate future with stakeholder-driven perspectives of land use change that explore the interaction between land use change and climate change is an area for future development. Despite these limitations, the Kesho approach allows direct engagement and ownership with the participants to capture past and present LULCC and to estimate the likelihood of future LULCC at local and national scales.
Conclusion
Assessments of future LULCC are important for exploring potential pathways to sustainable environmental practices across multifunctional landscapes. This study engaged stakeholders to understand the causes and consequences of historical LULCC in the Serengeti ecosystem and integrated co-produced scenarios with secondary data to assess anticipated LULCC scenarios in 2030 and 2063. Results are interpreted in terms of the implications of future LULCC scenarios for meeting SDGs 13 (climate action), 15 (life on land), and 2 (zero hunger) and AU Agenda 2063 Aspiration 1 (a prosperous Africa, based on inclusive growth and sustainable development). Events related to climate, legislation, population growth, and wildlife conservation and tourism were considered important in driving historical LULCC in the Serengeti. Participants anticipated that future LULCC in the Serengeti would largely be determined by climate change management actions, population growth, infrastructural development, and the agricultural economy. Meeting desirable future and SDG and AU Agenda 2063 targets under various scenarios would need integrated approaches to incorporating climate change actions into policy frameworks, efficient management of protected areas, prioritizing non-land–based livelihoods, promoting sustainable and culturally sensitive development, and the sharing of wildlife-related benefits. Insights from this study show the utility of stakeholder perspectives in exploring future environmental change and provide a glimpse of multiple pathways toward Serengeti’s future. These pathways of future land cover change can open debates as to what policy and management interventions are required to achieve SDG and AU Agenda 2063 targets or at least to avoid undesirable future.
Data availability statement
The original contributions presented in the study are included in the article/Supplementary Material. Further inquiries can be directed to the corresponding author.
Ethics statement
The studies involving human participants were reviewed and approved by Tanzania Commission for Science and Technology (COSTECH) and the Tanzania Wildlife Research Institute (TAWIRI). The numbers for the research permit approval were 2018-463-NA-2018-320 and 2019-636-NA-2019-320. Written informed consent for participation was not required for this study in accordance with the national legislation and the institutional requirements.
Author contributions
RK, CC, LM, AS, CCM, PL, and RM contributed to conception and design of the study. RK analyzed the data. RK, LM, AS, and NW led and facilitated the stakeholder workshops. RK, CC, and RM developed the figures. RK and RM wrote the first draft of the manuscript. All authors contributed to manuscript revision, read, and approved the submitted version.
Funding
This research was funded through a grant that supported RK, AS, and CCM under the Sustainability and Resilience: Tackling Climate and Environmental Changes program by the Swedish Research Council (Vetenskapsrådet), Sida and Formas (2016-06355) awarded to PL, RM and LK.
Acknowledgments
We would like to thank the Rachel Carson Center for Environment and Society (RCC), Ludwig Maximilian University of Munich, Germany, for providing a research fellowship that supported RK. We thank the Government of Tanzania (COSTECH) and the Tanzania Wildlife Research Institute (TAWIRI) for providing research permits (2018-463-NA-2018-320 and 2019-636-NA-2019-320). We thank the participants who attended the ARCC workshops and provided the perspectives used for this research. We thank Rebecca Newman (University of York, UK), Jessica Thorn (University of St. Andrews, UK), and the 2021 cohort of Carson Fellows from the RCC for discussions on the methodology and content for the manuscript. We thank Salome Loithore (Karatu District Council, Tanzania), Joel Pallangyo (Maswa Game Reserve, Tanzania), Glory Sommy (NM-AIST, Tanzania), and Flora Msola (NM-AIST, Tanzania) for workshop arrangements. The British Institute in Eastern Africa (BIEA), Kenya, and Uppsala University, Sweden, are acknowledged for logistical support. AS and CCM benefited from exchange programs at the WISE-Futures World Bank Center of Excellence (ACEII) in Arusha, Tanzania. CCM benefitted from the Leverhulme Trust Uncovering the Variable Roles of Fire in Savannah Ecosystems project (IN-2014-022) awarded to Colin Beale. We thank the reviewers for providing helpful feedback on an earlier draft of the manuscript.
Conflict of interest
AS was employed by the company Terra Archeology.
The remaining authors declare that the research was conducted in the absence of any commercial or financial relationships that could be construed as a potential conflict of interest.
Publisher’s note
All claims expressed in this article are solely those of the authors and do not necessarily represent those of their affiliated organizations, or those of the publisher, the editors and the reviewers. Any product that may be evaluated in this article, or claim that may be made by its manufacturer, is not guaranteed or endorsed by the publisher.
Supplementary material
The Supplementary Material for this article can be found online at: https://www.frontiersin.org/articles/10.3389/fcosc.2022.920143/full#supplementary-material
References
African Development Bank (AfDB), World Wildlife Fund (WWF) (2015). African Ecological futures report (Abidjan, Coˆte d’Ivoire and Nairobi, Kenya: African Development Bank Group and the WWF Regional Office for Africa).
African Union Commission (AUC) (2015). “Agenda 2063,” in A shared strategic framework for inclusive growth and sustainable development & a global strategy to optimize the use of africa’s resources for the benefit of all africans Addis Ababa, Ethiopia: African Union Commission . Available at: https://au.int/sites/default/files/documents/33126-doc-framework_document_book.pdf.
Aguiar A. P., Collste D., Galafassi D., Harmáčková Z., Houngbedji K., Mesfin M., et al. (2019). The second African dialogue on the world in 2050-how to attain the SDGs within planetary boundaries: Agriculture and food systems. report on a multi-actor dialogue for TWI2050, 30-31 October 2018, Kigali, Rwanda. Sustain. Dev. Goals Center Afr. SwedBio/Stockholm Resilience Centre: Stockholm University, 1–36.
Aukema J. E., Pricope N. G., Husak G. J., Lopez-Carr D. (2017). Biodiversity areas under threat: overlap of climate change and population pressures on the world’s biodiversity priorities. PLoS One 12 (1), e0170615. doi: 10.1371/journal.pone.0170615
Bartzke G. S., Ogutu J. O., Mukhopadhyay S., Mtui D., Dublin H. T., Piepho H. P. (2018). Rainfall trends and variation in the maasai Mara ecosystem and their implications for animal population and biodiversity dynamics. PLoS One 13 (9), e0202814. doi: 10.1371/journal.pone.0202814
Buchhorn M., Smets B., Bertels L., Lesiv M., Tsendbazar N. E., Herold M., et al. (2019). “Copernicus Global land service,” in Land cover 100m: Epoch 2018: Globe. version V2. 0.2. 2019 Geneve, Switzerland: Zenodo. Available at: https://land.copernicus.eu/global/products/lc. Retrieved November 20, 2020.
Bushozi P. M. (2019). A multiple-institution corporation’s engagement of local communities in conservation management. S. Afr. Archaeol. Bull. 74 (211), 104–111.
Capitani C., Mukama K., Mbilinyi B., Malugu I. O., Munishi P. K., Burgess N. D., et al. (2016). From local scenarios to national maps: a participatory framework for envisioning the future of Tanzania. Ecol. Soc. 21 (3), 4. doi: 10.5751/es-08565-210304
Capitani C., Van Soesbergen A., Mukama K., Malugu I., Mbilinyi B., Chamuya N., et al. (2019). Scenarios of land use and land cover change and their multiple impacts on natural capital in Tanzania. Environ. Conserv. 46 (1), 17–24. doi: 10.1017/s0376892918000255
Courtney Mustaphi C.J., Capitani C., Boles. O, Kariuki R., Newman R., Munishi L., et al. (2019). Integrating evidence of land use and land cover change for land management policy formulation along the Kenya-Tanzania borderlands. Anthropocene. 28, 100228. doi: 10.1016/j.ancene.2019.100228
Ellis E. C., Kaplan J. O., Fuller D. Q., Vavrus S., Goldewijk K. K., Verburg P. H. (2013). Used planet: A global history. Proc. Natl. Acad. Sci. 110 (20), 7978–7985. doi: 10.1073/pnas.1217241110
Elsawah S., Hamilton S. H., Jakeman A. J., Rothman D., Schweizer V., Trutnevyte E., et al. (2020). Scenario processes for socio-environmental systems analysis of futures: a review of recent efforts and a salient research agenda for supporting decision making. Sci. Total Environ. 729, 138393. doi: 10.1016/j.scitotenv.2020.138393
Estes A. B., Kuemmerle T., Kushnir H., Radeloff V. C., Shugart H. H. (2012). Land-cover change and human population trends in the greater Serengeti ecosystem from 1984–2003. Biol. Conserv. 147 (1), 255–263. doi: 10.1016/j.biocon.2012.01.010
Ferraro P. J., Hanauer M. M., Sims K. R. (2011). Conditions associated with protected area success in conservation and poverty reduction. Proc. Natl. Acad. Sci. 108 (34), 13913–13918. doi: 10.1073/pnas.1011529108
Food Agriculture Organization (FAO) (2018). The future of food and agriculture–alternative pathways to 2050 (Rome: Publishing Group of FAO’s Office), 224pp. License: CC BY-NC-SA 3.0 IGO.
Forman R. T., Alexander L. E. (1998). Roads and their major ecological effects. Annu. Rev. Ecol. Evol. Syst. 29 (1), 207–231. doi: 10.1146/annurev.ecolsys.29.1.207
Fyumagwa R., Gereta E., Hassan S., Kideghesho J. R., Kohi E. M., Keyyu J., et al. (2013). Roads as a threat to the Serengeti ecosystem. Conserv. Biol. 27 (5), 1122–1125. doi: 10.1111/cobi.12116
Gebrechorkos S. H., Hülsmann S., Bernhofer C. (2019). Regional climate projections for impact assessment studies in East Africa. Environ. Res. Lett. 14 (4), 044031. doi: 10.1088/1748-9326/ab055a
Geological and Mineral Information System (2020). Available at: www.gmis-Tanzania.comhttp://www.gmis-tanzania.com/.
Goldman M. J., Riosmena F. (2013). Adaptive capacity in Tanzanian maasailand: Changing strategies to cope with drought in fragmented landscapes. Glob Environ. Change 23 (3), 588–597. doi: 10.1016/j.gloenvcha.2013.02.010
Gray S. A., Gray S., De Kok J. L., Helfgott A. E., O'Dwyer B., Jordan R., et al. (2015). Using fuzzy cognitive mapping as a participatory approach to analyze change, preferred states, and perceived resilience of social-ecological systems. Ecol. Soc 20 (2), 11. doi: 10.5751/es-07396-200211
Haile G. G., Tang Q., Sun S., Huang Z., Zhang X., Liu X. (2019). Droughts in East Africa: Causes, impacts and resilience. Earth-sci. Rev. 193, 46–161. doi: 10.1016/j.earscirev.2019.04.015
Hare M. L., Wang Y. D., Yuan Y. O. U., Gedda A. E. (2021). Do woody tree thinning and season have effect on grass species’ composition and biomass in a semi-arid savanna? the case of a semi-arid savanna, southern Ethiopia. Front. Environ. Sci. 9. doi: 10.3389/fenvs.2021.692239
Holdo R. M., Fryxell J. M., Sinclair A. R., Dobson A., Holt R. D. (2011). Predicted impact of barriers to migration on the Serengeti wildebeest population. PloS One 6 (1), e16370. doi: 10.1371/journal.pone.0016370
Intergovernmental Panel on Climate Change (2021). “Summary for policymakers,” in Climate change 2021: The physical science basis. contribution of working group I to the sixth assessment report of the intergovernmental panel on climate change. Ed. Masson-Delmotte V., Zhai P., Pirani A., Connors S. L. C., Berger S. (Cambridge: Cambridge University Press).
Jarvis A., Reuter H.I., Nelson A., Guevara E (2008). Hole-filled SRTM for the globe Version 4. Available from: https://cgiarcsi.community/data/srtm-90m-digital-elevation-database-v4-1/
Kariuki R. W., Munishi L. K., Courtney-Mustaphi C. J., Capitani C., Shoemaker A., Lane P. J., et al. (2021). Integrating stakeholders’ perspectives and spatial modelling to develop scenarios of future land use and land cover change in northern Tanzania. PloS One 16 (2), e0245516. doi: 10.1371/journal.pone.0245516
Kariuki R. W., Western D., Willcock S., Marchant R. (2021b). Assessing interactions between agriculture, livestock grazing and wildlife conservation land uses: A historical example from East Africa. Land 10 (1), 46. doi: 10.3390/land10010046
Kariuki R., Willcock S., Marchant R. (2018). Rangeland livelihood strategies under varying climate regimes: Model insights from southern Kenya. Land 7 (2), 47. doi: 10.3390/land7020047
Kauzeni A. S., Kikula I. S., Mohamed S. A., Lyimo J. G., Dalal-Clayton D. B. (1993). Land use planning and resource assessment in Tanzania: a case study (Dar es Salaam, Tanzania and London, UK: International Institute for Environment and Development).
Keesing F., Ostfeld R. S., Okanga S., Huckett S., Bayles B. R., Chaplin-Kramer R., et al. (2018). Consequences of integrating livestock and wildlife in an African savanna. Nat. Sustain. 1 (10), 566–573. doi: 10.1038/s41893-018-0149-2
Kimaro E. G., Mor S. M., Toribio J. A. L. (2018). Climate change perception and impacts on cattle production in pastoral communities of northern Tanzania. Pastoralism 8 (1), 1–16. doi: 10.1186/s13570-018-0125-5
Kimaro H. S., Treydte A. C. (2021). Rainfall, fire and large-mammal-induced drivers of vachellia drepanolobium establishment: Implications for woody plant encroachment in maswa, Tanzania. Afr. J. Ecol. 59 (4), 934–943. doi: 10.1111/aje.12881
Kisingo A., Rollins R., Murray G., Dearden P., Clarke M. (2016). Evaluating ‘good governance’: The development of a quantitative tool in the greater Serengeti ecosystem. J. Environ. Manage. 181, 749–755. doi: 10.1016/j.jenvman.2016.08.002
Knapp E. J., Rentsch D., Schmitt J., Knapp L. M (2015). The plight of the people: understanding the social-ecological context of people living on the western edge of Serengeti National Park. In Serengeti IV: Sustaining Biodiversity in a Coupled Human-Natural System (University of Chicago Press)
Lambin E. F., Meyfroidt P. (2011). Global land use change, economic globalization, and the looming land scarcity. Proc. Natl. Acad. Sci. 108 (9), 3465–3472. doi: 10.1073/pnas.1100480108
Mallampalli V. R., Mavrommati G., Thompson J., Duveneck M., Meyer S., Ligmann-Zielinska A., et al. (2016). Methods for translating narrative scenarios into quantitative assessments of land use change. Environ. Model. Software 82, 7–20. doi: 10.1016/j.envsoft.2016.04.011
Marchant R., Richer S., Boles O., Capitani C., Courtney-Mustaphi C. J., Lane P., et al. (2018). Drivers and trajectories of land cover change in East Africa: Human and environmental interactions from 6000 years ago to present. Earth-Sci. Rev. 178, 322–378. doi: 10.1016/j.earscirev.2017.12.010
McGranahan D. A., Kirkman K. P. (2013). Multifunctional rangeland in southern Africa: Managing for production, conservation, and resilience with fire and grazing. Land 2 (2), 176–193. doi: 10.3390/land2020176
Mfunda I. M., Røskaft E. (2011). Wildlife or crop production: the dilemma of conservation and human livelihoods in Serengeti, Tanzania. Int. J. Biodiversity Science Ecosystem Serv. Manage. 7 (1), 39–49. doi: 10.1080/21513732.2011.602028
Ministry of Natural Resources and Tourism (MNRT) (2015). National forest resource monitoring and assessment of Tanzania (NAFORMA). main results (Dar es Salaam: Tanzania Forest Services Agency).
Miatt E. (2022). The Impacts of Climate Change and Land Use Change on the Serengeti and Maasai Mara (Masters Dissertation, University of York)
Mkonda M. Y., He X. (2018). Agricultural history nexus food security and policy framework in Tanzania. Agric. Food secur. 7 (1), 1–11. doi: 10.1186/s40066-018-0228-7
Mudzengi B. K., Gandiwa E., Muboko N., Mutanga C. N. (2022). Innovative community ecotourism coping and recovery strategies to COVID-19 pandemic shocks: The case of mahenye. Dev. South. Afr. 39 (1), 68–83. doi: 10.1080/0376835x.2021.1980375
Nicholson E., Fulton E. A., Brooks T. M., Blanchard R., Leadley P., Metzger J. P., et al. (2019). Scenarios and models to support global conservation targets. Trends Ecol. Evol. 34 (1), 57–68. doi: 10.1016/j.tree.2018.10.006
Obura D. O., Katerere Y., Mayet M., Kaelo D., Msweli S., Mather K., et al. (2021). Integrate biodiversity targets from local to global levels. Science 373 (6556), 746–748. doi: 10.1126/science.abh2234
Ogutu J. O., Piepho H. P., Dublin H. T., Bhola N., Reid R. S. (2008). Rainfall influences ungulate population abundance in the Mara-Serengeti ecosystem. J. Anim. Ecol. 77 (4), 814–829. doi: 10.1111/j.1365-2656.2008.01392.x
Pardoe J., Conway D., Namaganda E., Vincent K., Dougill A. J., Kashaigili J. J. (2018). Climate change and the water–energy–food nexus: insights from policy and practice in Tanzania. Clim. Policy 18 (7), 863–877. doi: 10.1080/14693062.2017.1386082
Platts P. J., Omeny P., Marchant R. (2015). AFRICLIM: high-resolution climate projections for ecological applications in Africa. Afr. J. Ecol. 53 (1), 103–108. doi: 10.1111/aje.12180Pörtner
Pörtner H. O., Scholes R. J., Agard J., Archer E., Arneth A., Bai X., et al. (2021). Scientific outcome of the IPBES-IPCC co-sponsored workshop on biodiversity and climate change. Bonn and Bremen, Germany: IPBES and IPCC. Secretariat
Ramankutty N., Evan A. T., Monfreda C., Foley J. A. (2008). Farming the planet: 1. geographic distribution of global agricultural lands in the year 2000. Global Biogeochem. Cycles 22 (1), GB1003. doi: 10.1029/2007gb002952
Randall D., Fischer A., Nelson A., Msuha M., Lowassa A., Sandström C. (2015). “24. multiple functions and institutions: Management complexity in the Serengeti ecosystem,” in Serengeti IV (Chicago and London: University of Chicago Press), 701–736.
R Core Team (2019). R: A language and environment for statistical computing. R foundation for statistical computing (Vienna, Austria: R Foundation for Statistical Computing).
Reid R. S., Galvin K. A., Knapp E. J., Ogutu J. O., Kaelo D. S. (2015). “25. sustainability of the Serengeti-Mara ecosystem for wildlife and people,” in Serengeti IV (Berkeley, USA: University of Chicago Press), 737–772.
Robinson T. P., Wint G. W., Conchedda G., Van Boeckel T. P., Ercoli V., Palamara E., et al. (2014). Mapping the global distribution of livestock. PloS One 9 (5), e96084. doi: 10.1371/journal.pone.0096084
Roques K. G., O'connor T. G., Watkinson A. R. (2001). Dynamics of shrub encroachment in an African savanna: relative influences of fire, herbivory, rainfall and density dependence. J. Appl. Ecol. 38 (2), 268–280. doi: 10.1046/j.1365-2664.2001.00567.x
Rosa I., Rentsch D., Hopcraft J. G. C. (2018). Evaluating forest protection strategies: A comparison of land-use systems to preventing forest loss in Tanzania. Sustainability 10 (12), 4476. doi: 10.3390/su10124476
Saito O., Hashimoto S., Managi S., Aiba M., Yamakita T., DasGupta R., et al. (2019). Future scenarios for socio-ecological production landscape and seascape. Sustain. Sci. 14 (1), 1–4. doi: 10.1007/s11625-018-0651-5
Scoon R. N. (2018). Geology of national parks of central/southern Kenya and northern Tanzania (Cham: Springer).
SEDAC (2020). “Global roads open access data set (gROADS), v1,” in Global roads New York, USA: Columbia University and University of Georgia. Available at: https://sedac.ciesin.columbia.edu/data/set/groads-global-roads-open-access-v1. Sedac.ciesin.columbia.edu. Retrieved November 20, 2020.
Shackelford G. E., Steward P. R., German R. N., Sait S. M., Benton T. G. (2015). Conservation planning in agricultural landscapes: hotspots of conflict between agriculture and nature. Divers. Distrib. 21 (3), 357–367. doi: 10.1111/ddi.12291
Sinclair A. R., Metzger K. L., Mduma S. A., Fryxell J. M. (Eds.) (2015). Serengeti IV: sustaining biodiversity in a coupled human-natural system (Chicago and London: University of Chicago Press).
Stone L. S., Stone M., Mogomotsi P., Mogomotsi G. (2021). The impacts of covid-19 on nature-based tourism in Botswana: Implications for community development. Tour. Rev. Int. 25 (2-3), 263–278. doi: 10.3727/154427221x16098837279958
Sylivester S. (2013). Land tenure reforms and investment in Tanzania (Dar es Salaam: Masters Dissertation, University of Dar es Salaam).
Tabor K., Hewson J., Tien H., González-Roglich M., Hole D., Williams J. W. (2018). Tropical protected areas under increasing threats from climate change and deforestation. Land 7 (3), 90. doi: 10.3390/land7030090
Tesfaw A. T., Pfaff A., Kroner R. E. G., Qin S., Medeiros R., Mascia M. B. (2018). Land-use and land-cover change shape the sustainability and impacts of protected areas. Proc. Natl. Acad. Sci. 115 (9), 2084–2089. doi: 10.1073/pnas.1716462115
Thirgood S., Mosser A., Tham S., Hopcraft G., Mwangomo E., Mlengeya T., et al. (2004). “Can parks protect migratory ungulates? the case of the Serengeti wildebeest,” in Animal conservation forum, Vol. 7, No. 2. (London, UK: Cambridge University Press), 113–120.
Trogu D., Campagna M. (2018). Towards spatial composite indicators: A case study on sardinian landscape. Sustain 10 (5), 1369. doi: 10.3390/su10051369
UNEP-WCMC, IUCN (2018). Protected planet (Cambridge, UK: The World Database on Protected Areas (WDPA).
United Nations (UN) (2015) Transforming our world: the 2030 agenda for sustainable development. Available at: https://sustainabledevelopment.un.org/content/documents/21252030%20Agenda%20for%20Sustainable%20Development%20web.pdf.
United Republic of Tanzania (URT) (2012). Population and housing census (Dar es Salaam, Tanzania: Population Distribution by Administrative Areas).
United Republic of Tanzania (URT) (2016). Basic demographic and socio-economic profile Mara region. Dar es Salaam: Government of Tanzania
United Republic of Tanzania (URT) (2016b). Basic demographic and socio-economic profile simiyu region. Dar es Salaam: Government of Tanzania
United Republic of Tanzania (URT) (2020) Ministry of agriculture. agricultural maps. Available at: https://www.kilimo.go.tz/index.php/en/maps.
van't Klooster S. A., van Asselt M. B. (2006). Practising the scenario-axes technique. Futures 38 (1), 15–30. doi: 10.1016/j.futures.2005.04.019
van Soesbergen A., Arnell A. P., Sassen M., Stuch B., Schaldach R., Göpel J., et al. (2017). Exploring future agricultural development and biodiversity in Uganda, Rwanda and Burundi: a spatially explicit scenario-based assessment. Reg. Environ. Change 17 (5), 1409–1420. doi: 10.1007/s10113-016-0983-6
Veldhuis M. P., Ritchie M. E., Ogutu J. O., Morrison T. A., Beale C. M., Estes A. B., et al. (2019). Cross-boundary human impacts compromise the Serengeti-Mara ecosystem. Science 363 (6434), 1424–1428. doi: 10.1126/science.aav0564
WorldPop (2013). “School of geography and environmental science,” in Egypt 100m population. alpha version 2010 estimates of numbers of people per grid square, with national totals adjusted to match UN population division estimates (Southampton, UK: University of Southampton). Available at: www.worldpop.orghttp://esa.un.org/wpp/. doi: 10.5258/SOTON/WP00078
Keywords: agenda-2063, climate variability, knowledge co-production, savannas, social-ecological interactions, SDGs
Citation: Kariuki RW, Capitani C, Munishi LK, Shoemaker A, Courtney Mustaphi CJ, William N, Lane PJ and Marchant R (2022) Serengeti’s futures: Exploring land use and land cover change scenarios to craft pathways for meeting conservation and development goals. Front. Conserv. Sci. 3:920143. doi: 10.3389/fcosc.2022.920143
Received: 14 April 2022; Accepted: 29 August 2022;
Published: 23 September 2022.
Edited by:
Christos Mammides, Frederick University, CyprusReviewed by:
Nadia S. Santini, National Autonomous University of Mexico, MexicoSridhara Nayak, Japan Meteorological Corporation Limited, Japan
Copyright © 2022 Kariuki, Capitani, Munishi, Shoemaker, Courtney Mustaphi, William, Lane and Marchant. This is an open-access article distributed under the terms of the Creative Commons Attribution License (CC BY). The use, distribution or reproduction in other forums is permitted, provided the original author(s) and the copyright owner(s) are credited and that the original publication in this journal is cited, in accordance with accepted academic practice. No use, distribution or reproduction is permitted which does not comply with these terms.
*Correspondence: Rebecca W. Kariuki, rebecca.kariuki@york.ac.uk