Every day, we make choices about which brands to use and support. Often, these choices spark friendly debates — like whether Starbucks is better than Dunkin’ or if iPhone truly tops Android. But have you ever wanted to know which side of these brand rivalries most people in your state are on?
At Shane Co., we value loyalty, whether it’s to a cherished brand or a loved one. That’s why we’ve examined some of the biggest brand rivalries using Google Trends data to see which ones are the most popular in each U.S. state. The results? Some close competitions and a few clear winners.
So, are you ready to see if your favorite brands are winning the rivalry in your state? Let’s get to the results!
Feast or Famine: Battle of the Food & Beverage Brands
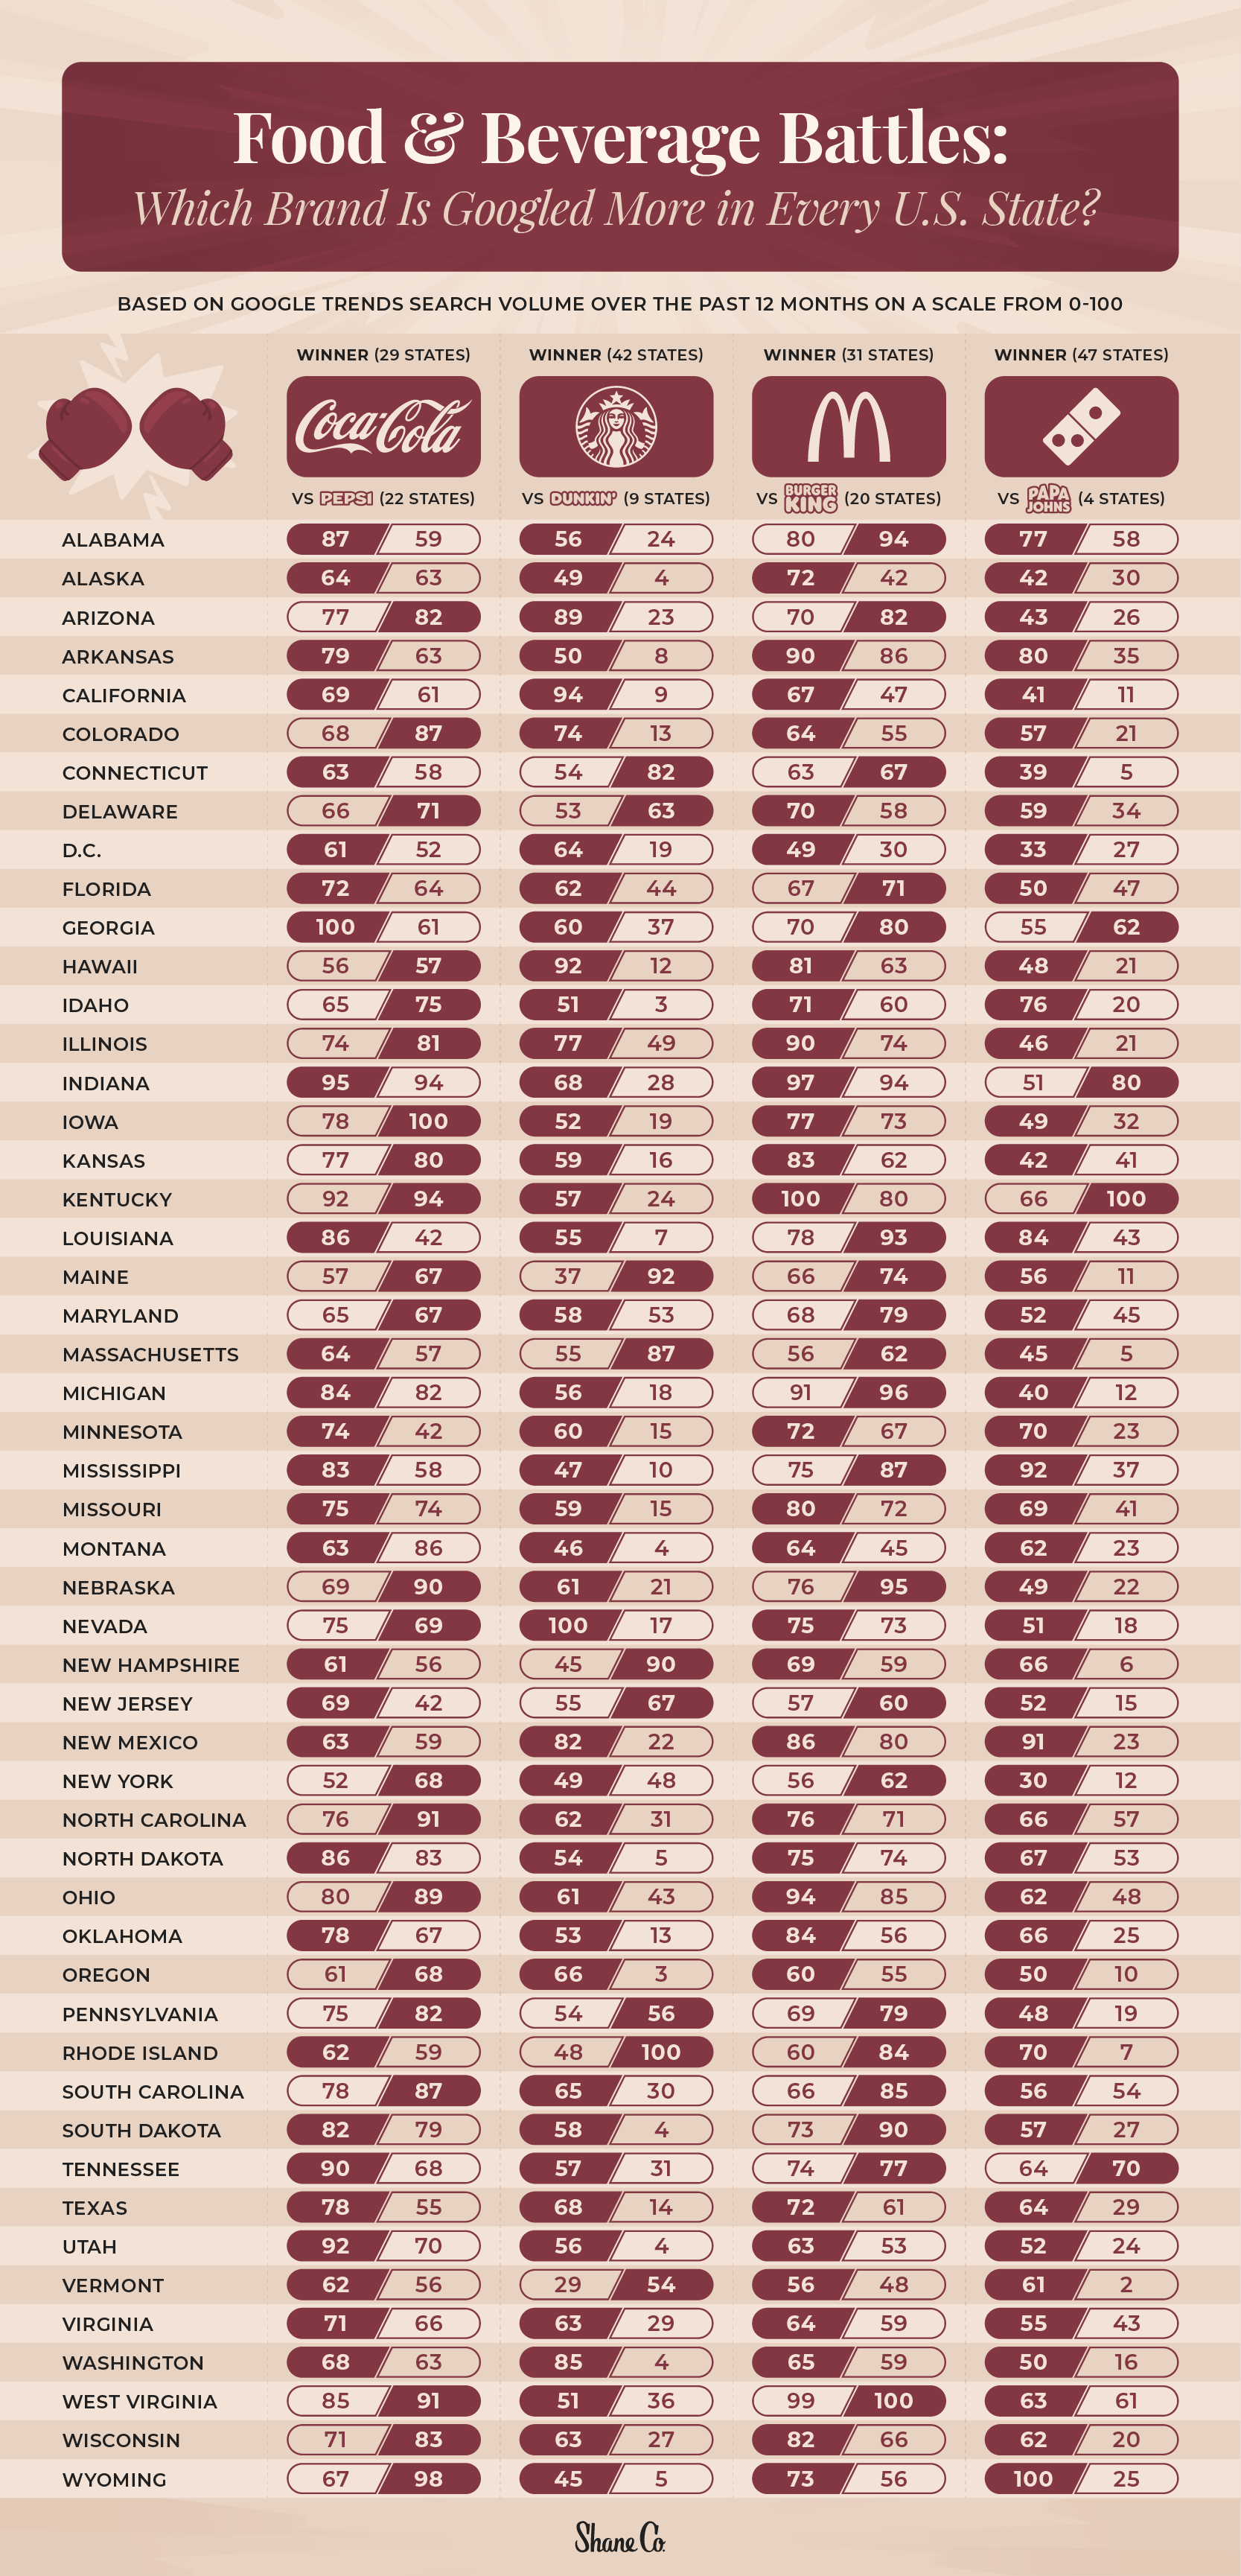
When it comes to the age-old debate of Coke vs. Pepsi, the competition is as fizzy as ever. In our head-to-head competitions, this iconic beverage rivalry proved to be the tightest race. Coke bubbles to the top as the most searched in 29 states, but Pepsi isn’t far behind, claiming the top spot in 22 states. It’s clear that America’s cola loyalties are split, with both brands pouring out immense popularity.
Shifting our focus to morning routines and coffee runs, Starbucks seems to have brewed its way to the top. The brand dominates U.S. search volume in 42 states from coast to coast. However, the Northeast tells a different tale. Dunkin’ takes the lead in nine states all located in the Northeast, including Connecticut, Delaware, Massachusetts, and Pennsylvania, proving that when it comes to coffee preferences, regional loyalties can make a significant difference.
And for those weekend pizza nights? Domino’s clearly delivers. The brand is the most searched in a whopping 47 states. On the other hand, Papa John’s managed to claim the top spot in four states. Interestingly, two of these states have a close connection to the brand: Indiana, where it was founded, and Georgia, its current headquarters. It seems that while Domino’s has a broader national appeal, Papa John’s retains strong ties to its roots.
App-titude Check: The Go-To Apps Across States

The tune of the nation sways toward Spotify when it comes to music streaming. It takes center stage in 34 states, leaving Apple Music with a dominant fan base in 17 states. The debate between these two music giants is as heated as ever, with playlists and exclusive releases being the battleground.
While both have revolutionized modern dating, Tinder still holds a significant lead in the U.S. over Bumble, as the go-to dating app in 40 states. Bumble, known for letting women make the first move, captures the top spot in 11 states, showing it’s a force to be reckoned with.
But the real talk of the tech town? The showdown between Threads (by Meta) and X (formerly Twitter). Threads has made an impressive debut securing the top spot in 30 states. While X has a legacy to lean on, it leads in 21 states. And while there might not be a real cage fight between Musk and Zuckerberg (as entertaining as that sounds), their digital platforms are clearly in a fierce rivalry. Threads coming out on top suggests that Zuckerberg’s Meta might just be throwing the first punch in this digital duel.
Other Household Names Go Head-to-Head
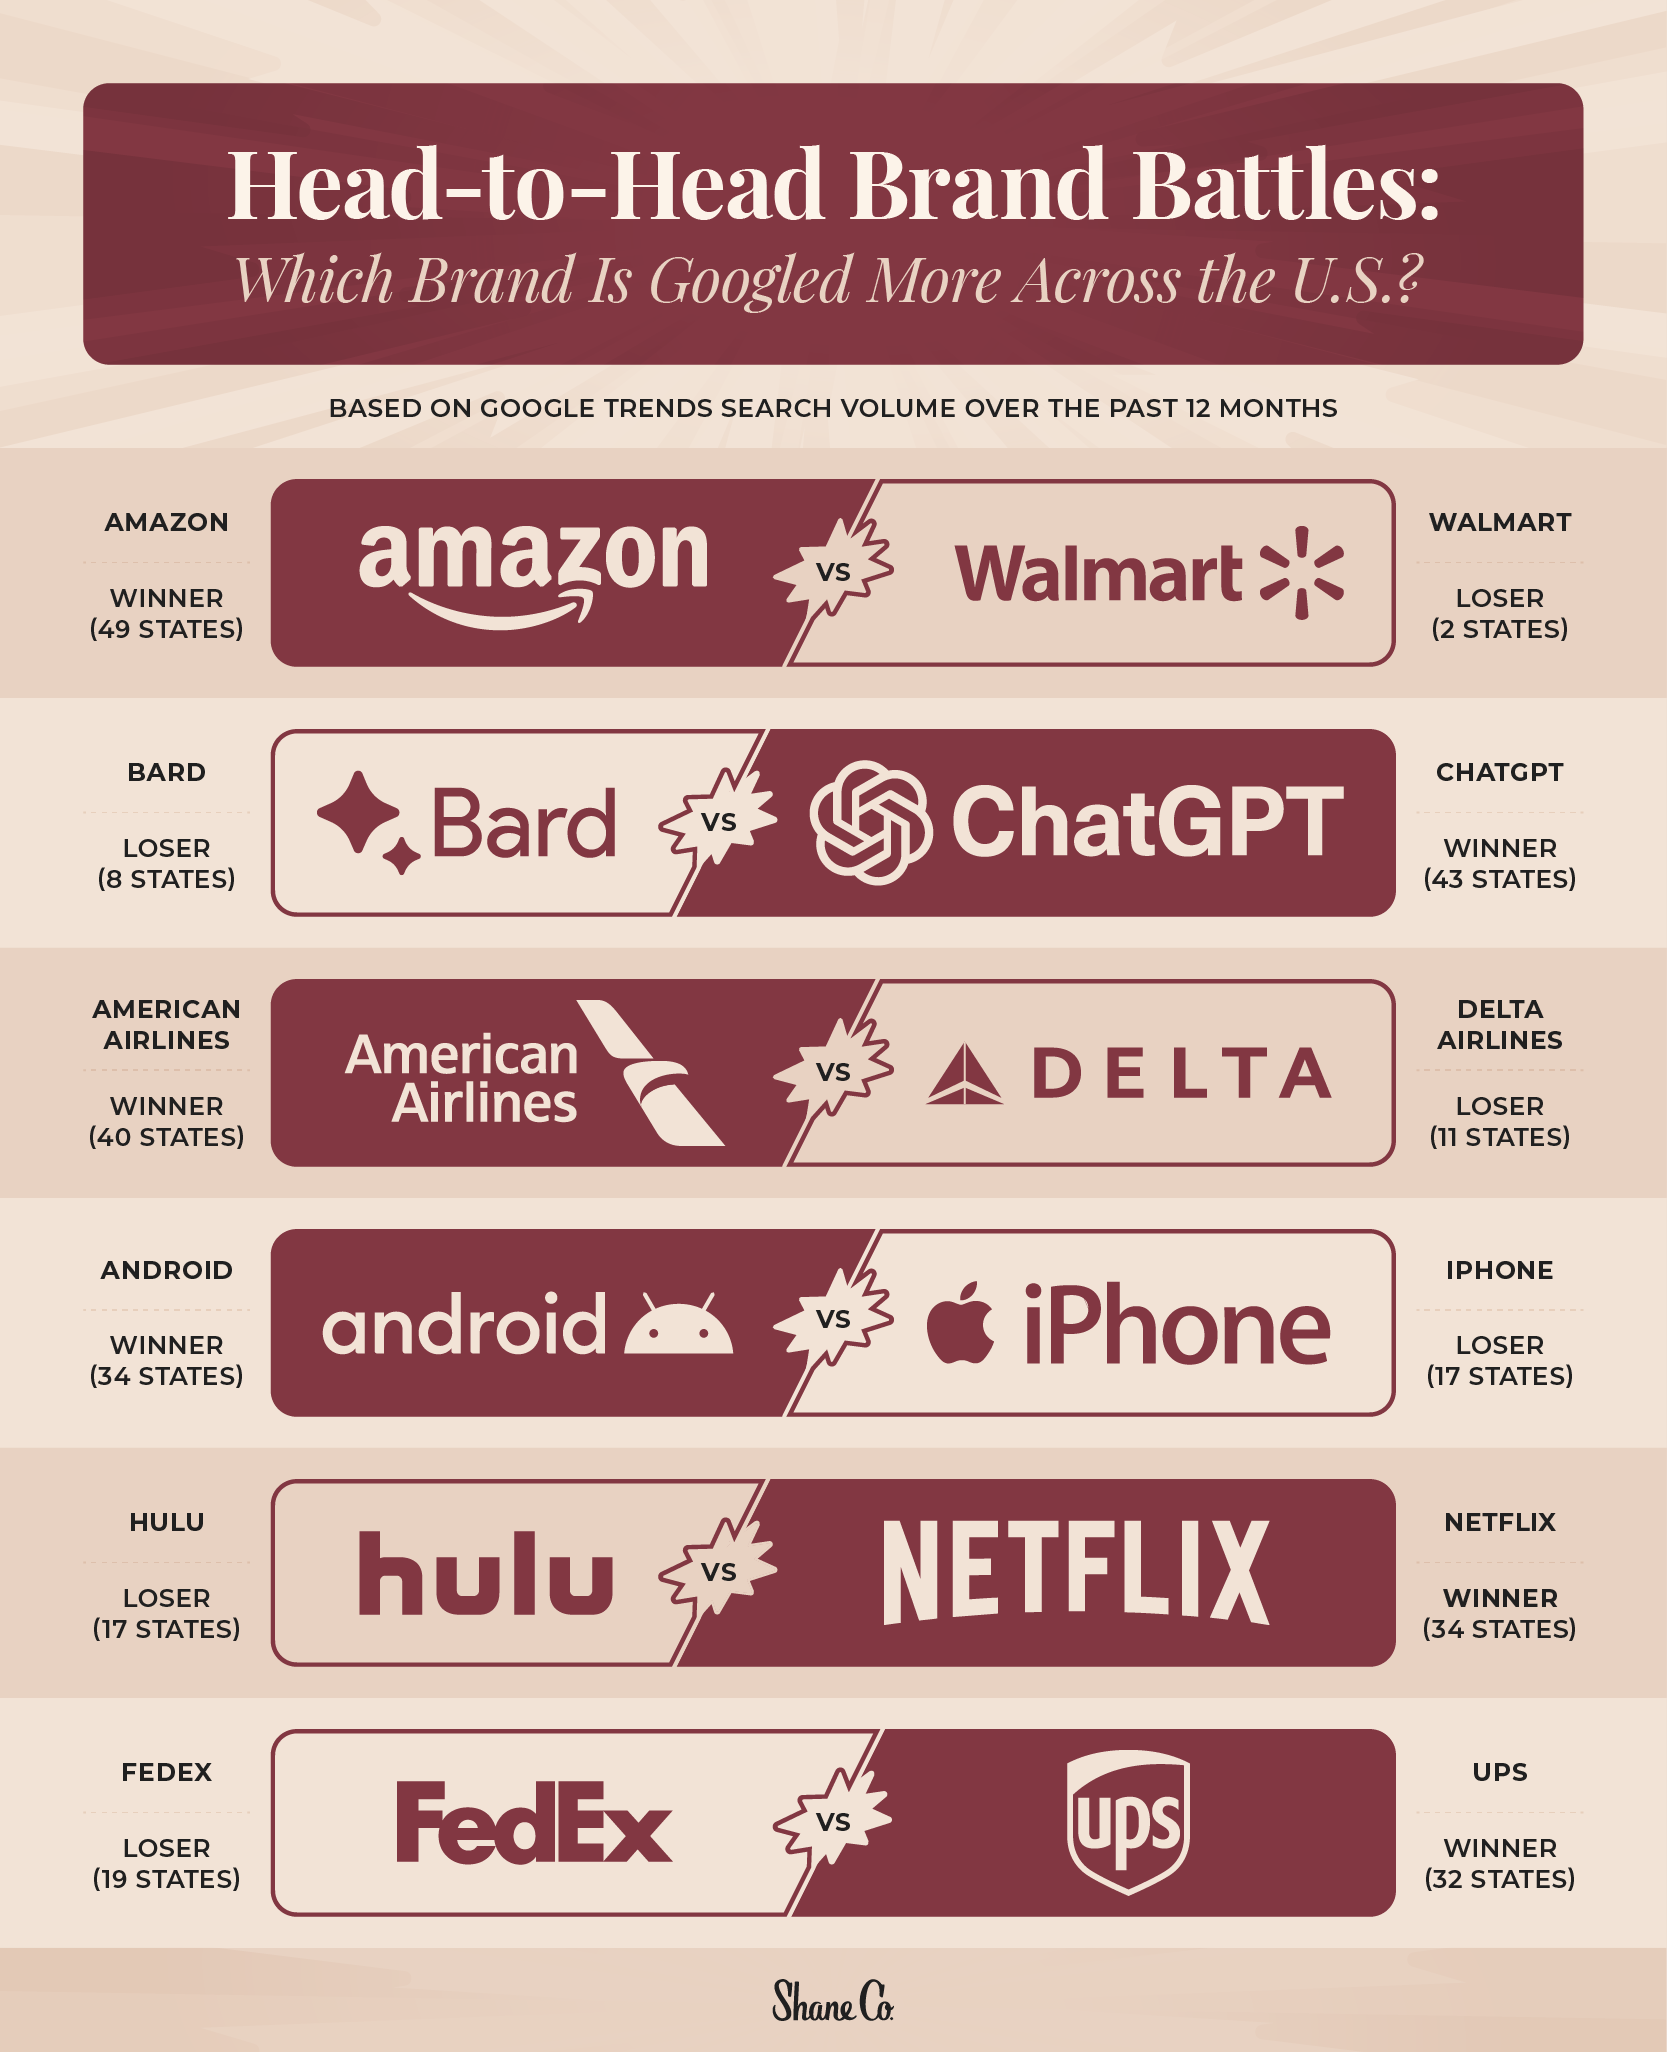
In the e-commerce arena, Amazon proves it’s the true online shopping giant. A whopping 49 states search for Amazon over Walmart. It’s clear that the convenience of Amazon Prime and its vast product selection has captured the nation’s attention, leaving Walmart in its digital dust in all but two states (Arkansas and Mississippi).
In the realm of smartphones, we were surprised to see Android leading the pack. Despite the cultural phenomenon that is the iPhone, Android emerges as the most searched in 34 states, a clear indication of its widespread appeal.
For frequent flyers, the skies are dominated by American Airlines, which soars to the top in 40 states, outpacing Delta, which claims the remaining 11.
In the AI and chatbot industry, ChatGPT is the name on everyone’s lips (or fingertips). With a sweeping lead in 43 states, it significantly outshines its competitor, Bard.
Sportswear sees another fierce competition, with Nike racing ahead in 47 states, leaving Adidas with a mere four-state footprint.
Lastly, when it comes to parcel deliveries, UPS is the carrier of choice in 32 states, while FedEx manages to claim the remaining 19.
Closing Thoughts
While brand loyalties may differ, one thing’s for sure: these household names are staples in our daily lives, and their rivalries are as intense as ever. Similarly, when it comes to relationships, loyalty binds partners together. If your dedication to your partner mirrors the allegiance you have for your favorite brands, you’re on the right track.
Just as we may have a soft spot for Coca-Cola or can’t imagine a day without Netflix, finding the perfect symbol of commitment is essential. Shane Co. understands the gravity of such moments. If you’re looking to express your loyalty and love, explore our gorgeous collection of engagement rings. Whether you have an eye for the classics or desire a customized creation, Shane Co. is here to ensure your love story shines brilliantly.
Methodology
To shed light on some of the most iconic brand rivalries, we began by curating a list of 14 standout brand face-offs. Using Google Trends, we pitted each brand against its rival to gauge which one has earned more search interest in each state. The search volume for each brand is scaled between 0 and 100, with higher numbers indicating greater search interest.
We collected search volume data over a 12-month span, from August 2022 to August 2023, for each brand rivalry. For the Threads vs. X (formerly Twitter) showdown, their data was gathered over a shorter two-month duration (July 1 through August 31), given that these are recently launched brand names.