
Worries about inflation have been the biggest economic story of recent months. Month-over-month and year-over-year price increases have been at historic highs through much of 2021 and into 2022, with categories like energy and vehicles seeing increases of more than 40% since the beginning of 2021.
A number of factors explain the recent nationwide trends in price increases. Strong fiscal stimulus from the federal government and rapid recovery in many sectors have brought more money into the U.S. economy, while a tight labor market has led to wage increases for many workers. With more money to spend, consumer demand has increased, but ongoing issues with global supply chains have made many physical goods scarce. The result has been price increases in nearly every category, which puts pressure on households’ finances.
One common measure of inflation is the Consumer Price Index, calculated by the U.S. Bureau of Labor Statistics. The CPI measures prices paid for a set of typical consumer expenses, including food, energy, transportation, apparel, shelter, and more. The year-over-year percentage change in the CPI has topped 5% in every month since June 2021 and reached 7.5% in January of 2022.

One of the biggest factors pressuring household finances since the pandemic began has been a rapid increase in the cost of housing, which is the largest regular expense for most families. The S&P/Case-Shiller U.S. National Home Price Index, which tracks the change in residential home prices in different regions of the country, showed year-over-year home price increases of more than 10% for every month of 2021, peaking at 20% in August. Aside from a brief span in 2013 and 2014, growth in home prices had not topped 10% since the peak of the housing bubble in the early to mid-2000s.
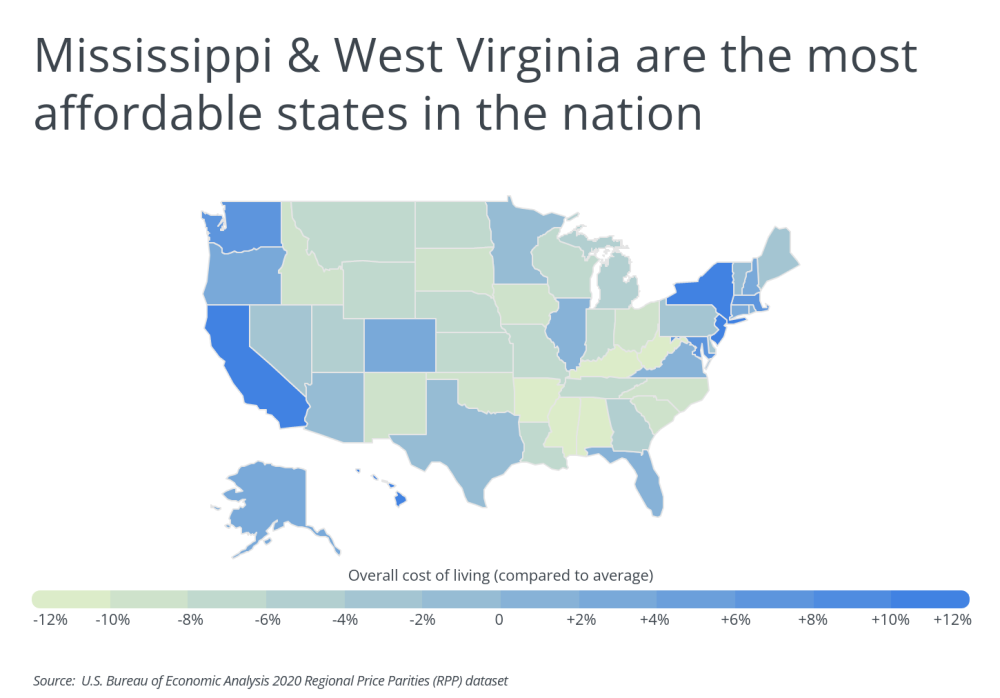
Most common measures of inflation are simply an average and may not clearly reflect differences for individual households. One major factor affecting how consumers experience prices across a range of goods, services, and housing is geography. According to data from the U.S. Bureau of Economic Analysis, four states—Hawaii, New Jersey, California, and New York—have typical prices more than 10% above the national average, while five others—Mississippi, West Virginia, Arkansas, Alabama, and Kentucky—have prices more than 10% below the average. This means that between two households earning comparable amounts in Hawaii and Mississippi, the Mississippi household’s dollar will go much further.
TRENDING
Handymen can do all sorts of jobs, from staining a deck to touch-up paint work. Tell us what you need done, and we can help match you with a competent and affordable handyman in no time.
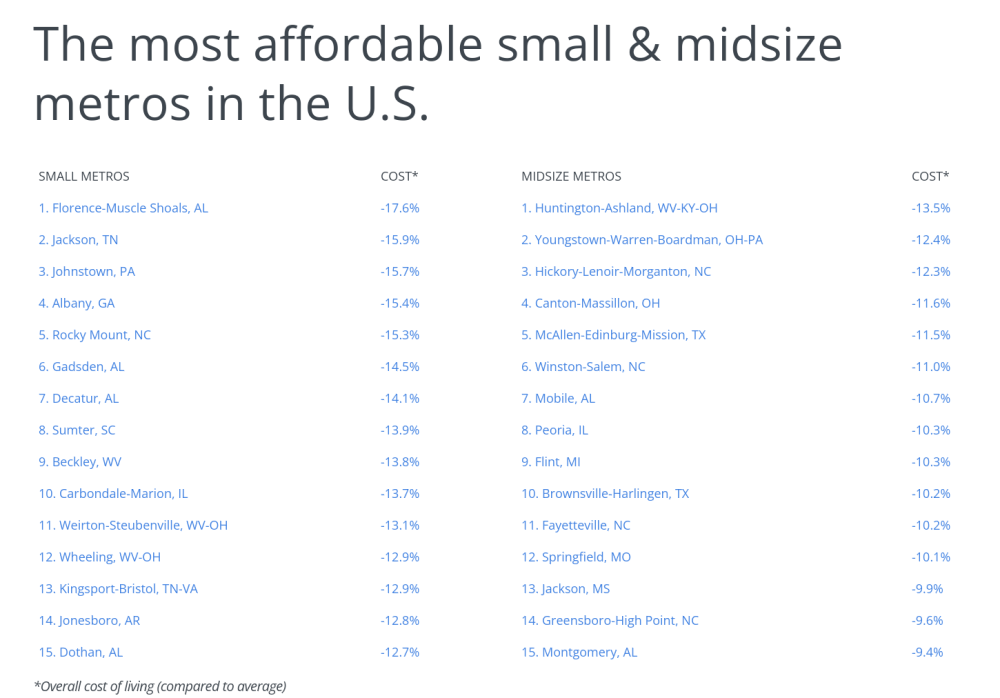
The previously mentioned cost of housing contributes significantly to geographic differences in price levels at both the state and local level. The most affordable locations tend to be those with lower housing costs. Among the most affordable large metros in the U.S., 13 of the top 15 have housing costs that are at least 10% less than the overall average, and in each of the top seven metros, housing is between 20% and 30% cheaper than the average.
The data used in this analysis is from the U.S. Bureau of Economic Analysis 2020 Regional Price Parities (RPP) dataset, which tracks relative cost of living differences across geographies. To determine the locations where Americans’ incomes go furthest, researchers at Porch looked at the overall cost of living compared to the national average, taking into account consumer goods, services, and housing. In the event of a tie, the location with the larger per capita personal income was ranked higher.
Here are the metropolitan areas where your dollar goes the furthest.
The Most Affordable Large Metros in the U.S.

Photo Credit: Farid Sani / Shutterstock
15. Raleigh-Cary, NC
- Overall cost of living (compared to average): -4.3%
- Cost of housing (compared to average): -4.8%
- Cost of goods (compared to average): -4.3%
- Cost of utilities (compared to average): +1.1%
- Per capita personal income: $60,884
RELATED
Don’t try to do the job of a general contractor yourself. Contractors know that their businesses can be made or broken on their reputation, and they will work hard to get your project done on time, orchestrating the work of subcontractors so that the whole project turns out just as planned. Find a general contractor near you.

Photo Credit: Sean Pavone / Shutterstock
14. Richmond, VA
- Overall cost of living (compared to average): -4.6%
- Cost of housing (compared to average): -5.0%
- Cost of goods (compared to average): -4.7%
- Cost of utilities (compared to average): +1.2%
- Per capita personal income: $61,148

Photo Credit: Photosbykaity / Shutterstock
13. Grand Rapids-Kentwood, MI
- Overall cost of living (compared to average): -5.3%
- Cost of housing (compared to average): -11.9%
- Cost of goods (compared to average): -6.2%
- Cost of utilities (compared to average): -2.3%
- Per capita personal income: $54,037

Photo Credit: Agnieszka Gaul / Shutterstock
12. Indianapolis-Carmel-Anderson, IN
- Overall cost of living (compared to average): -5.3%
- Cost of housing (compared to average): -13.5%
- Cost of goods (compared to average): -5.6%
- Cost of utilities (compared to average): +7.2%
- Per capita personal income: $60,431

Photo Credit: Sean Pavone / Shutterstock
11. Kansas City, MO-KS
- Overall cost of living (compared to average): -5.3%
- Cost of housing (compared to average): -15.0%
- Cost of goods (compared to average): -4.5%
- Cost of utilities (compared to average): +10.3%
- Per capita personal income: $58,057

Photo Credit: Jon Bilous / Shutterstock
10. Charlotte-Concord-Gastonia, NC-SC
- Overall cost of living (compared to average): -5.4%
- Cost of housing (compared to average): -11.3%
- Cost of goods (compared to average): -4.3%
- Cost of utilities (compared to average): +1.7%
- Per capita personal income: $56,682

Photo Credit: Agnieszka Gaul / Shutterstock
9. Columbus, OH
- Overall cost of living (compared to average): -5.8%
- Cost of housing (compared to average): -14.6%
- Cost of goods (compared to average): -5.9%
- Cost of utilities (compared to average): -2.7%
- Per capita personal income: $56,252

Photo Credit: Sean Pavone / Shutterstock
8. Tucson, AZ
- Overall cost of living (compared to average): -6.2%
- Cost of housing (compared to average): -14.6%
- Cost of goods (compared to average): -3.4%
- Cost of utilities (compared to average): +4.7%
- Per capita personal income: $48,373

Photo Credit: Sean Pavone / Shutterstock
7. Oklahoma City, OK
- Overall cost of living (compared to average): -6.2%
- Cost of housing (compared to average): -27.1%
- Cost of goods (compared to average): -3.9%
- Cost of utilities (compared to average): +10.9%
- Per capita personal income: $52,688

Photo Credit: Agnieszka Gaul / Shutterstock
6. Cincinnati, OH-KY-IN
- Overall cost of living (compared to average): -6.5%
- Cost of housing (compared to average): -20.0%
- Cost of goods (compared to average): -5.9%
- Cost of utilities (compared to average): -1.3%
- Per capita personal income: $59,607

Photo Credit: Sean Pavone / Shutterstock
5. Cleveland-Elyria, OH
- Overall cost of living (compared to average): -7.0%
- Cost of housing (compared to average): -20.5%
- Cost of goods (compared to average): -5.9%
- Cost of utilities (compared to average): -2.6%
- Per capita personal income: $58,846

Photo Credit: Sean Pavone / Shutterstock
4. Tulsa, OK
- Overall cost of living (compared to average): -7.1%
- Cost of housing (compared to average): -30.0%
- Cost of goods (compared to average): -3.9%
- Cost of utilities (compared to average): +11.0%
- Per capita personal income: $58,071

Photo Credit: Sean Pavone / Shutterstock
3. Memphis, TN-MS-AR
- Overall cost of living (compared to average): -7.3%
- Cost of housing (compared to average): -23.2%
- Cost of goods (compared to average): -4.3%
- Cost of utilities (compared to average): +5.2%
- Per capita personal income: $51,155
TRENDING
Are your kitchen cabinets looking a little worn out? It might be time for an upgrade. Here’s what it would cost to install kitchen cabinets in your home.

Photo Credit: Sean Pavone / Shutterstock
2. Birmingham-Hoover, AL
- Overall cost of living (compared to average): -7.4%
- Cost of housing (compared to average): -28.5%
- Cost of goods (compared to average): -4.5%
- Cost of utilities (compared to average): +20.3%
- Per capita personal income: $55,074

Photo Credit: Sean Pavone / Shutterstock
1. Louisville/Jefferson County, KY-IN
- Overall cost of living (compared to average): -8.1%
- Cost of housing (compared to average): -29.2%
- Cost of goods (compared to average): -4.4%
- Cost of utilities (compared to average): +4.5%
- Per capita personal income: $55,676
Methodology & Detailed Findings
The data used in this analysis is from the U.S. Bureau of Economic Analysis 2020 Regional Price Parities (RPP) dataset, which tracks relative cost of living differences across geographies. To determine the locations where Americans’ dollar goes furthest, researchers looked at the “All Items RPP,” which covers all consumer goods and services including housing. In the event of a tie, the location with the larger per capita personal income was ranked higher. To improve relevance, only locations with at least 100,000 residents were included. Additionally, metropolitan areas were grouped into cohorts based on population size: small (100,000–349,999), midsize (350,000–999,999), and large (1,000,000 or more).


