Hurricanes are the most violent storms on Earth. People call these storms by other names, such as typhoons or cyclones, depending on where they occur.
The scientific term for ALL of these storms is tropical cyclone. Only tropical cyclones that form over the Atlantic Ocean or eastern and central Pacific Ocean are called “hurricanes.”
Whatever they are called, tropical cyclones all form the same way.
Tropical cyclones are like giant engines that use warm, moist air as fuel. That is why they form only over warm ocean waters near the equator. This warm, moist air rises and condenses to form clouds and storms.
As this warmer, moister air rises, there’s less air left near the Earth’s surface. Essentially, as this warm air rises, this causes an area of lower air pressure below.
This starts the ‘engine’ of the storm. To fill in the low pressure area, air from surrounding areas with higher air pressure pushes in. That “new” air near the Earth’s surface also gets heated by the warm ocean water so it also gets warmer and moister and then it rises.
As the warm air continues to rise, the surrounding air swirls in to take its place. The whole system of clouds and wind spins and grows, fed by the ocean’s heat and water evaporating from the surface.
As the storm system rotates faster and faster, an eye forms in the center. It is vey calm and clear in the eye, with very low air pressure.
Tropical cyclones usually weaken when they hit land, because they are no longer being “fed” by the energy from the warm ocean waters. However, when they move inland, they can drop many inches of rain causing flooding as well as wind damage before they die out completely.
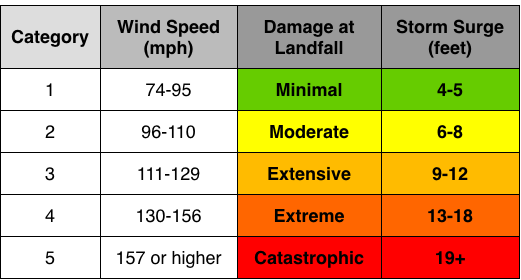
There are five types, or categories, of hurricanes. The scale of categories is called the Saffir-Simpson Hurricane Scale and they are based on wind speed.
How Does NASA Study Hurricanes?
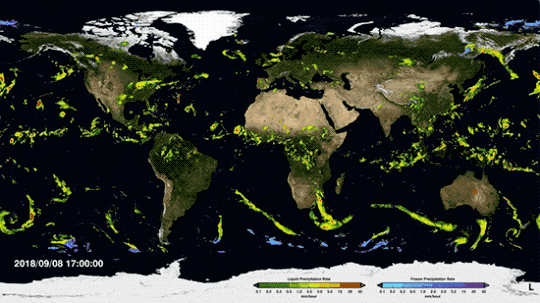
Our satellites gather information from space that are made into pictures. Some satellite instruments measure cloud and ocean temperatures. Others measure the height of clouds and how fast rain is falling. Still others measure the speed and direction of winds.
We also fly airplanes into and above hurricanes. The instruments aboard planes gather details about the storm. Some parts are too dangerous for people to fly into. To study these parts, we use airplanes that operate without people.
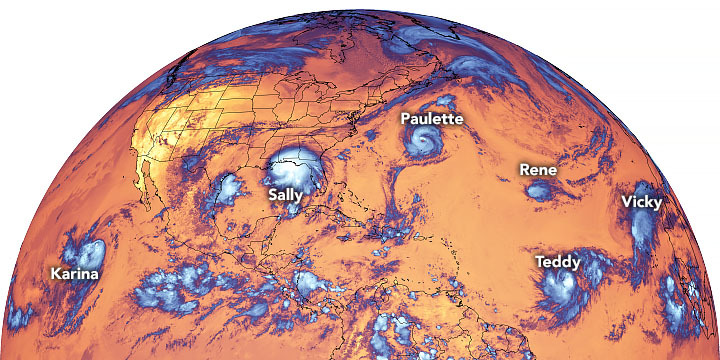
June 1 marks the start of hurricane season in the Atlantic Ocean. Last year’s hurricane season saw a record-setting 30 named storms. Twelve made landfall in the United States, also a record. From space, NASA has unique views of hurricanes and works with other government agencies – like the National Oceanographic and Atmospheric Administration (NOAA) – to better understand individual storms and entire hurricane seasons.
Here, five ways NASA is changing hurricane science:
1.We can see storms from space
From space, we can see so much more than what’s visible to the naked eye. Among our missions, NASA and NOAA have joint satellite missions monitoring storms in natural color – basically, what our eyes see – as well as in other wavelengths of light, which can help identify features our eyes can’t on their own. For instance, images taken in infrared can show the temperatures of clouds, as well as allow us to track the movement of storms at night.
2. We can see inside hurricanes in 3D
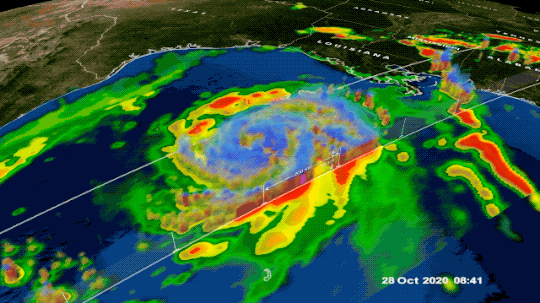
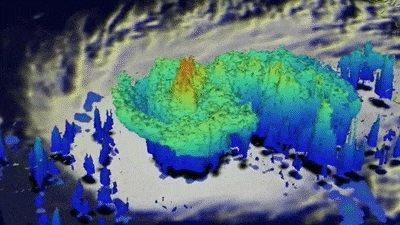
If you’ve ever had a CT scan or X-ray done, you know how important 3D imagery can be to understanding what’s happening on the inside. The same concept applies to hurricanes. Our Global Precipitation Measurement mission’s radar and microwave instruments can see through storm clouds to see the precipitation structure of the storm and measure how much total rain is falling as a result of the storm. This information helps scientists understand how the storm may change over time and understand the risk of severe flooding.
3. We’re looking at how climate change affects hurricane behavior
Climate change is likely causing storms to behave differently. One change is in how storms intensify: More storms are increasing in strength quickly, a process called rapid intensification, where hurricane wind speeds increase by 35 mph (or more) in just 24 hours.
In 2020, a record-tying nine storms rapidly intensified. These quick changes in storm strength can leave communities in their path without time to properly prepare.
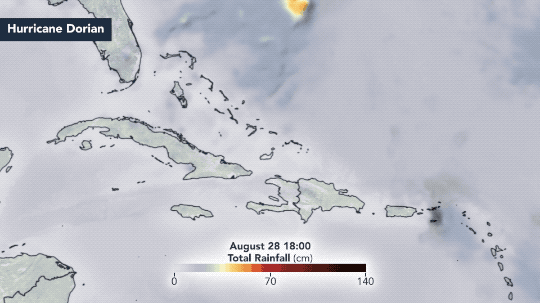
It’s not just about how quickly hurricanes gain strength. We’re also looking at how climate change may be causing storms to move more slowly, which makes them more destructive. These “stalled” storms can slow to just a few miles an hour, dumping rain and damaging winds on one location at a time. Hurricane Dorian, for example, stalled over Grand Bahama and left catastrophic damage in its wake. Hurricanes Harvey and Florence experienced stalling as well, both causing major flooding.
4. We can monitor damage done by hurricanes
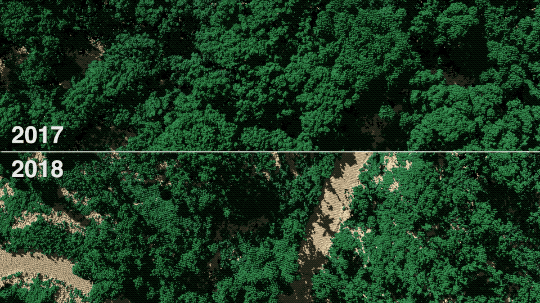
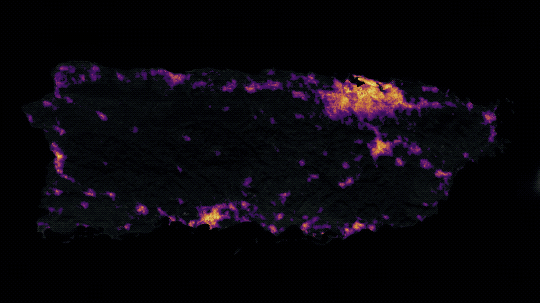
Hurricane Maria reshaped Puerto Rico’s forests. The storm destroyed so many large trees that the overall height of the island’s forests was shortened by one-third. Measurements from the ground, the air, and space gave researchers insights into which trees were more susceptible to wind damage.
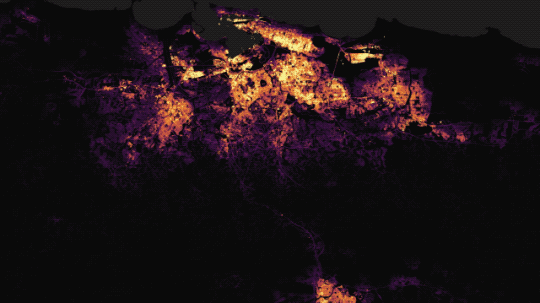
Months after Hurricane Maria, parts of Puerto Rico still didn’t have power. Using satellite data, researchers mapped which neighborhoods were still dark and analyzed demographics and physical attributes of the areas with the longest wait for power.
5. We help communities prepare for storms and respond to their aftermath
The data we collect is available for free to the public. We also partner with other federal agencies, like the Federal Emergency Management Agency (FEMA), and regional and local governments to help prepare for and understand the impacts of disasters like hurricanes.
In 2020, our Disasters Program provided data to groups in Alabama, Louisiana, and Central America to identify regions significantly affected by hurricanes. This helps identify vulnerable communities and make informed decisions about where to send resources.
The 2021 Atlantic hurricane season starts today, June 1. Our colleagues at NOAA are predicting another active season, with an above average number of named storms. At NASA, we’re developing new technology to study how storms form and behave, including ways to understand Earth as a system. Working together with our partners at NOAA, FEMA and elsewhere, we’re ready to help communities weather another year of storms.
Technology we’ve developed is helping study the movement of storms.
From satellites that can slice through a hurricane with 3-D vision to computer models of gale force winds, scientists now have unprecedented ways of viewing extreme weather.
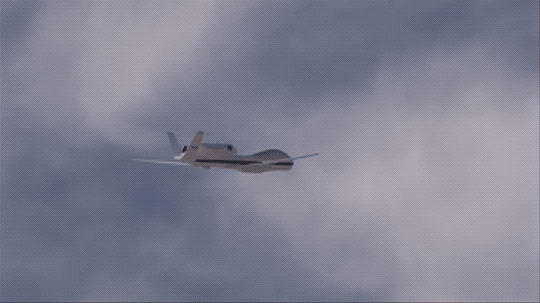
This August, we’re sending an unmanned aircraft called a Global Hawk to study hurricanes. This mission is called the “East Pacific Origins and Characteristics of Hurricanes,” or EPOCH. It will fly over developing tropical storms to investigate how they progress and intensify.
The three instruments aboard this Global Hawk aircraft will map out 3-D patterns of temperature, pressure, humidity, precipitation and wind speed as well as the role of the East Pacific Ocean in global cyclone formation. These measurements will help scientists better understand the processes that control storm intensity and the role of the East Pacific Ocean in global cyclone formation.
To better understand hurricane formation and intensity, scientists also utilize models and other observations.
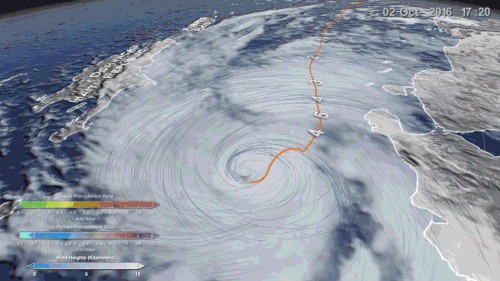
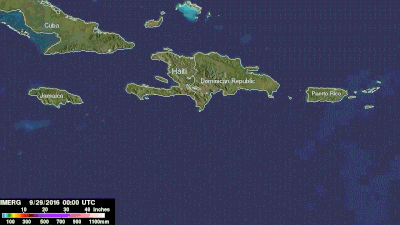
In September 2016, GPM captured Hurricane Matthew’s development from a Category 1 to Category 5 hurricane in less than 24 hours.
Extreme rainfall was seen in several stages of the storm, causing significant flooding and landslides when it passed by Cuba, Haiti and the Dominican Republic.
By combining model and observed data, scientists can analyze storms like never before. They can also better understand how hurricanes and other powerful storms can potentially impact society.
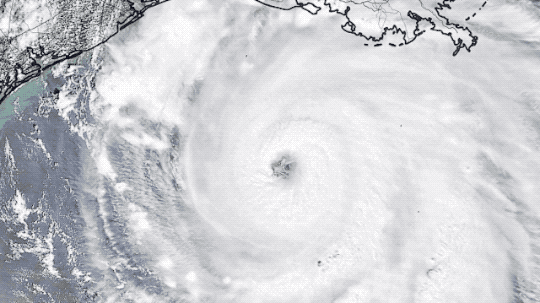
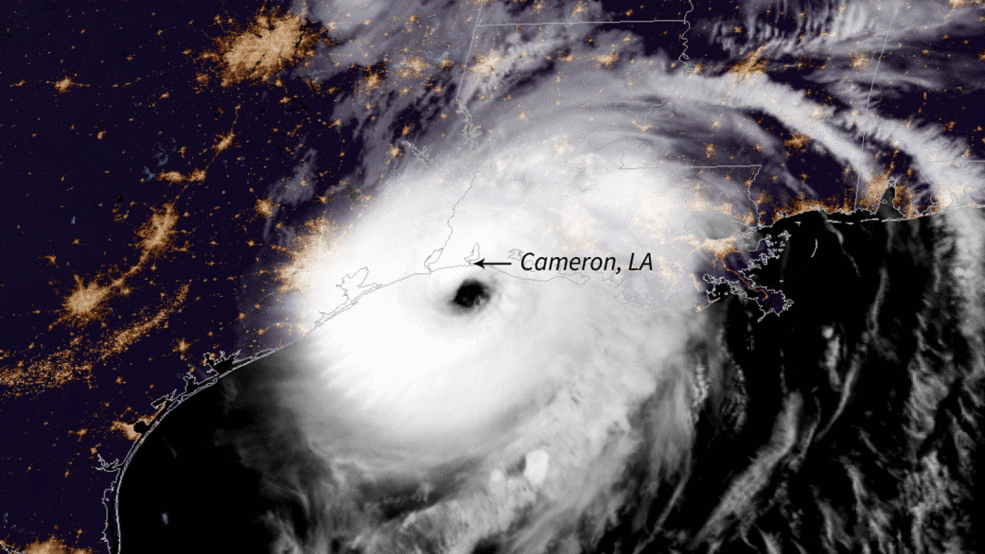
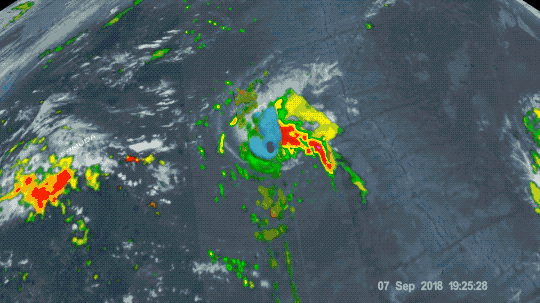
We’re using our unique vantage point in space to provide observations and data of Hurricane Irma and other tropical storms. Hurricanes Irma and Jose are seen here in a 12-hour long infrared loop. Scientists monitor storms in infrared to closely monitor clouds and storm intensity. We continue to provide satellite imagery for these storms, tracking its trajectory, force and precipitation to inform forecasters at the National Hurricane Center.
As these storms continue their westward drive in the coming days, they will be passing over waters that are warmer than 30 degrees Celsius (86 degrees Fahrenheit)—hot enough to sustain a category 5 storm. Warm oceans, along with low wind shear, are two key ingredients that fuel and sustain hurricanes.
The 2017 Atlantic hurricane season was among the top ten most active seasons in recorded history. Our experts are exploring what made this year particularly active and the science behind some of the biggest storms to date.
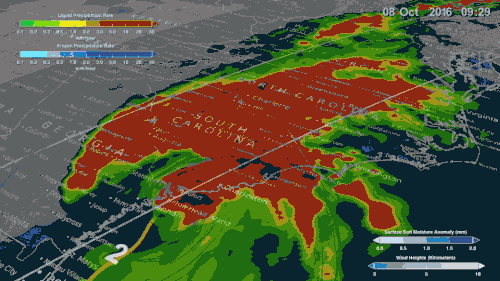
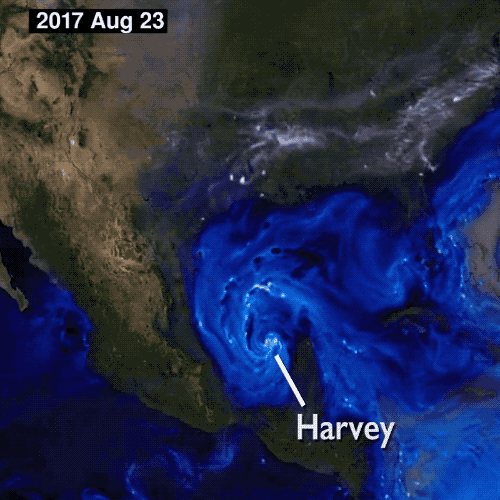
After a period of 12 years without a Category 3 or higher hurricane making landfall in the U.S., Hurricane Harvey made landfall over Texas as a Category 4 hurricane this August.
Harvey was also the biggest rainfall event ever to hit the continental U.S. with estimates more than 49 inches of rain.
Data like this from our Global Precipitation Measurement Mission, which shows the amount of rainfall from the storm and temperatures within the story, are helping scientists better understand how storms develop.
The unique vantage point of satellites can also help first responders, and this year satellite data helped organizations map out response strategies during hurricanes Harvey, Irma and Maria.
In addition to satellites, we use ground stations and aircraft to track hurricanes.
We also use the capabilities of satellites like Suomi NPP and others that are able to take nighttime views. In this instance, we were able to view the power outages in Puerto Rico. This allowed first responders to see where the location of impacted urban areas.
The combined effort between us, NOAA, FEMA and other federal agencies helps us understand more about how major storms develop, how they gain strength and how they affect us.
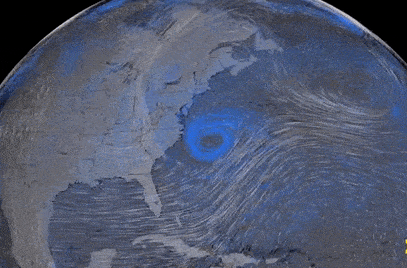
What do hurricanes look like from space? It depends on how
you look! We have satellites, cameras and instruments all working together to
give us the big picture of storms like Florence.
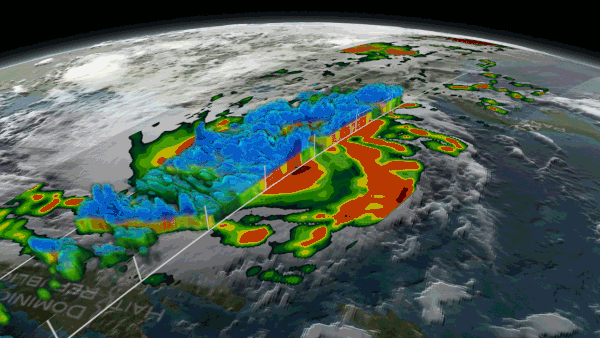
On Sept. 7, our GPM core observatory satellite flew over
Florence, capturing a 3D image as the storm’s clouds started to break apart
before reforming.
Other NOAA satellites, like GOES, gather high-resolution, detailed
views of hurricanes, letting us peek into the eye of the storm.
Zooming out a bit, the Suomi-NPP satellite helps us track
Hurricane Florence, and the following tropical storms, as they move closer to
landfall or dissipate over the ocean.
From farther away (a
million miles from Earth!), the EPIC instrument on NOAA’s DSCOVR satellite
captured images of all three of these storms as they moved closer to North
America.
We use our space-based and airborne instruments to provide
innovative data on hurricanes to advance scientists’ understanding of these
storms. You can follow our latest views of Hurricane Florence here and get the
latest forecast from NOAA’s National Hurricane Center here.
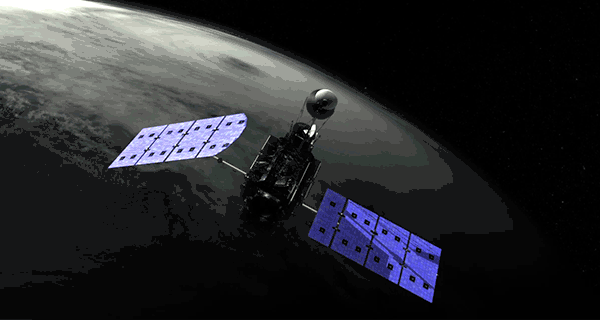
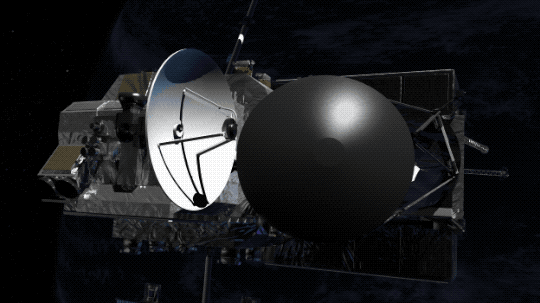
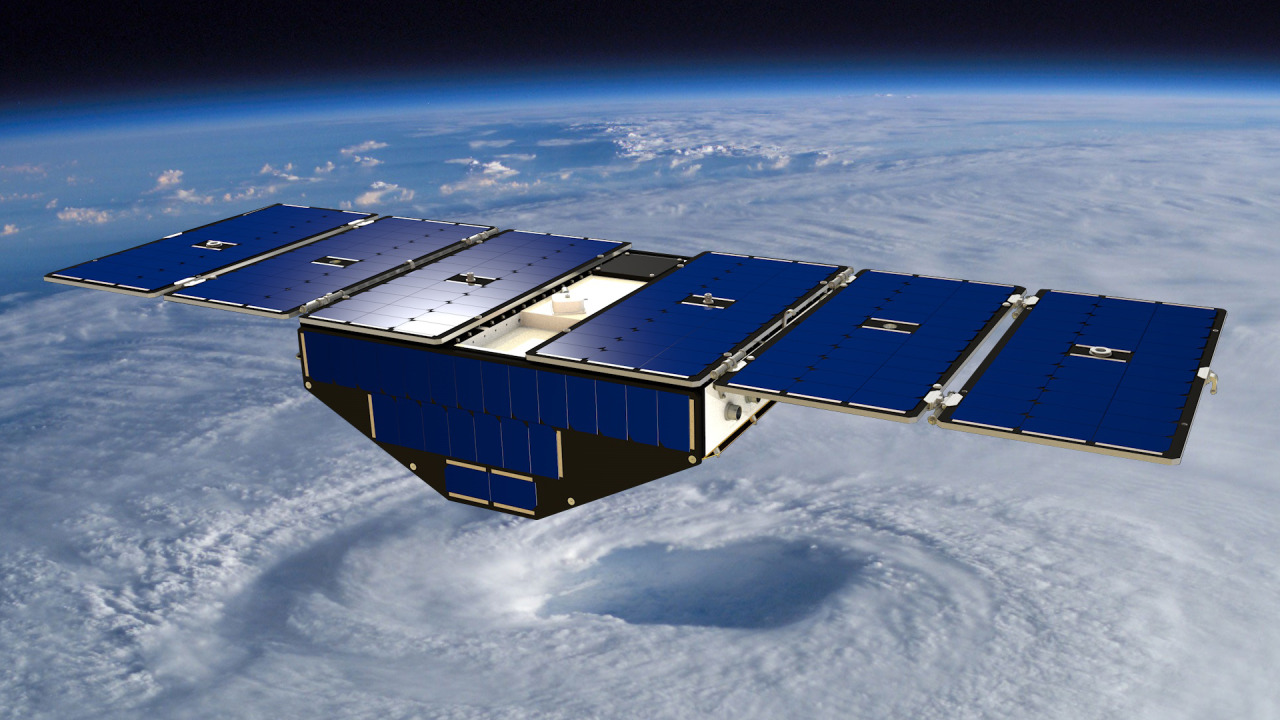
The same GPS technology that helps people get where they’re going in a car will soon be used in space in an effort to improve hurricane forecasting. The technology is a key capability in a NASA mission called the Cyclone Global Navigation Satellite System (CYGNSS).
The CYGNSS mission, led by the University of Michigan, will use eight micro-satellite observatories to measure wind speeds over Earth’s oceans, increasing the ability of scientists to understand and predict hurricanes. Each microsatellite observatory will make observations based on the signals from four GPS satellites.
The CYGNSS microsatellite observatories will only receive signals broadcast directly to them from GPS satellites already orbiting the Earth and the reflection of the same satellite’s signal reflected from the Earth’s surface. The CYGNSS satellites themselves will not broadcast.
The use of eight microsatellite observatories will decrease the revisit time as compared with current individual weather satellites. The spacecraft will be deployed separately around the planet, with successive satellites passing over the same region every 12 minutes.
This will be the first time that satellites can peer through heavy tropical rainfall into the middle of hurricanes and predict how intense they are before and during landfall.
As the CYGNSS and GPS constellations orbit around the Earth, the interaction of the two systems will result in a new image of wind speed over the entire tropics every few hours, compared to every few days for a single satellite.
Another advantage of CYGNSS is that its orbit is designed to measure only in the tropics…where hurricanes develop and are most often located. The focus on tropical activity means that the instruments will be able to gather much more useful data on weather systems exclusively found in the tropics. This data will ultimately be used to help forecasters and emergency managers make lifesaving decisions.
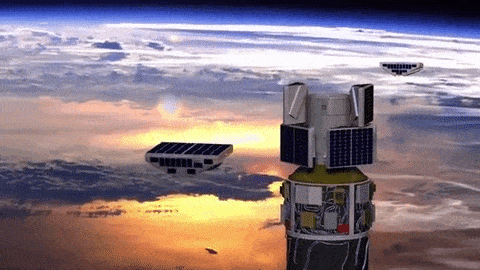
Launch!
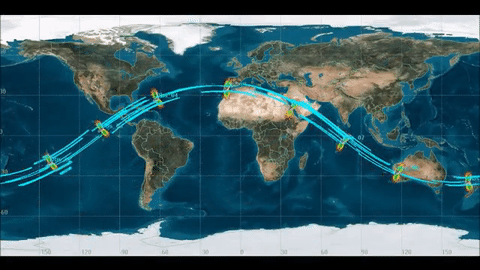
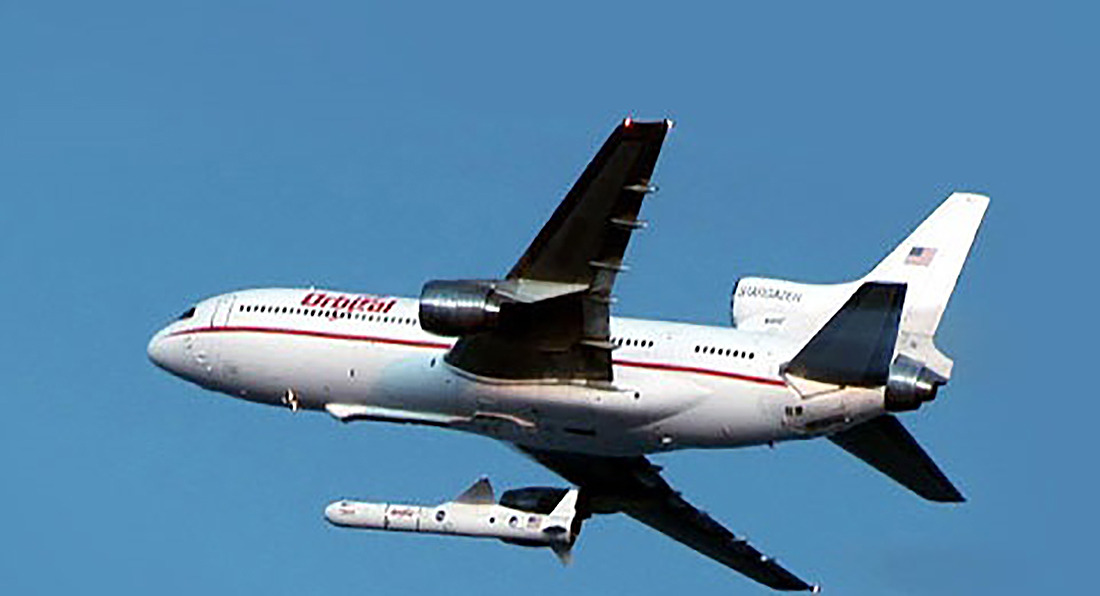
CYGNSS launched at 8:37 a.m. EST on Thursday, Dec. 15, from our Kennedy Space Center in Florida. CYGNSS launched aboard an Orbital ATK Pegasus XL rocket, deployed from Orbital’s “Stargazer” L-1011 carrier aircraft.
Pegasus is a winged, three-stage solid propellant rocket that can launch a satellite into low Earth orbit. How does it work? Great question!
After takeoff, the aircraft (which looks like a commercial airplane..but with some special quirks) flies to about 39,000 feet over the ocean and releases the rocket.
After a five-second free fall in a horizontal position, the Pegasus first stage ignites. The aerodynamic lift, generated by the rocket’s triangle-shaped wing, delivers the payload into orbit in about 10 minutes.
Pegasus is used to deploy small satellites weighing up to 1,000 pounds into low Earth orbit.
And success! The eight CYGNSS satellites were successfully deployed into orbit!
If you’ve ever looked at a hurricane forecast, you’re probably familiar with “cones of uncertainty,” the funnel-shaped maps showing a hurricane’s predicted path. Thirty years ago, a hurricane forecast five days before it made landfall might have a cone of uncertainty covering most of the East Coast. The result? A great deal of uncertainty about who should evacuate, where it was safe to go, and where to station emergency responders and their equipment.
Over the years, hurricane forecasters have succeeded in shrinking the cone of uncertainty for hurricane tracks, with the help of data from satellites. Polar-orbiting satellites, which fly nearly directly above the North and South Poles, are especially important in helping cut down on forecast error.
The orbiting electronic eyeballs key to these improvements: the Joint Polar Satellite System (JPSS) fleet. A collaborative effort between NOAA and NASA, the satellites circle Earth, taking crucial measurements that inform the global, regional and specialized forecast models that have been so critical to hurricane track forecasts.
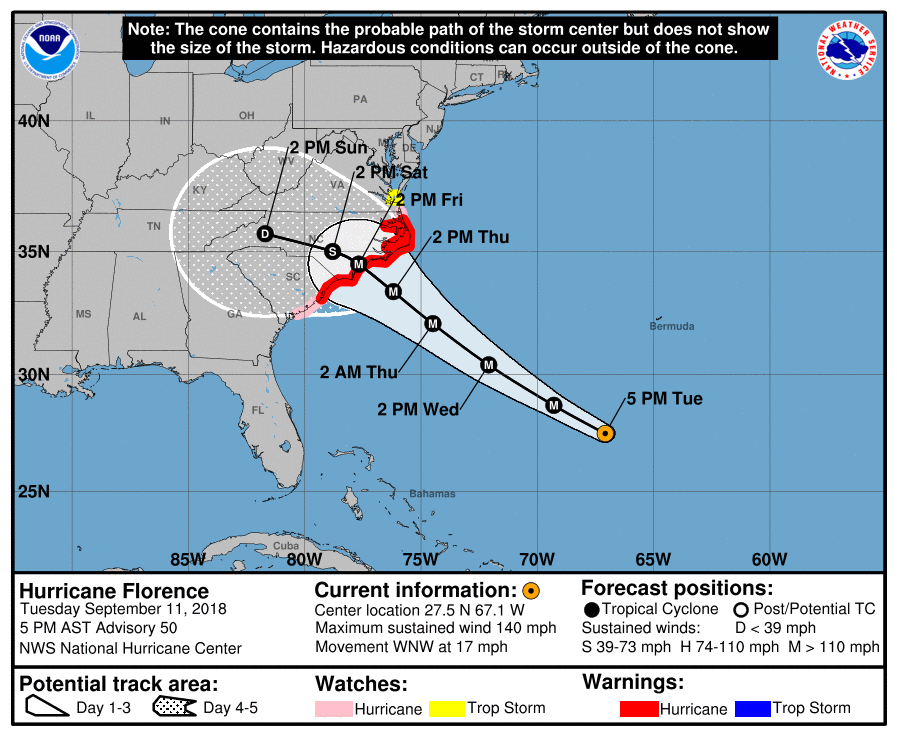
The forecast successes keep rolling in. From Hurricanes Harvey, Irma and Maria in 2017 through Hurricanes Florence and Michael in 2018, improved forecasts helped manage coastlines, which translated into countless lives and property saved. In September 2018, with the help of this data, forecasters knew a week ahead of time where and when Hurricane Florence would hit. Early warnings were precise enough that emergency planners could order evacuations in time — with minimal road clogging. The evacuations that did not have to take place, where residents remained safe from the hurricane’s fury, were equally valuable.
The satellite benefits come even after the storms make landfall. Using satellite data, scientists and forecasters monitor flooding and even power outages. Satellite imagery helped track power outages in Puerto Rico after Hurricane Maria and in the Key West area after Hurricane Irma, which gave relief workers information about where the power grid was restored – and which regions still lacked electricity.
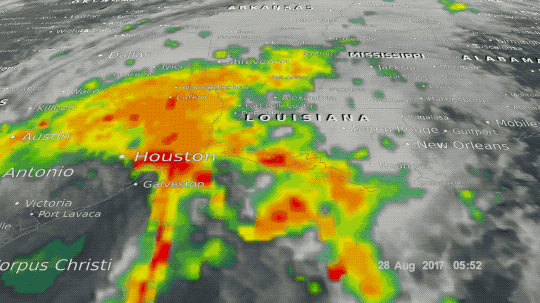
Flood maps showed the huge extent of flooding from Hurricane Harvey and were used for weeks after the storm to monitor changes and speed up recovery decisions and the deployment of aid and relief teams.
As the 2019 Atlantic hurricane season kicks off, the JPSS satellites, NOAA-20 and Suomi-NPP, are ready to track hurricanes and tropical cyclones as they form, intensify and travel across the ocean – our eyes in the sky for severe storms.
Earth is a dynamic and stormy planet with everything from brief, rumbling thunderstorms to enormous, raging hurricanes, which are some of the most powerful and destructive storms on our world. But other planets also have storm clouds, lightning — even rain, of sorts. Let’s take a tour of some of the unusual storms in our solar system and beyond.
Tune in May 22 at 3 p.m. for more solar system forecasting with NASA Chief Scientist Jim Green during the latest installment of NASA Science Live: https://www.nasa.gov/nasasciencelive.
1. At Mercury: A Chance of Morning Micrometeoroid Showers and Magnetic ‘Tornadoes’
Mercury, the planet nearest the Sun, is scorching hot, with daytime temperatures of more than 800 degrees Fahrenheit (about 450 degrees Celsius). It also has weak gravity — only about 38% of Earth’s — making it hard for Mercury to hold on to an atmosphere.
Its barely there atmosphere means Mercury doesn’t have dramatic storms, but it does have a strange “weather” pattern of sorts: it’s blasted with micrometeoroids, or tiny dust particles, usually in the morning. It also has magnetic “tornadoes” — twisted bundles of magnetic fields that connect the planet’s magnetic field to space.
2. At Venus: Earth’s ‘Almost’ Twin is a Hot Mess
Venus is often called Earth’s twin because the two planets are similar in size and structure. But Venus is the hottest planet in our solar system, roasting at more than 800 degrees Fahrenheit (430 degrees Celsius) under a suffocating blanket of sulfuric acid clouds and a crushing atmosphere. Add to that the fact that Venus has lightning, maybe even more than Earth.
In visible light, Venus appears bright yellowish-white because of its clouds. Earlier this year, Japanese researchers found a giant streak-like structure in the clouds based on observations by the Akatsuki spacecraft orbiting Venus.
3. At Earth: Multiple Storm Hazards Likely
Earth has lots of storms, including thunderstorms, blizzards and tornadoes. Tornadoes can pack winds over 300 miles per hour (480 kilometers per hour) and can cause intense localized damage.
But no storms match hurricanes in size and scale of devastation. Hurricanes, also called typhoons or cyclones, can last for days and have strong winds extending outward for 675 miles (1,100 kilometers). They can annihilate coastal areas and cause damage far inland.
4. At Mars: Hazy with a Chance of Dust Storms
Mars is infamous for intense dust storms, including some that grow to encircle the planet. In 2018, a global dust storm blanketed NASA’s record-setting Opportunity rover, ending the mission after 15 years on the surface.
Mars has a thin atmosphere of mostly carbon dioxide. To the human eye, the sky would appear hazy and reddish or butterscotch colored because of all the dust suspended in the air.
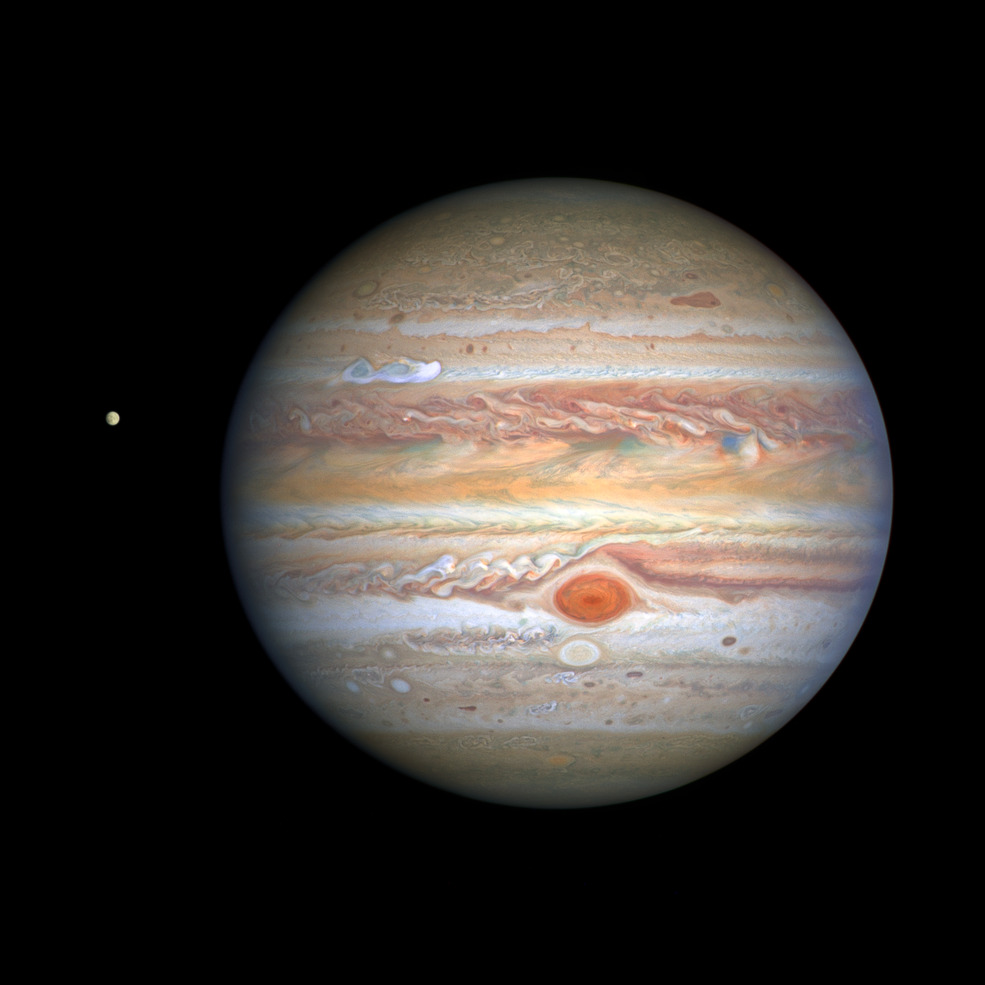
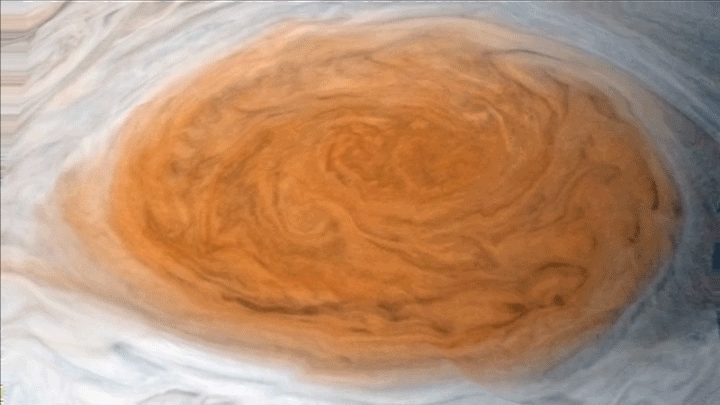
5. At Jupiter: A Shrinking Icon
It’s one of the best-known storms in the solar system: Jupiter’s Great Red Spot. It’s raged for at least 300 years and was once big enough to swallow Earth with room to spare. But it’s been shrinking for a century and a half. Nobody knows for sure, but it’s possible the Great Red Spot could eventually disappear.
6. At Saturn: A Storm Chasers Paradise
Saturn has one of the most extraordinary atmospheric features in the solar system: a hexagon-shaped cloud pattern at its north pole. The hexagon is a six-sided jet stream with 200-mile-per-hour winds (about 322 kilometers per hour). Each side is a bit wider than Earth and multiple Earths could fit inside. In the middle of the hexagon is what looks like a cosmic belly button, but it’s actually a huge vortex that looks like a hurricane.
Storm chasers would have a field day on Saturn. Part of the southern hemisphere was dubbed “Storm Alley” by scientists on NASA’s Cassini mission because of the frequent storm activity the spacecraft observed there.
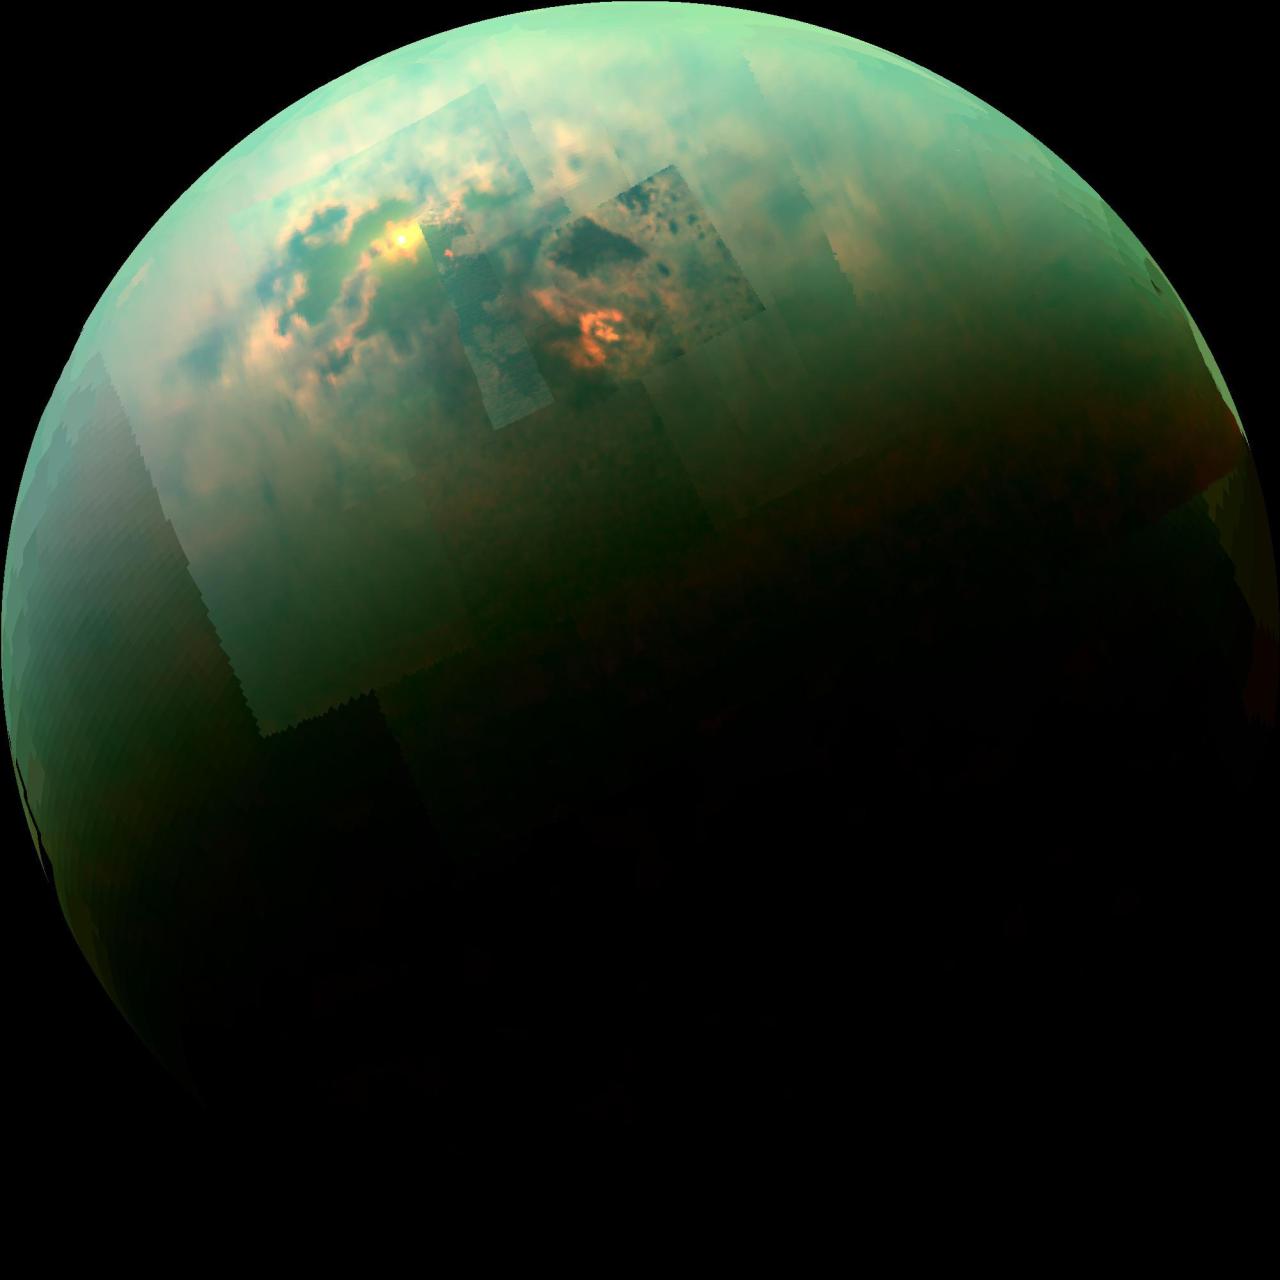
7. At Titan: Methane Rain and Dust Storms
Earth isn’t the only world in our solar system with bodies of liquid on its surface. Saturn’s moon Titan has rivers, lakes and large seas. It’s the only other world with a cycle of liquids like Earth’s water cycle, with rain falling from clouds, flowing across the surface, filling lakes and seas and evaporating back into the sky. But on Titan, the rain, rivers and seas are made of methane instead of water.
Data from the Cassini spacecraft also revealed what appear to be giant dust storms in Titan’s equatorial regions, making Titan the third solar system body, in addition to Earth and Mars, where dust storms have been observed.
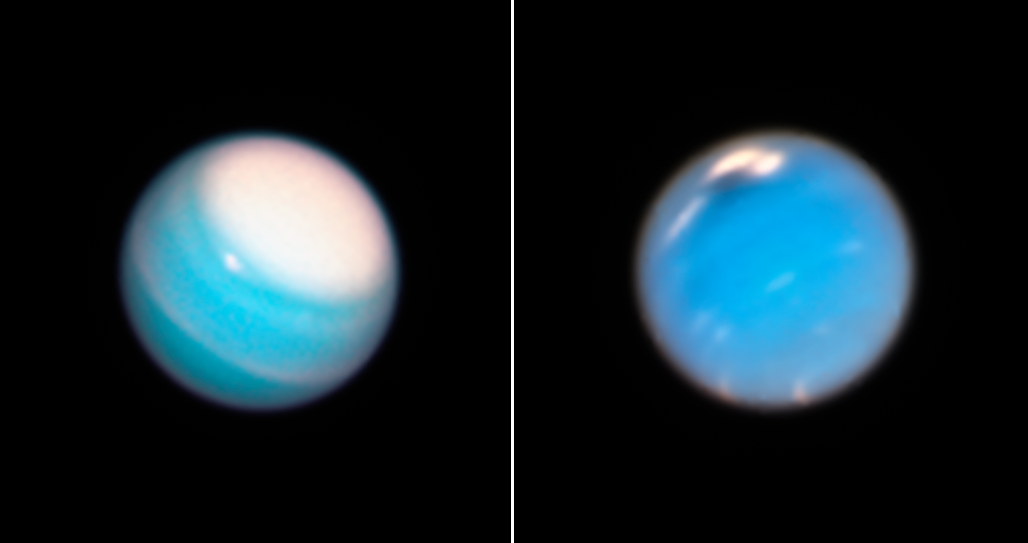
8. At Uranus: A Polar Storm
Scientists were trying to solve a puzzle about clouds on the ice giant planet: What were they made of? When Voyager 2 flew by in 1986, it spotted few clouds. (This was due in part to the thick haze that envelops the planet, as well as Voyager’s cameras not being designed to peer through the haze in infrared light.) But in 2018, NASA’s Hubble Space Telescope snapped an image showing a vast, bright, stormy cloud cap across the north pole of Uranus.
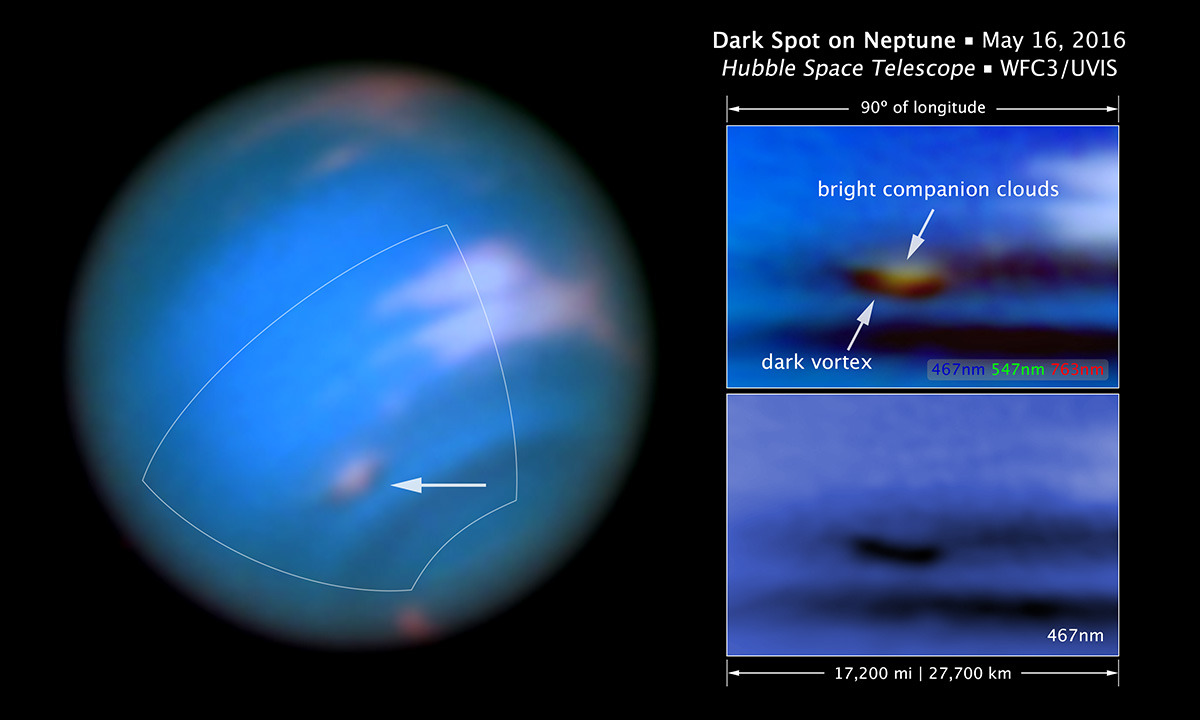
9. At Neptune: Methane Clouds
Neptune is our solar system’s windiest world. Winds whip clouds of frozen methane across the ice giant planet at speeds of more than 1,200 miles per hour (2,000 kilometers per hour) — about nine times faster than winds on Earth.
Neptune also has huge storm systems. In 1989, NASA’s Voyager 2 spotted two giant storms on Neptune as the spacecraft zipped by the planet. Scientists named the storms “The Great Dark Spot” and “Dark Spot 2.”
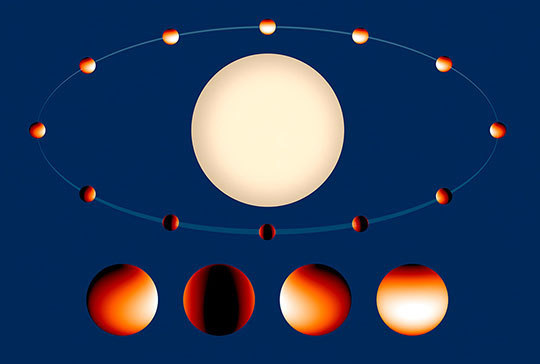
10. It’s Not Just Us: Extreme Weather in Another Solar System
Scientists using NASA’s Hubble Space Telescope made a global map of the glow from a turbulent planet outside our solar system. The observations show the exoplanet, called WASP-43b, is a world of extremes. It has winds that howl at the speed of sound, from a 3,000-degree-Fahrenheit (1,600-degree-Celsius) day side, to a pitch-black night side where temperatures plunge below 1,000 degrees Fahrenheit (500 degrees Celsius).
Discovered in 2011, WASP-43b is located 260 light-years away. The planet is too distant to be photographed, but astronomers detected it by observing dips in the light of its parent star as the planet passes in front of it.
Make sure to follow us on Tumblr for your regular dose of space: http://nasa.tumblr.com.
When you think of NASA, you probably think of space. Which makes sense, because space is a huge part of what we do. That being said, here at NASA we are also involved in many other research areas, and even play a role in hurricane weather forecasting.
Our satellites, computer modeling, instruments, aircraft and field missions all contribute to a mix of information used by scientists to get a better understanding of these storms. Aspects of storms from rainfall rates to surface wind speed are all analyzed to help identify the potential for storm formation or intensification.
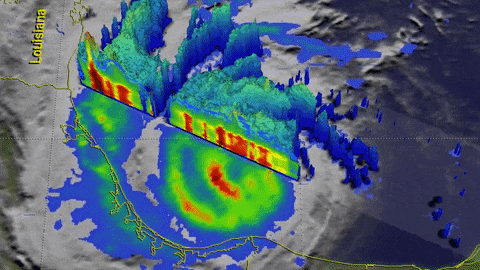
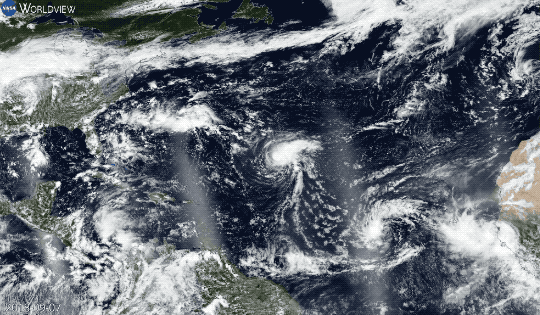
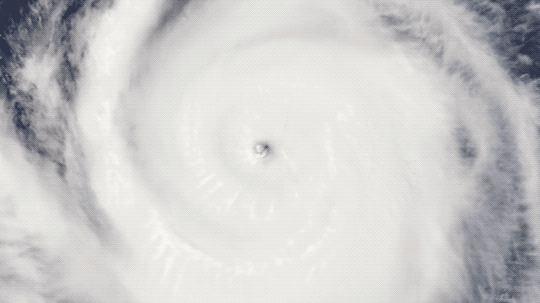
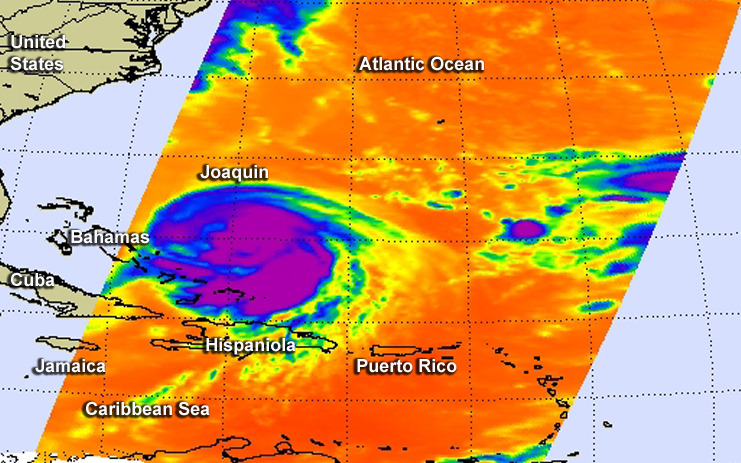
Currently, our satellites are passing overhead as Hurricane Joaquin (above) travels through the Atlantic Ocean. Our Global Precipitation Measurement, or GPM Core satellite captured images and rainfall rates of the storm. GPM showed a large area of very intense rain, which indicates that large amounts of heat are being released into the storm’s center. This fuels the circulation and provides the means for its intensification.
Maximum sustained winds have increased to near 80 mph and additional strengthening is expected. Joaquin could become a major hurricane during the next few days.
In 2016, we’re launching the Cyclone Global Navigation Satellite System (CYGNSS), which is a constellation of eight small satellites. With this launch, we will be able to better understand the rapid intensification of hurricanes, and improve hurricane intensity forecasts.
In addition to our satellite technology, we also conduct field missions to study hurricanes. In our most recent field mission, we investigated the process that underlie hurricane formation and intensity change in the Atlantic Ocean basin.
Follow, follow the Sun / And which way the wind blows / When this day is done 🎶 Today, April 8, 2024, the last total solar eclipse until 2045 crossed North America.