

Electrification
EVs vs. Gas Vehicles: What Are Cars Made Out Of?


EVs vs. Gas Vehicles: What Are Cars Made Out Of?
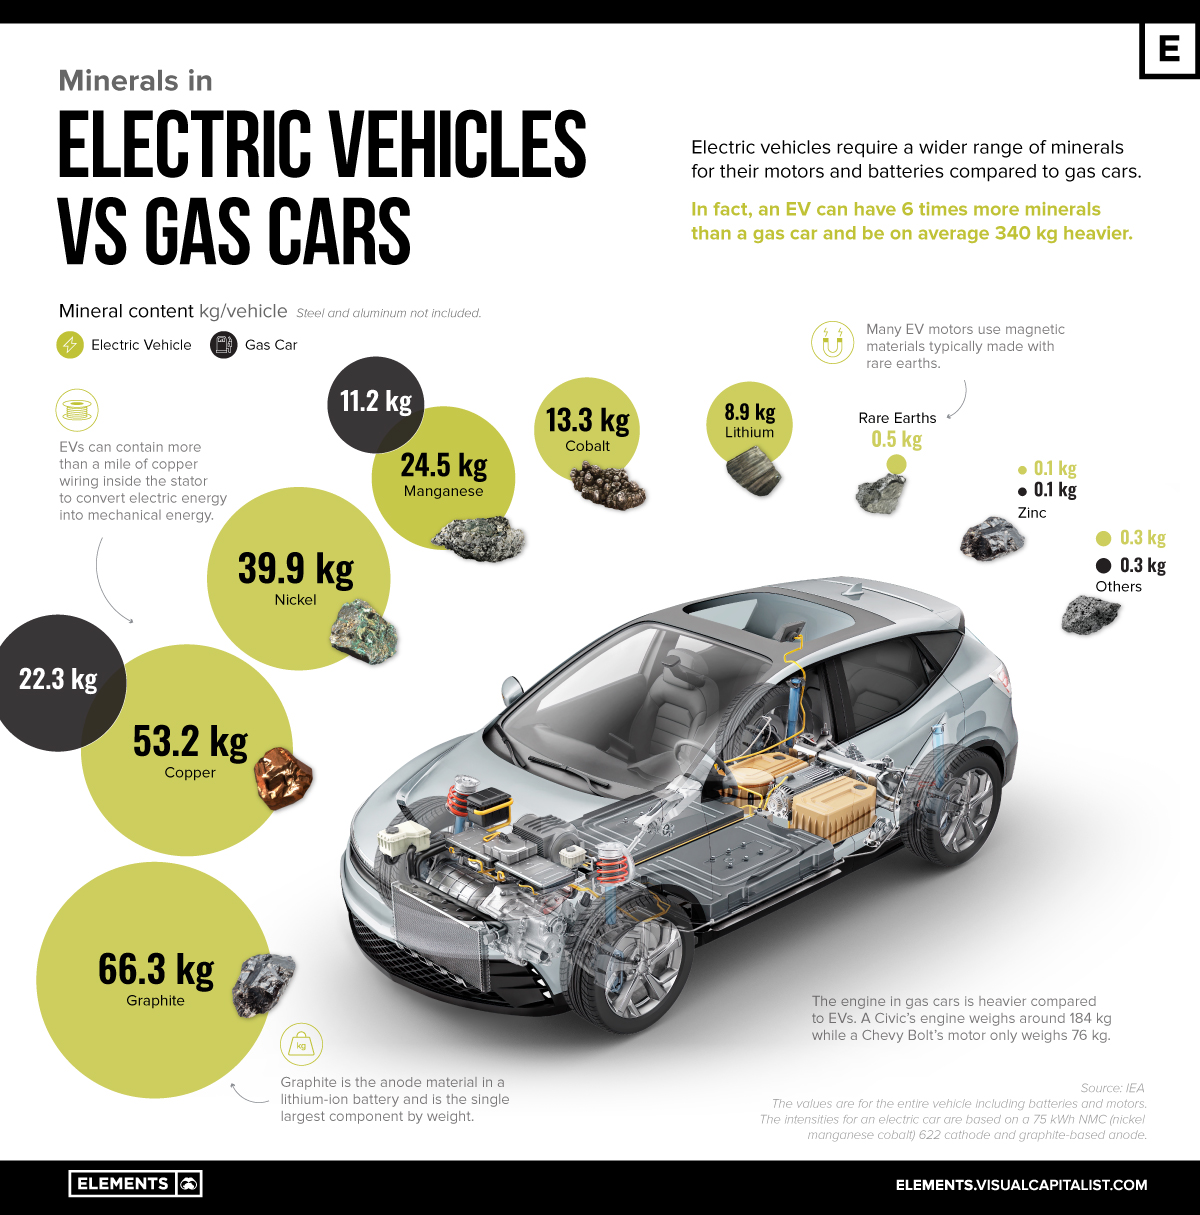
Electric vehicles (EVs) require a wider range of minerals for their motors and batteries compared to conventional cars.
In fact, an EV can have up to six times more minerals than a combustion vehicle, making them on average 340 kg (750 lbs) heavier.
This infographic, based on data from the International Energy Agency (IEA), compares the minerals used in a typical electric car with a conventional gas car.
Editor’s note: Steel and aluminum are not shown in analysis. Mineral values are for the entire vehicle including batteries and motors.
Batteries Are Heavy
Sales of electric cars are booming and the rising demand for minerals used in EVs is already posing a challenge for the mining industry to keep up. That’s because, unlike gas cars that run on internal combustion engines, EVs rely on huge, mineral-intensive batteries to power the car.
For example, the average 60 kilowatt-hour (kWh) battery pack—the same size that’s used in a Chevy Bolt—alone contains roughly 185 kilograms of minerals, or about 10 times as much as in a typical car battery (18 kg).
Lithium, nickel, cobalt, manganese, and graphite are all crucial to battery performance, longevity, and energy density. Furthermore, EVs can contain more than a mile of copper wiring inside the stator to convert electric energy into mechanical energy.
Out of the eight minerals in our list, five are not used in conventional cars: graphite, nickel, cobalt, lithium, and rare earths.
| Mineral | Content in electric vehicles (kg) | Content in conventional cars (kg) |
|---|---|---|
| Graphite (natural and synthetic) | 66.3 | 0 |
| Copper | 53.2 | 22.3 |
| Nickel | 39.9 | 0 |
| Manganese | 24.5 | 11.2 |
| Cobalt | 13.3 | 0 |
| Lithium | 8.9 | 0 |
| Rare earths | 0.5 | 0 |
| Zinc | 0.1 | 0.1 |
| Others | 0.3 | 0.3 |
Minerals listed for the electric car are based on the IEA’s analysis using a 75 kWh battery pack with a NMC 622 cathode and graphite-based anode.
Since graphite is the primary anode material for EV batteries, it’s also the largest component by weight. Although materials like nickel, manganese, cobalt, and lithium are smaller components individually, together they make up the cathode, which plays a critical role in determining EV performance.
Although the engine in conventional cars is heavier compared to EVs, it requires fewer minerals. Engine components are usually made up of iron alloys, such as structural steels, stainless steels, iron base sintered metals, as well as cast iron or aluminum alloyed parts.
EV motors, however, often rely on permanent magnets made of rare earths and can contain up to a mile of copper wiring that converts electric energy into mechanical energy.
The EV Impact on Metals Markets
The growth of the EV market is not only beginning to have a noticeable impact on the automobile industry but the metals market as well.
EVs and battery storage have already displaced consumer electronics to become the largest consumer of lithium and are set to take over from the stainless steel industry as the largest end-user of nickel by 2040.
In 2021 H2, 84,600 tonnes of nickel were deployed onto roads globally in the batteries of all newly sold passenger EVs combined, 59% more than in 2020 H2. Moreover, another 107,200 tonnes of lithium carbonate equivalent (LCE) were deployed globally in new EV batteries, an 88% increase year-on-year.
With rising government support and consumers embracing electric vehicles, securing the supply of the materials necessary for the EV revolution will remain a top priority.


Electrification
Ranked: The Top 10 EV Battery Manufacturers in 2023
Asia dominates this ranking of the world’s largest EV battery manufacturers in 2023.

The Top 10 EV Battery Manufacturers in 2023
This was originally posted on our Voronoi app. Download the app for free on iOS or Android and discover incredible data-driven charts from a variety of trusted sources.
Despite efforts from the U.S. and EU to secure local domestic supply, all major EV battery manufacturers remain based in Asia.
In this graphic we rank the top 10 EV battery manufacturers by total battery deployment (measured in megawatt-hours) in 2023. The data is from EV Volumes.
Chinese Dominance
Contemporary Amperex Technology Co. Limited (CATL) has swiftly risen in less than a decade to claim the title of the largest global battery group.
The Chinese company now has a 34% share of the market and supplies batteries to a range of made-in-China vehicles, including the Tesla Model Y, SAIC’s MG4/Mulan, and Li Auto models.
| Company | Country | 2023 Production (megawatt-hour) | Share of Total Production |
|---|---|---|---|
| CATL | 🇨🇳China | 242,700 | 34% |
| BYD | 🇨🇳China | 115,917 | 16% |
| LG Energy Solution | 🇰🇷Korea | 108,487 | 15% |
| Panasonic | 🇯🇵Japan | 56,560 | 8% |
| SK On | 🇰🇷Korea | 40,711 | 6% |
| Samsung SDI | 🇰🇷Korea | 35,703 | 5% |
| CALB | 🇨🇳China | 23,493 | 3% |
| Farasis Energy | 🇨🇳China | 16,527 | 2% |
| Envision AESC | 🇨🇳China | 8,342 | 1% |
| Sunwoda | 🇨🇳China | 6,979 | 1% |
| Other | - | 56,040 | 8% |
In 2023, BYD surpassed LG Energy Solution to claim second place. This was driven by demand from its own models and growth in third-party deals, including providing batteries for the made-in-Germany Tesla Model Y, Toyota bZ3, Changan UNI-V, Venucia V-Online, as well as several Haval and FAW models.
The top three battery makers (CATL, BYD, LG) collectively account for two-thirds (66%) of total battery deployment.
Once a leader in the EV battery business, Panasonic now holds the fourth position with an 8% market share, down from 9% last year. With its main client, Tesla, now effectively sourcing batteries from multiple suppliers, the Japanese battery maker seems to be losing its competitive edge in the industry.
Overall, the global EV battery market size is projected to grow from $49 billion in 2022 to $98 billion by 2029, according to Fortune Business Insights.
Electrification
White Gold: Mapping U.S. Lithium Mines
In this graphic, Visual Capitalist partnerered with EnergyX to explore the size and location of U.S. lithium mines.

White Gold: Mapping U.S. Lithium Mines
The U.S. doubled imports of lithium-ion batteries for the third consecutive year in 2022, and with EV demand growing yearly, U.S. lithium mines must ramp up production or rely on other nations for their supply of refined lithium.
To determine if the domestic U.S. lithium opportunity can meet demand, we partnered with EnergyX to determine how much lithium sits within U.S. borders.
U.S. Lithium Projects
The most crucial measure of a lithium mine’s potential is the quantity that can be extracted from the source.
For each lithium resource, the potential volume of lithium carbonate equivalent (LCE) was calculated with a ratio of one metric ton of lithium producing 5.32 metric tons of LCE. Cumulatively, existing U.S. lithium projects contain 94.8 million metric tons of LCE.
| Rank | Project Name | LCE, million metric tons (est.) |
|---|---|---|
| 1 | McDermitt Caldera | 21.5 |
| 2 | Thacker Pass | 19.1 |
| 3 | Tonopah Flats | 18.0 |
| 4 | TLC Lithium | 10.7 |
| 5 | Clayton Valley (Century Lithium) | 6.3 |
| 6 | Zeus Lithium | 6.3 |
| 7 | Rhyolite Ridge | 3.4 |
| 8 | Arkansas Smackover (Phase 1A) | 2.8 |
| 9 | Basin Project | 2.2 |
| 10 | McGee Deposit | 2.1 |
| 11 | Arkansas Smackover (South West) | 1.8 |
| 12 | Clayton Valley (Lithium-X, Pure Energy) | 0.8 |
| 13 | Big Sandy | 0.3 |
| 14 | Imperial Valley/Salton Sea | 0.3 |
U.S. Lithium Opportunities, By State
U.S. lithium projects mainly exist in western states, with comparatively minor opportunities in central or eastern states.
| State | LCE, million metric tons (est.) |
|---|---|
| Nevada | 88.2 |
| Arkansas | 4.6 |
| Arizona | 2.5 |
| California | 0.3 |
Currently, the U.S. is sitting on a wealth of lithium that it is underutilizing. For context, in 2022, the U.S. only produced about 5,000 metric tons of LCE and imported a projected 19,000 metric tons of LCE, showing that the demand for the mineral is healthy.
The Next Gold Rush?
U.S. lithium companies have the opportunity to become global leaders in lithium production and accelerate the transition to sustainable energy sources. This is particularly important as the demand for lithium is increasing every year.
EnergyX is on a mission to meet U.S. lithium demands using groundbreaking technology that can extract 300% more lithium from a source than traditional methods.
You can take advantage of this opportunity by investing in EnergyX and joining other significant players like GM in becoming a shareholder.


-

 Electrification3 years ago
Ranked: The Top 10 EV Battery Manufacturers
-

 Electrification2 years ago
The Key Minerals in an EV Battery
-

 Real Assets3 years ago
The World’s Top 10 Gold Mining Companies
-

 Misc3 years ago
All the Metals We Mined in One Visualization
-

 Electrification3 years ago
The Biggest Mining Companies in the World in 2021
-

 Energy Shift2 years ago
What Are the Five Major Types of Renewable Energy?
-

 Electrification2 years ago
Mapped: Solar Power by Country in 2021
-

 Electrification2 years ago
The World’s Largest Nickel Mining Companies