A Partially Non-Compensatory Method to Measure the Smart and Sustainable Level of Italian Municipalities


1
Department of Economics—DIEC, University of Genoa, 16126 Genoa, Italy
2
Centro de Investigaciones en Econometría—CIE, University of Buenos Aires, Buenos Aires C1113 CABA, Argentina
3
Department of Political Science—DISPO, University of Genoa, 16125 Genoa, Italy
4
C.I.E.L.I., the Italian Center of Excellence on Logistics Transports and Infrastructures, University of Genoa, 16126 Genoa, Italy
5
Department of Physical Geography and Regional Geographical Analysis, University of Seville, 41004 Sevilla, Spain
*
Author to whom correspondence should be addressed.
Sustainability 2021, 13(1), 435; https://doi.org/10.3390/su13010435
Submission received: 11 November 2020
/
Revised: 25 December 2020
/
Accepted: 30 December 2020
/
Published: 5 January 2021
(This article belongs to the Special Issue Sustainable Development of Entrepreneurship and the Cities: A Knowledge-Based Perspective)
Abstract
:A smart sustainable city (SSC) is a paradigm that encapsulates the latest lines of development in multiple fields of research. The attempt to converge towards a model of sustainable urban life, made difficult by increasing anthropic pressure and polluting activities conducted by man, is also reflected in the intentions of public institutions to take measures of environmental risk mitigation. The change towards more liveable cities must also include the adoption of more far-reaching measures in various sectors. The objective of our work was to provide an analysis in order to assess which of the Italian provincial municipalities were most closely related to the paradigm of SSCs. This aim was pursued through a comparison based on the results of a partially non-compensatory quantitative method, known as the Pena’s Distance method (DP2). The smartest and most sustainable cities, such as Siena, Milan and Padua, were not identified on the basis of common urban characteristics but rather derived from the combination of distinctive and functional elements in the pursuit of a strategic approach aimed at fully exploiting the resources of each area. Moreover, at a macro-geographical level, from the analysis emerged the presence of contiguous clusters, i.e., areas in which a major concentration of smart sustainable municipalities tended to form.
1. Introduction
Over the last years, a constant population growth has characterised European cities and has made it necessary to reanalyse the configuration of the urban fabric [1]. At the same time, the demands of sustainability and objectives set at international and national levels require that action be taken in order to reconvert urban systems in an innovative and more sustainable way [2]. In other words, in order to meet the needs of residents in complex and densely populated areas, urban systems must be rethought to facilitate daily life, and the satisfaction of essential needs for the new society, together with the protection of the environmental heritage, must be made possible [3].
Given the magnitude of the phenomenon, it is necessary to implement procedures to monitor the state of the development of the cities, on the basis of a far-reaching programmatic vision of the future. This urban strategy must be wide-ranging, so as to encompass the many urban components, spaces and actors that are part of it [4]. Specifically, reference could be made to a techno-human vision, an expression that aims to indicate the use of new technologies, such as applications based on big data, to meet the needs of the community. A system of hardware and software represents the set of digital and physical infrastructures for the evaluation, on an analytical basis, of the transformations to be implemented [5]. In order to better monitor the changes that characterise smart cities, it is essential to develop the most accurate data collection systems. The technology is an indispensable element to allow this to happen [6]. Regular monitoring is not only an essential activity to prevent possible risks but also to make the most of the enormous capacity of resources and manpower that cities possess [7]. Current guidelines in data production are moving in the direction of time-sequenced data production. The analysis of time series is of primary importance if an effective continuous monitoring is to be carried out [8].
Starting from this theoretical premises, in this article we wanted to provide an example of multidimensional monitoring of the vital parameters of a smart city. In other words, the aim of our work was to provide an analysis on the state of progress towards the paradigm of smart sustainable cities within the Italian context. To do this, we employed a quantitative partially non-compensatory method, known as Pena’s Distance method (DP2). Using DP2, we constructed an index (Smart Sustainable City Index, SSCI) that provided us with a measure of the overall smart and sustainable level of each unit of analysis. The municipality represents, in this case, the privileged unit of analysis, as it has on average optimal dimensions to support a national comparative analysis close to the territory. In this way, we avoided the loss of information or partial compensation that could derive, for example, from considering a territorial aggregate as a primary level of detection. Our objective was to take into account the peculiarities that characterise the different local areas.
We believe that this paper could be important, at a broader level, to expand the set of methodological opportunities for comparative performance analysis with reference to different geographical areas. The approach proposed here is suitable for analysing both national and subnational geographic areas. In addition, we think that the approach used in this paper can contribute to greater attention being paid to the monitoring of urban realities that have levels of complexity and pressure which have been rising for several years at a steady pace. Europe can be considered as a particularly delicate field of analysis. European cities are destined to face in the coming years increasingly difficult challenges in promoting the achievement of greater urban liveability and sustainability. Under this light, we think that the understanding of the transformational phenomena underway passes through the integrated management of complex systems.
The paper is structured as follows: the Literature Review (Section 2) provides notions about SSCs and the definitions of the main dimensions to which they refer; in the Materials and Methods (Section 3), we summarise the process of selecting indicators and information about the statistical methods employed in this paper; Results (Section 4) highlights the main results obtained, while in the Discussion (Section 4) we offer some keys to interpret the results and the strengths and the weaknesses of this paper.
2. Literature Review
The theme of smart sustainable cities has gained increasing importance over the years in urban literature. The features of smart sustainable cities are designed to address and overcome challenges that threaten urban sustainability. This pertains particularly to ecologically and technologically advanced nations [9].
The need to achieve change in cities is stressed by the world’s incessant population growth. United Nations estimations forecast that by 2050 66% of the world’s population will live in cities [10,11]. This growth would generate additional significant challenges pertaining to environmental and social sustainability [12]. An interesting and widespread discussion then emerges about the future of urban areas [13]. In this context, smart cities will be able to face new challenges from their innovation competence to achieve a balance between the aspects of economic competitiveness, social development and environmental and cultural sustainability [14]. They will be the result of applying a holistic approach in cities that make use of the rapid diffusion and use of information communication technologies (ICTs) to improve the quality of life, the accessibility of their inhabitants and ensure sustainable economic, social and environmental development. Therefore, contemporary debates in urban and academic circles continue to focus on the role of sustainability in urban planning and development in terms of responding to the substantial challenges arising from the rapidly evolving urbanisation as well as the unsustainability of existing urban forms [15].
The term smart sustainable city, when broken down and analysed in its constituent components, highlights the integrability of two concepts that are, at least, apparently (or potentially) antithetical. The reference is to the definitions of smart city and sustainable city.
A sustainable city has its conceptual roots in the idea of sustainability. Introduced by the Bruntland Report in 1987 [16], the term sustainability has been declined in various ways; a revised definition of sustainability is provided by Bibri [17]. This definition specifies the framework on which sustainability is grafted and integrates it with the complex core of needs required by society. Specifically, Bibri [17] (p. 53) defines sustainable development as:
“The planned and strategic development processes of working towards a balance of economic, environmental, and social values and goals, i.e., a balance of the need for economic development and prosperity with environmental protection and integrity and social equity and justice. The premise is to conciliate the continuity of these—conflicting, competing, and sometimes contradictory—forces.”
Starting from here, the notion of a sustainable city can be inferred. In Reference [18] a “sustainable city” is defined as an entity for which the inflow of material and energy resources and the disposal of wastes do not exceed the capacity of the city’s surrounding environment. Practically, in order to achieve this goal, the consumption of urban resources in a city should match—or not exceed—the quantity provided by the natural environment (e.g., soil, water or energy resources). The most fervent debate on the concept of sustainable city is focused on how to achieve the right synthesis between the need to meet the demands of society—increasingly digitalized—and the pursuit of environmental protection in urban areas [19].
The solution can be searched for by looking at the rich strand of literature on “smart city”. The concept of smart city is not identifiable with a single semantic solution. Depending on the context or perspective assumed, the expression “smart city” can assume different meanings. Looking at the different meanings that are associated to smart city in the literature; it is possible to identify the main traits characterising a smart city. According to Dameri et al. [20], a smart city can be defined as:
“A well-defined geographical area, in which high technologies, such as Information Communication Technologies (ICT), logistic, energy production, and so on, cooperate to create benefits for citizens in terms of well-being, inclusion and participation, environmental quality, intelligent development; it is governed by a well-defined pool of subjects, able to state the rules and policy for the city government and development.”
Toppeta [21] emphasises the importance that ICT and Web 2.0 technology, together with organisational and management efforts to promote dematerialisation and streamlining of administrative processes, have in determining the degree of development of an intelligent city, in addition to the ability to identify new, innovative solutions to city management complexity in order to improve sustainability and liveability. Yigitcanlar [21] focuses the attention on the futuristic character that affects, by definition, a smart city and that involves its multiple articulations; he defines the smart city as “an ideal form to build the sustainable cities of the 21st century, in the case that a balanced and sustainable view on economic, societal, environmental and institutional development is realised”.
Among the interconnected spheres that define a smart city in its broadest meaning, the technological dimension takes on particular importance. For example, new technologies can be adopted in a smart city system in order to increase the sustainability level and to better manage natural resources [22,23]. In more detail, technology is directed to the hardware and software available to cities, stable connectivity, interoperability, technology networks, availability of dashboards, common operational platform, integrated web services, smart control systems as automatic control network, local operating network and smart database resources, for example, databases and database servers [24,25,26]. From a wider perspective, the technology has implications on the functioning of other different dimensions such as mobility, economy, education, participation and welfare [27,28,29,30,31,32,33,34,35].
Environmental factors have a great impact on the liveability of a city, so these should be taken into consideration when examining smart city initiatives [36,37]. An approach oriented to the optimal management of natural urban resource is influenced by the measure adopted in different fields such as energy, waste, water and landscape [38]. An important strategy to facilitate the management of natural resources should consist of the adoption of participatory policies; in this way, it would be possible to act on the awareness of citizens about the correct conservation of naturalistic heritage and non-renewable resources [39]. According to the smart city framework, the natural environment is a strategic component to promote the future success of a smart city [40].¶The cultural dimension is of primary importance to sponsor the city, increasing its economic and entrepreneurial potential, promoting the growth of knowledge, the degree of innovation and facilitating relations in intercultural exchanges [41,42,43,44]. The culture contributes to strengthen the identity of the city as a capital city for well-known aspects (e.g., good food, culture and music), and make the city more attractive for its citizens, tourists and businesses [45]. Cities with an important cultural heritage are tourist driven cities [46,47,48]. At the same time, the cultural endowment of a city can be the axis on which to develop actions of progressive development. For example, the large amount of information that can be produced by tourists moving inside the city, in combination with the importance of cultural activities and heritage, enhances the potential for the implementation of location-based and knowledge-based innovation.
Mobility is one of the pillars in the design of smart city services. The implementation of intelligent transportation systems (ITSs) not only is important to better manage traffic-related aspects (such as smart parking, car sharing [49,50], speed control systems), but it is functional for a near-to-zero emissions approach [51]. Smart mobility is largely permeated by ICT, used in both backward and forward applications, to support the optimisation of traffic fluxes but also to collect citizens’ opinions about liveability in cities or quality of local public transportation services [51]. Mobility is a manifest dimension of smart cities, as the implementation of a valid mobility system depends on the right integration among the different paradigms typical of smart cities: digital city, green city, knowledge city [52,53].
To summarize the above, it could be said that the term smart city refers to an urban complex with strategic, structural and cultural characteristics that guarantee a projection towards a future of greater simplicity, well-being and knowledge for all those who live there.
Overall, a smart sustainable city should be conceived as a combination of the smart city’s and sustainable city’s features. In general, the smart sustainable city is a new techno–urban phenomenon. More specifically, the “smart sustainable” expression is used to identify a city that is supported by a pervasive presence and massive use of advanced ICT, connected to different urban domains and systems that are intricately interrelate each other. The set of interdependent dimensions enables cities to become more sustainable and to provide citizens with a better quality of life.
The relationship of interdependence between the dimensions of a smart sustainable city is to be conceived in a double perspective: on the one hand, the synergistic aspect emerges [3,6], a sort of multiplier of utility that derives from the functional interaction of different dimensions; on the other hand, the risks that derive from the interdependence of different elements [54,55] such as a cascade disintegration of the system on which a city stands [56,57]. For example, a cyberattack on an electrical power infrastructure could cascade into an urban operating system that then cascades into the other systems such as business activities, traffic management, emergency services and water services. In other words, smart cities pose many risks to environmental sustainability due to the ubiquity and the massive use of infrastructures across urban domains and systems [33,34,58,59].
The multidimensionality of smart cities contributes to their difficulties in governance. The risk of things getting out of hand is real in highly complex contexts. From a broader perspective, the main reasons for risk can be traced to the social and technological exclusion that, according to some authors, exclusively multinational business-led development can generate [60,61]. The rampant privatisation can counteract with the pursuit of goals to promote cities welfare equitably and to combat the main problems of urbanisation [62]. Over time, various scholars have raised debates that over-technologizing cities can widen social divisions rather than quell them [58]. For example, the attraction of educated, mobile, middle class professionals and IT workers can generate exclusionary processes at the expense of traditional communities and poorer residents [63,64].
Many authors [6,19,65,66,67,68] suggest that it is essential to implement a valid monitoring system in order to be able to identify in advance the flaws in the complex urban system. Risk mitigation depends on the internal capacity of the system to identify the risk promptly and implement proactive measures. More in general, as far as the programmatic side of a smart and sustainable city is concerned, public administration and political decision makers can make use of monitoring systems and appropriate indicators to supervise whether cities’ sustainable development strategies produce optimal results [69,70]. Monitoring allows us to explore the opportunities that lurk in cities and extrapolate their unexpressed potential.
3. Materials and Methods
3.1. Data
The analysis takes into consideration 112 Italian provincial capital cities municipalities. The basic statistical unit of the analysis has a local character. Through this comparison, we wanted to analyse which municipalities had the most distinctly smart and sustainable characteristics. From the analysis, it was also possible to understand which areas were in the transition process to cities of the future and becoming more advanced.
The data were extrapolated from the “National Institute of Statistics” (ISTAT) database “a misura di Comune”. This database is a multi-source statistical information system in which sources of an experimental nature are exploited alongside other more consolidated sources and is the result of the “Welfare and Planning Measures at the Municipal Level” project launched in 2016. “a misura di Comune” aims to provide an articulated set of harmonized indicators, of high territorial detail, useful for the planning, programming and management tasks by local authorities.
The choice of indicators was made on the basis of two-fold criteria: first, the dimensions were identified, as well as the characteristic elements of the SSCs, on the basis of the literature review; then, the datasets, corresponding to each of the identified dimensions, were extracted from the database “a misura di Comune”. Data were divided into six dimensions as shown in Table 1. In total, our Smart Sustainable City Index (SSCI) was composed of 18 indicators. The technological dimensions were measured by fewer than two indicators, since they were the only ones available for that dimension. However, we believe that they are suitable to represent the nature of the phenomenon under consideration from an aggregate point of view, as they focus on two trends of which the diffusion of is basic before any other subsequent development. We believe that ultra-broadband and employees in the high-tech sector are effective proxies for a more general systematic trend.
The year of detection was the last available for each indicator. Data collected prior to 2015 were not included in the analysis. Therefore, the indicators presented in Table 1 all correspond to the year 2015 or were more recent. The choice of indicators took into account a logic aimed at reconciling on the one hand the appropriateness of the chosen indicators (i.e., their adaptability to represent the different dimensions) and on the other hand the availability of indicators among the range offered by the ISTAT database. Therefore, even all indicators whose data were missing in large numbers did not conform to our selection criteria. Finally, we skimmed the indicators that followed very similar meanings and, therefore, showed a strong correlation, choosing only one.
However, the final dataset presents some weakness. First of all, the choice of indicators was not the result of the application of an empirical method of selection. The distribution of indicators on the different dimensions and the choice of indicators to be included in the analysis derived from an evaluation by the authors on the basis of existing literature. This procedure, which has its roots in the need to compensate for practical difficulties in the retrieval of data, can find a critical audience in those who would have applied an empirical method of choosing the indicators. Furthermore, the second reason for weakness is directly associated with the lack of a large number of indicators at a high level of territorial pervasiveness (municipality level). This dynamic permeates several areas of research and should be considered as a widespread problem at a broader level. The choice of indicators is therefore influenced by considerations of opportunity. In this regard, we highlight the need to encourage the collection of more data, which can provide a broader and more varied framework of choices and evaluations for practitioners, researchers and decision makers. Promoting a regularly updated comprehensive dashboard is the main challenge that needs to be met to increase the quality of research and decision making at a practical and theoretical level.
Table 1 provides a description of the selected indicators.
To better define the theoretical conceptual framework under which we conceived the SSCI, we present below the criteria by which we assigned polarity to each indicator for two of the most controversial and debated dimensions, i.e., mobility and technology.
The mobility dimension, as a consequence of the conceptual framework adopted in the paper, was conceived as the joint attempt to increase urban mobility in an agile, dynamic and multifaceted way, ensuring at the same time the respect of the environment and the decrease in air pollution levels. If the promotion of pedestrian areas and bicycle paths are fully contextualizable to a “smart” and “sustainable” paradigm, local public transport ensures movements over large portions of the territory in shorter time, preventing phenomena that are one of the main causes of urban air pollution, first of all the overuse of cars. In addition, several forms of public transport can imply the use of non-polluting energies [71]. Micro-mobility and greater use of public transport, to the detriment of more polluting means of transport, represent two of the lines of development aimed at better integrating the pursuit of dynamic and sustainable objectives in the field of urban mobility [72].
For how it concerns the technology dimension, the conception is open to more debate. It is true that the construction of technological infrastructures tends to produce a decrease in environmental health. In addition, according to some scholars, technology can be a source of uncertainty and a multiplier of inequalities. However, it is also well known that the development of more advanced urban technology models is instrumental in promoting sustainable energy, a powerful detractor of pollution. In addition, progress in capture and storage technologies is one of the most effective means directly aimed at combating global warming and achieving environmental sustainability [73].
New technologies are already supporting innovations, in the field of robotics, internet of things, cloud computing, additive manufacturing, just to name a few useful fields of application. The integration between welfare goals and technological knowledge helps to produce desired results in the field of e-business, smart industry, as well as in automation, forecasting and assessment [74]. It is true that the effectiveness of technological progress in promoting models of life more oriented to well-being and environmental sustainability depends on the ability to manage technological progress, according to a clear vision of the future. Then, it seems necessary to think of technology not as a problem or a threat in itself but as a tool that must be wisely managed and directed towards the most appropriate ways of use.
Under our study case perspective, the two indicators used to measure technology are not in opposition to each other and are both functional to the strengthening of a dimension of crucial importance to achieve a progressive improvement of urban liveability. For these reasons, we assigned them a positive polarity. Table 1 shows that all indicators had a positive polarities, except for two indicators, i.e., soil consumption and urban air quality—PM10, which had negative polarities. In order to make their direction consistent with that of all other indicators, a method of linear transformation was applied. It consisted of subtracting from the maximum value the value of each unit [75], in the following way:
The advantage of this method of linear transformation is that it does not alter the distances between values.
3.2. Methodology
This analysis was based on a formative model, according to which the set of indicators taken into consideration produces effects on the phenomenon to be studied, determining its changes in value [76]. In this perspective, it is supposed that the indicators are not interchangeable, because omitting an indicator is omitting part of the construct; eventual correlations between indicators are not explained by the measurement model; two uncorrelated indicators can both serve as meaningful indicators of the same construct [77,78].
Starting from this theoretical basis, we performed a quantitative analysis based on the use of a partially non-compensatory approach. Although non-aggregative methods are a valid alternative to the analysis of complex phenomena [79,80,81,82], our choice has fallen on an aggregative method for its conceptual solidity and recognisability in the literature, as well as its adaptability to the synthetic analysis of multidimensional phenomena [75,83].
The aggregation method chosen to build the SSCI index was the DP2 [84,85]. It is a good tool to construct indexes with the objective to assess interspatial comparisons. The advantages related to the use of the DP2 method mainly refer to the ways of aggregation and weighting. Its robustness is evidenced by the large number of contributions developed through this method (see References [86,87,88,89,90]).
Starting from a matrix, in which i = 1,..,n, where n is the number of analysis units and j = 1,.., m where m is the number of variables, we proceeded to the standardisation, applying the formula:
Then, for each indicators’ value, the distance from the minimum value was calculated:
In this way, we obtained a new matrix that represents the distance of each statistical unit from the reference value.
It is valid for each statistical unit:
which additively summarises all the indicators for each statistical unit. This value is compared individually with each indicator through the quantification of the Pearson’s coefficient.
The degree of correlation of the Pearson index between each indicator and the Frechet Distance (DF) value identifies the descending order in which the weight is determined [86], Successively, it will be attributed to each variable at the time of aggregation of the DP2, with determined as the coefficient of determination in the regression of on , given for the variable with greater , .
On the basis of this modality of index construction, in our paper higher scores correspond to better results.
The next step at methodological level consisted of performing a cluster analysis on the results of the index. This step was advanced with the intent to obtain a breakdown of the municipalities according to a scale of 5 different classes of development, identifying the cut-off between the municipalities and their mutual gaps. In addition, we used the obtained clusters to represent by a map the different municipalities’ class position. A cluster analysis was developed by applying a k-means variant [91,92,93], fixing a determined number of centroids that must not change during the entire clustering process. In order to make the graphical representation more effective, we opted for the selection of 5 centroids. In this way, the scale contained the central class (3) over a rather wide range (1–5). Class 5 collected the municipalities with the best scores, while the score decreased with the transition to the previous class.
4. Results
The results paragraph was developed according to the following sequence:
- First, the correlation matrix was proposed in order to evaluate the interrelations existing between the different dimensions;
- Subsequently, the results for each dimension and SSCI are presented;
- Finally, through a map, we defined the distribution of the municipalities in clusters on macro-geographical basis.
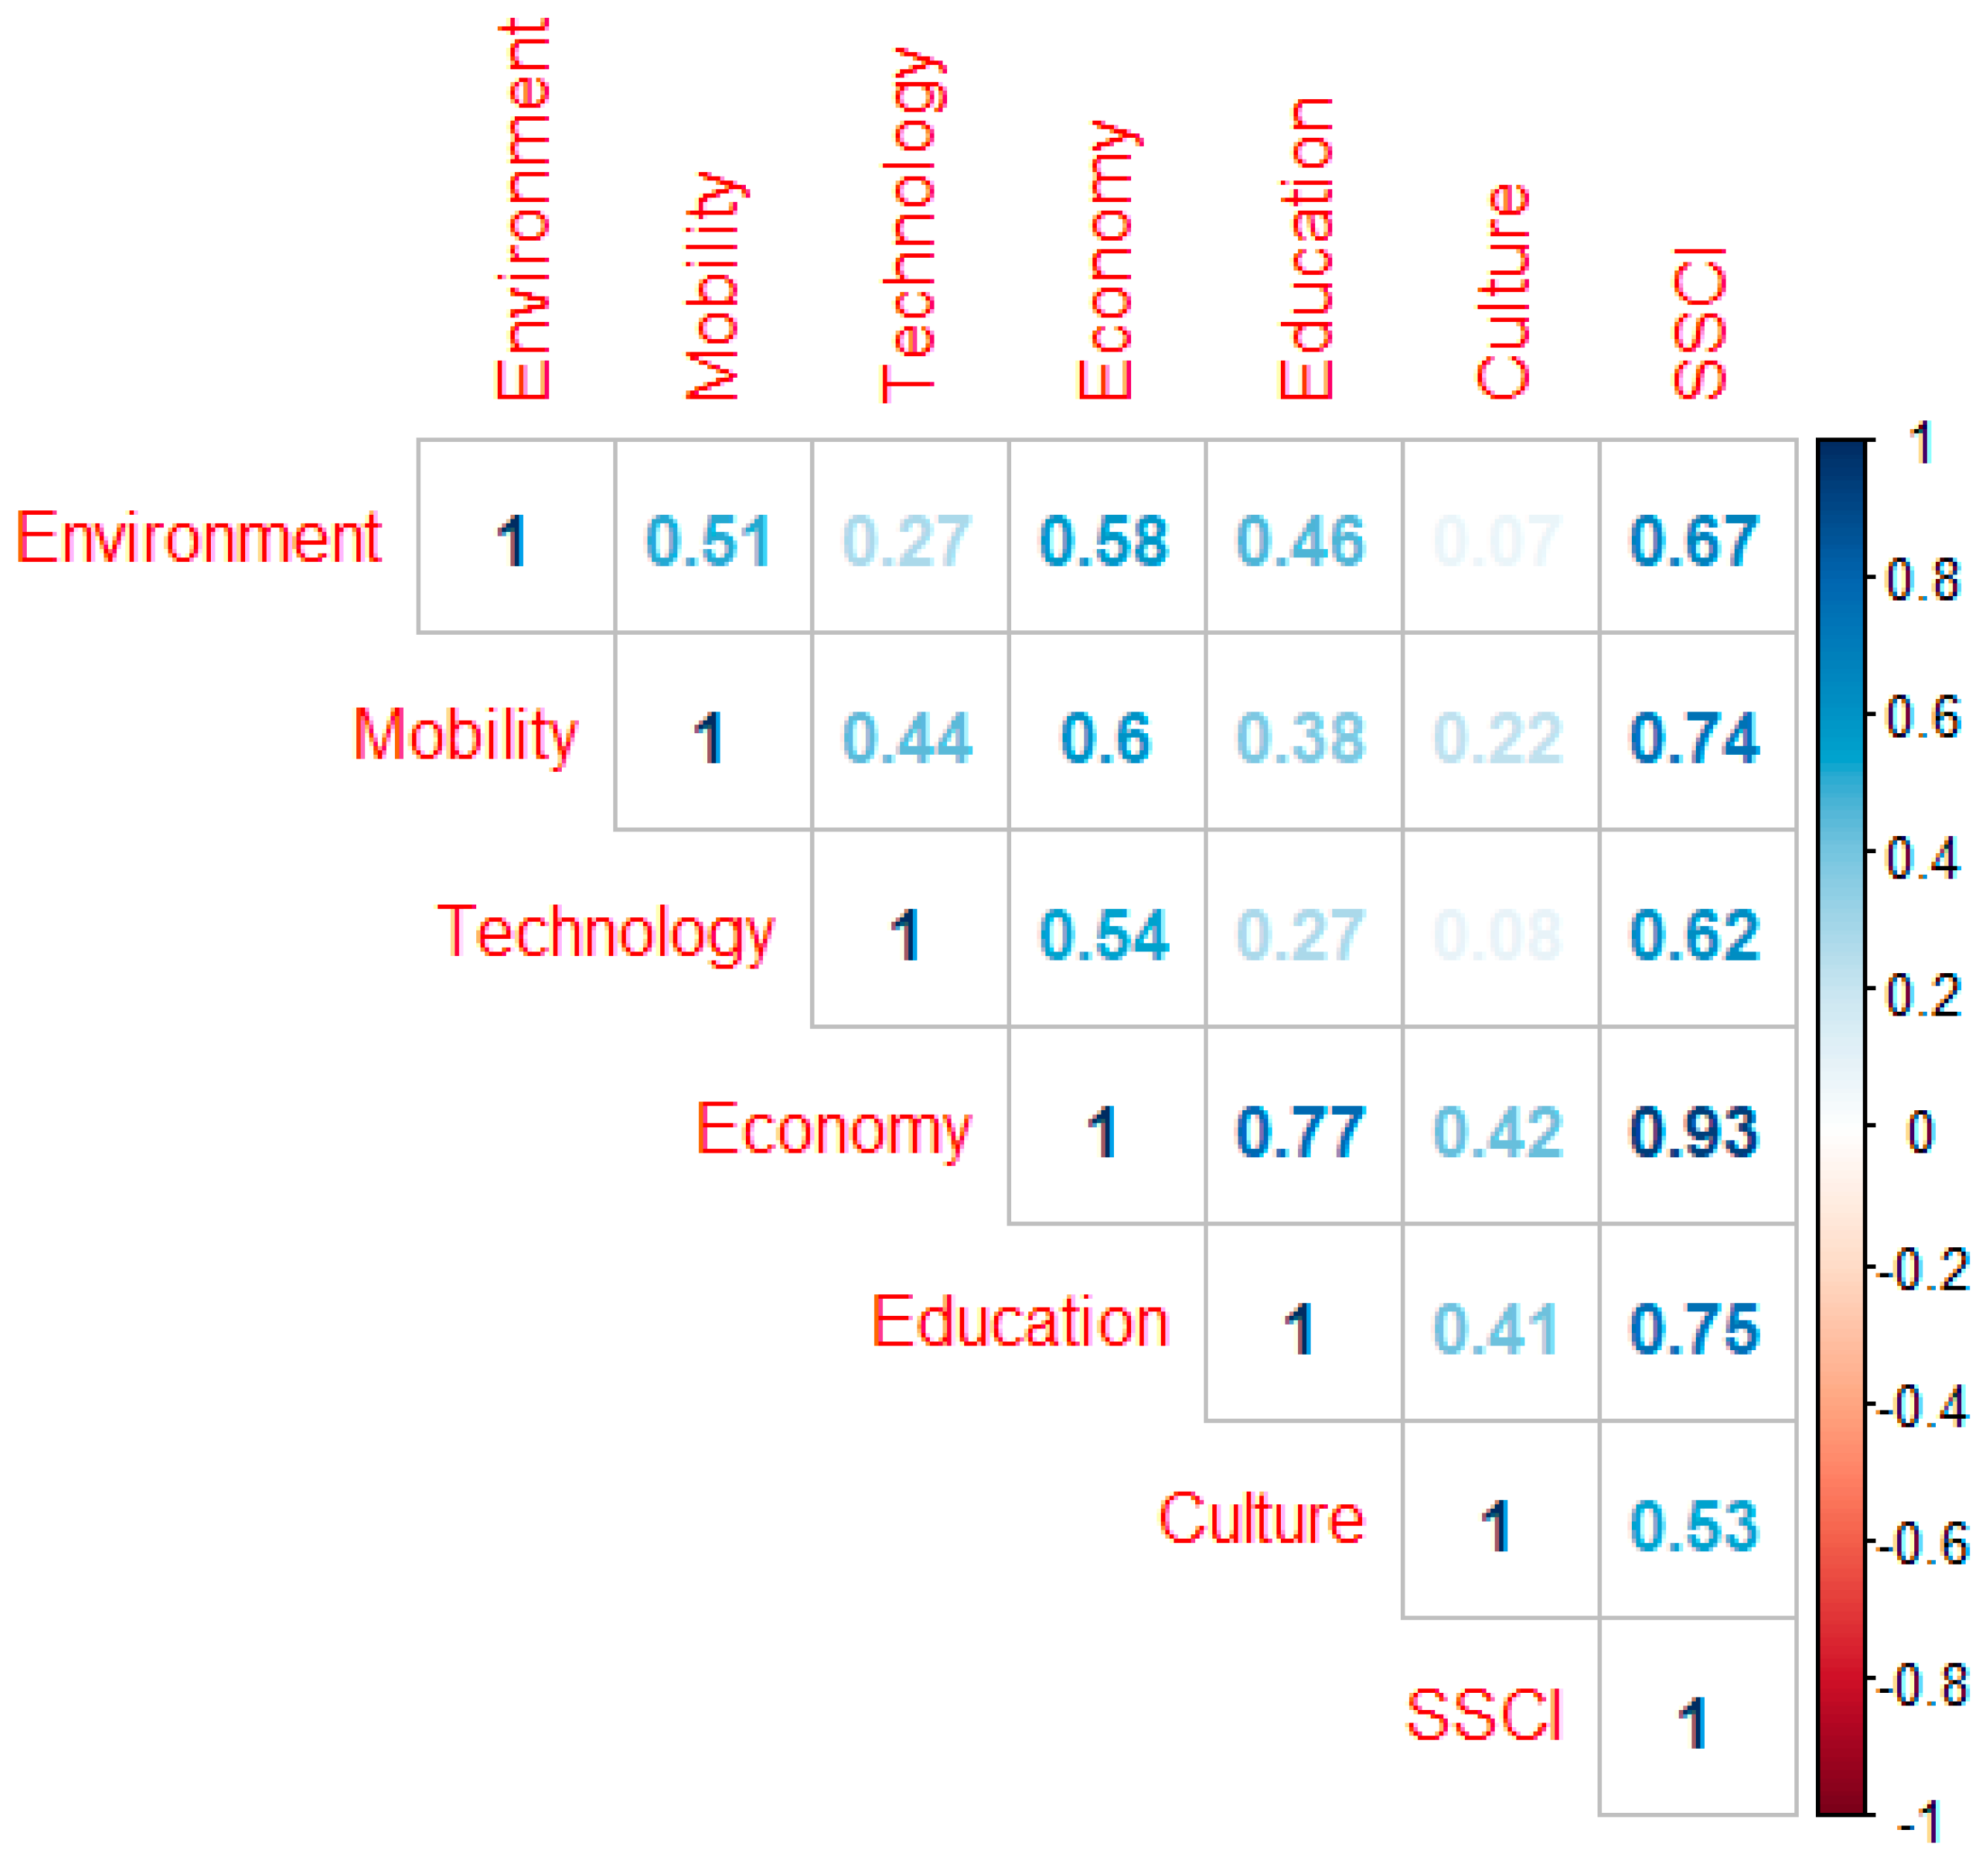
The Figure 1 shows the correlations that affect the different smart sustainable cities’ dimensions. Starting from here, we can notice that the economy was strongly correlated to education (0.77). In addition, there was a positive high correlation between economy and mobility (0.60) such as between economy and environment (0.58). The correlation matrix reveals positive bi-univocal relations also between economy and technology (0.54) and mobility and environment (0.51), while no negative correlations emerged. This testifies that all dimensions participated inter-organically in the development of a smart sustainable city and the truthfulness of the holistic model of analysis.
The results of the environmental dimension (Table A1, Appendix A) present Matera (10.73) as the most virtuous municipality in the containment of pollution levels and in the enhancement of its environmental heritage. Treviso (9.01), Milan (8.87), Turin (8.87) and Trento (8.81) complete the top five. On the other hand, Caltanissetta (1.58), Crotone (1.55), Foggia (1.44), Trapani (1.10) and Enna (0.27) close the ranking, proving to be the least smart environment municipalities.
Looking at the environment ranking (Table A2, Appendix A), it is possible to notice some more specifically established trends at the regional level. For example, the Lombard municipalities occupied an average position of 17.25, placing all between position 3 and 48. If we exclude Varese and Lecco, there were as many as 10 municipalities in Lombardy among the 19 environmental smartest municipalities in Italy. In Veneto, Treviso, Padua and Vicenza occupied positions two, seven and eight, respectively, followed by Venice and Verona in positions 21 and 28. On the other hand, the Calabrian municipalities had an average ranking of 85.6. Negative situations also characterised the Apulian municipalities; they showed an average rank of 87.88. Looking at Molise, Isernia and Campobasso were in positions 92 and 105, respectively. However, at an aggregate regional level, from an environmental point of view, the Sicilian municipalities showed the worst environmental results. The average position they occupied was 100, and if we exclude Palermo, the remaining ones ranged from 96 in Syracuse to 112 in Enna.
The municipalities which had a mobility that conformed more to the paradigm of smart sustainable cities (Table A1, Appendix A) were Venice (13.66), Milan (10.33), Turin (7.08), Cagliari (6.87) and Padua (6.75). The most populated municipalities tended to show a high coverage of local public transport and a greater propensity to open cycle paths. Conversely, Imperia (0.52), Agrigento (0.48), Caltanissetta (0.46), Andria (0.43) and Vibo Valentia (0.33) were the five municipalities that had local mobility systems more distant from smart sustainable standards.
On a regional level (Table A2, Appendix A), the Veneto municipalities occupied the average position 21.71, ahead of the municipalities of Emilia-Romagna (27.67) and Lombardy (28.08). Positive were also the results recorded in Friuli Venezia Giulia (35), with the only negative exception represented by Gorizia (1.18, rank 80). Among the less advanced regions in sustainable mobility, we identified Basilicata (average rank of 105.5), Molise (80) and Sicily (91.11). Sardinia had a fragmented picture: while Cagliari was the fourth smartest and the most sustainable municipality in terms of mobility, the remaining Sardinian municipalities oscillated between position 82 in Sassari (1.15) and position 100 in Oristano (0.68).
The most technological municipalities (Table A1, Appendix A), in terms of innovation in business and broadband to the home, were Turin (6.93), Rome (6.75), Brindisi (6.32), Catania (6.16), Pisa (6.16) and Padua (6.10). On the other hand, the less technological municipalities were represented by Gorizia (0.60), Oristano (0.60), Trapani (0.52), Biella (0.48), Caltanissetta (0.36) and Carbonia (0.28).
Considering the regional picture (Table A2, Appendix A), Cagliari is an exception for the region of Sardinia, as it records high values on the technological dimension, especially when compared to the values of the other municipalities. If we exclude Cagliari (4.84, rank 14), in fact, a Sardinian municipality occupied on average the position 100.2. Abruzzo and Piedmont, with average ranks of 74.75 and 72.38, respectively, showed technological situations still poorly evolved. The case of Piedmont was significant for a high fragmentation; if on the one side there is Turin, on the other side we found municipalities characterised by low degrees of technological innovation such as Alessandria (2.12, rank 81), Cuneo (1.89, rank 87), Verbania (1.00, rank 100), Vercelli (0.72, rank 104) and Biella (0.48, rank 110). Between the regions more markedly technological, we observed Trentino Alto Adige (Trento (4.96) and Bolzano (4.20) were, respectively, in positions 10 and 23), Veneto (in particular Padua and Verona (4.92, rank 11)) and Lombardy (Monza (5.05), Lodi (4.92) and Milan (4.35) are in the top 20).
Moving on to the economic dimension (Table A1, Appendix A), Milan (10.80), Lodi (9.15), Padua (8.98), Siena (8.8) and Bologna and Pisa (8.49) with equal scores were the first municipalities classified. These municipalities represent, on the whole, the municipalities with the most marked entrepreneurial vocation and, at the same time, the municipalities where the greatest economic well-being was found. On the contrary, Reggio Calabria (1.65), Carbonia (1.61), Barletta (1.13), Crotone (1.02) and Andria (0.82) are the municipalities that were the most critical in this dimension.
From the analysis on a regional basis (Table A2, Appendix A), we noted that the two municipalities of Trentino Alto Adige were at the top of the ranking (Trento was in position 11, Bolzano in position 12). The first two municipalities of the distribution (i.e., Milan and Lodi) belong to Lombardy, which also includes Monza and Bergamo (8.33) in the top 7. Within this positive trend at the regional level Veneto also stood out, with Padua, Verona and Treviso in the top 18. The most critical situations were attributable to Puglia (average position of the municipalities equal to 89), Sicily (98.67) and Calabria (99).
Looking at the education dimension (Table A1, Appendix A), we can see that Bologna (10.04), Siena (10.01), Pavia (9.83), Trento (9.80) and Padua (9.77) stand out. These municipalities had the highest number of students with high performance in education at various levels, i.e., primary, secondary and tertiary education. On the contrary, the worst statistics were found in Naples (3.66), Catania (3.55), Barletta (3.25), Carbonia (2.04) and Andria (1.94).
Analysing the results at the regional level (Table A2, Appendix A), it is possible to notice that the municipalities in Lombardy tended to have the highest levels of education with an average position of 21.92; if we look at the top 10, four municipalities were in Lombardy (Pavia, Bergamo (9.36), Milan (9.33), Monza (9.16)). Veneto and Trentino Alto Adige follow with average positions of 25.43 and 25.5, respectively. At the antipodes, we found instead Puglia, Sicily and Sardinia, which present strong criticality in the field of education in all three indicators taken as reference.
Siena (14.37) was the first municipality, with great detachment, in the cultural dimension (Table A1 and Table A2, Appendix A). To the advantage of Siena, there is a high number of museums, galleries and monuments as well as a consistent cultural heritage in relation to the resident population, followed by Pavia (6.76), Macerata (6.74), Mantua (6.22), Perugia (6.06) and Florence (6.05). Among the most deficient municipalities we noted the presence of Monza (0.55) and four Apulian municipalities, namely, Foggia (0.48), Barletta (0.46), Taranto (0.39) and Andria (0.19).
The regional results (Table A2, Appendix A), in addition to the positive data on Valle d’Aosta (Aosta was in position 15), indicate the good performance of Marche (the average position of its municipality was equal to 18.8), Friuli Venezia Giulia (30.25) and Liguria (33). On the other hand, the regions with the lowest cultural endowment were Sicily (78.78), Calabria (80.6) and Apulia (90.38).
Analysing the results of SSCI (Table A1, Appendix A), it emerged that Siena was the Italian municipality that showed the smartest and most sustainable traits (SSCI = 14.93). In particular, Siena was in the top four in three different dimensions, such as culture (position (1), education (2) and economy (4). Siena’s main weakness can be found in the environmental dimension (91). This interdimensional gap contributes to the increase in the variability between the Siena’s performances in the different dimensions. For this reason, Siena’s standard deviation was above average (31.64 versus 20.59). Milan, the second municipality ranked by value of SSCI (14.56), showed a similar variability to Siena (30.21). Its strengths were economy (position 1), mobility (2) and environment (3), while its shortcomings emerged in the culture dimension (86). The Veneto municipality of Padua was the 3rd smartest and sustainable city (14.35). Contrary to the previous ones, it showed a low variability (4.92). If we exclude the culture dimension, Padua regularly fell into the top seven in all the other dimensions. Venice and Turin, with an SSCI score, respectively, equal to 13.03 and 12.97, was close the top five. Among the municipalities that have not taken effective action to increase their smart and sustainable levels were Carbonia (2.80), Barletta (2.46), Caltanissetta (2.01), Trapani (1.86) and Andria (1.36). The last four municipalities in the SSCI ranking showed a rather limited tendency to vary, below average (11.45 versus 20.59). This confirms that the most critical municipalities had rather homogeneously spread weaknesses of different sizes. In addition, the SSCI ranking highlighted the weakness of the Apulian and Sicilian municipalities from a smart and sustainable point of view (Table A2, Appendix A). An Apulian municipality on average occupied the position 87.88, while a municipality of Sicily on average occupied the position 100.11. To these, we can add the municipalities of Calabria, on average in the position of 90.4. At the antipodes, we find Trentino Alto Adige, Lombardy and Veneto, municipalities which on average occupied positions 15, 21.58 and 21.57.
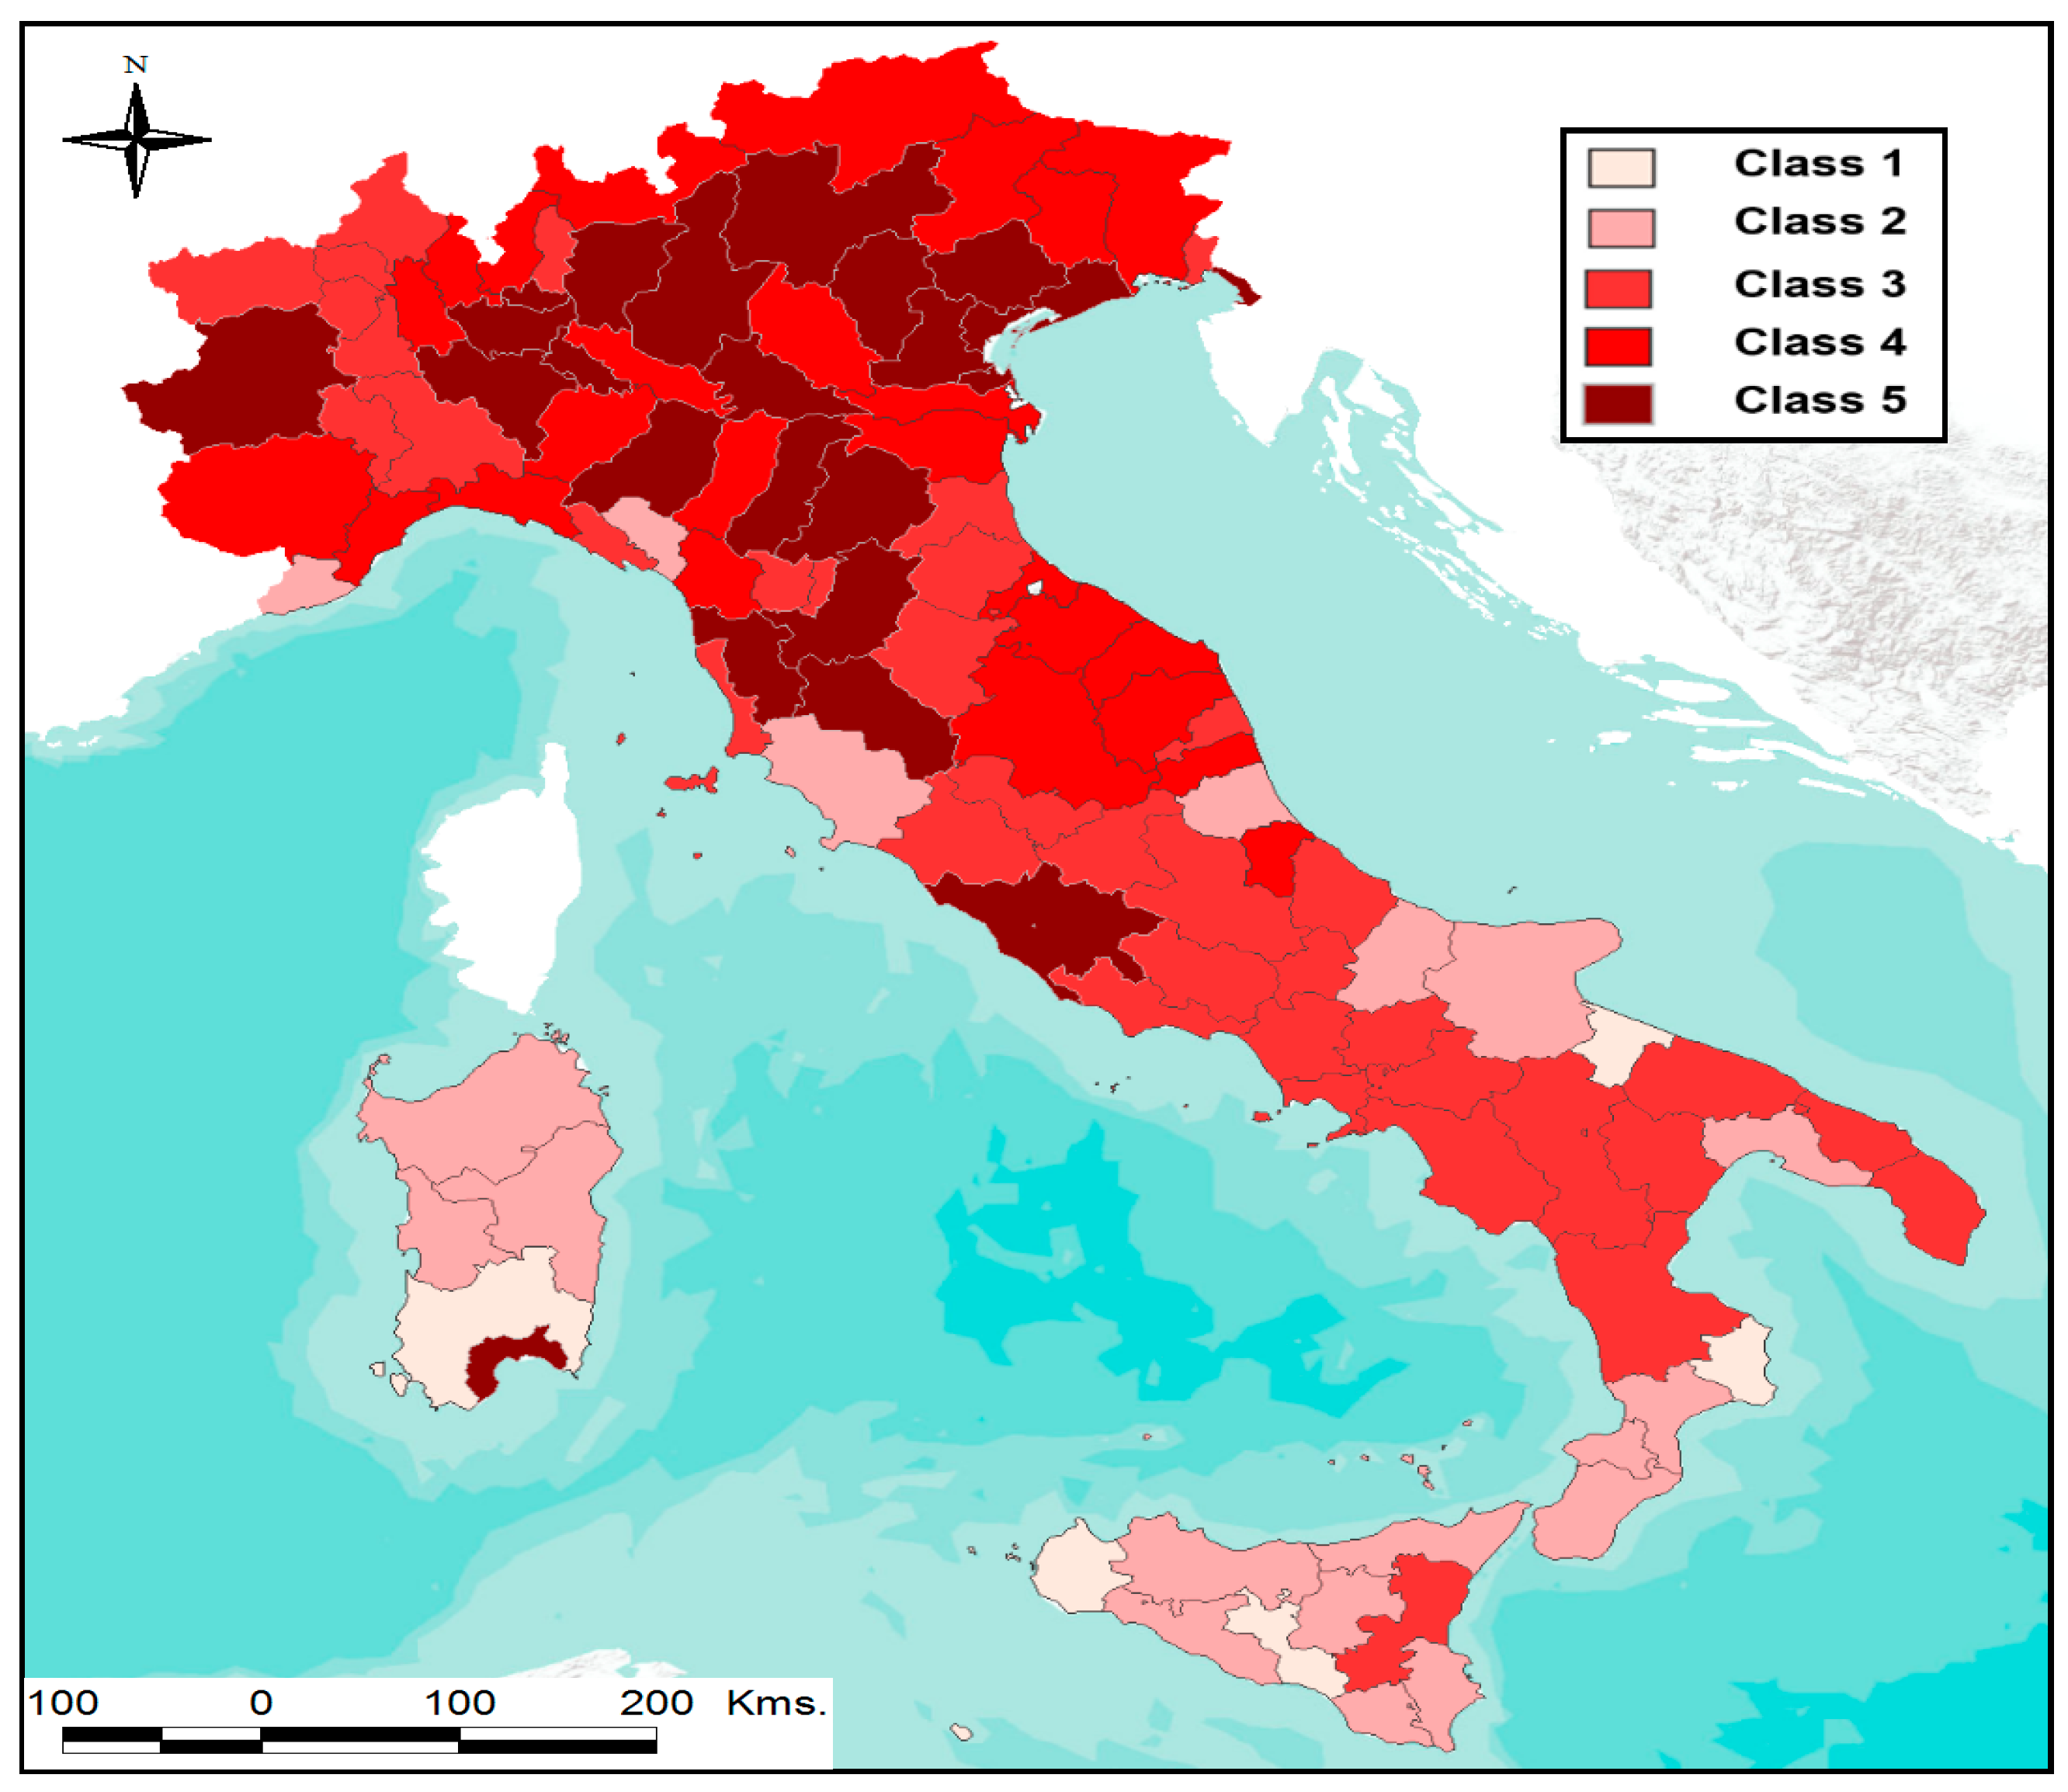
Figure 2 represents the classes obtained from cluster analysis, with the aim of identifying, if any, trends from a geographical point of view (the division into classes is provided as Table A3, Appendix A). Higher classes correspond to better results. Cities were divided into five different classes. Then, class 5 identified the best performing cities, while class 1 were inserted the worst.
The graphic analysis shows that the situation in northern municipalities was more marked by the transition to the smart sustainable city model than in central and southern Italy. It was possible to identify some areas where the concentration of smart sustainable cities was more accentuated. The north–west in the contiguous area formed by Genoa–Savona–Cuneo–Turin showed a block of municipalities between class 4 and 5. Another area with a high concentration of smart sustainable cities started from Lombardy and extended to Trieste. A further cluster was one that started from Siena and Pisa, crossed the Emilia–Romagna ridge and arrived in Piacenza. In these terms, Piacenza represents the geographical link between “being smart and sustainable” in Central and Northern Italy.
5. Discussion
The results, if referring to the nature of each municipality, communicate that there was no city model with a natural predisposition to the smart and sustainable transformation process. The outcome of the process is determined by the ability to make the most of its heritage and to exploit the windows of opportunity that arise. Municipalities of different nature and size, such as Siena and Milan, can both undertake a path towards an innovative turning point, starting from the enhancement of the resources available, the identification of local territorial needs and the related solutions to remedy the problem.
The historic centre of Siena was declared a World Heritage Site by UNESCO in 1995. A wide variety of historical and interesting places are located in the municipality. Siena is also promoting a series of public–private partnership initiatives with the aim of increasing the quality of public services offered, the liveability of the city and the well-being of the citizen [96]. The pivot of the strategy lies in the collaboration between companies and public administrations. In the intentions of the actors involved, the positive effects of private–public relations should be reflected in the internationalisation of local companies and in the enhancement of the municipal brand.
Milan is a city that, also thanks to its centrality in international urban networks and its brand exported at a European level, is recognised among smart cities at a European level. Several organisations recognise its established role and its continuous progress towards an innovative city model. In particular, through the ICity Rank 2019 report, the Public Administration Forum (FPA) has established Milan as the smartest city in Italy [97]. The high level of internationalisation makes Milan one of the Italian municipalities with the most solid entrepreneurial economic fabric. Milan has been committed to a European project to promote the use of renewable energy at district level [98]. The reduction of air pollution levels is the basis of another European project, which currently sees Milan engaged in a partnership with London and Lisbon [99]. The latter focuses more specifically on promoting sustainable mobility.
Despite their different starting characteristics, the two municipalities have a strong focus on enhancing resources and undertaking smart and sustainable development initiatives by different modalities. This statement finds its justification in the theory of change (ToC) [100,101,102,103], according to which a process of transformation (also local) cannot disregard a dialogue-based process that is used to generate a description of a sequence of events expected to lead to a desired outcome in a particular context [104]. In other words, a better understanding of the needs of a city depends on a conceptual path composed by four essential elements [105,106]: (i) the analysis of the context, intended as current conditions and challenges that affect a specific context; (ii) the identification of a long-term vision; (iii) the assessment of a series of interventions that may lead to the desired long-term goal/change within a given context; (iv) the assumptions about how change events/activities might happen and the appropriateness of the outputs in the reference context.
Adopting a ToC-based approach implies conceiving the city from a multidimensional point of view, given the multiple repercussions that an action can have in different fields such as sociology, political science, communications, environmental and organisational psychology [107], education, public health [108], community development and international development [102,104,105]. In these terms, a ToC can help in developing an all-embracing picture of a specific urban process transformation, in order to achieved, through differentiated activities, needs and local interests.
As mentioned earlier, the annual ICity Rank report measures adaptive capacity (intelligence) in the journey towards cities that are more dynamic, more functional, more ecological, more liveable, more manageable, more innovative and more capable of promoting sustainable development by reacting to ongoing changes through the use of new technologies. The ICity Rank 2019 includes six indexes, each focused on a specific dimension. The dimensions identified are those of economic soundness, sustainable mobility, environmental protection, social quality, governance capacity and digital transformation. For the most part, we can see correspondences between the constituent dimensions of SSCI and ICity Rank. The calculation method with which the ICityRank was aggregated is the geometric mean. A comparison can be made between SSCI and ICity Rank results, despite SSCI measures 112 Italian municipalities and ICity Rank focuses on 107 Italian cities. However, the results obtained are largely superimposable. For example, if we look at SSCI top ten, it is possible to realise that Milan (two in SSCI and one in ICity Rank), Venice (four and seven), Turin (five in both cases), Bologna (six and three), Trento (seven and six) and Florence (nine and two) are overall similar profiles. The same finding is obtained if we consider the ten worst municipalities in SSCI ranking. Andria (112 and 96), Trapani (111 and 102), Caltanissetta (110 and 104), Carbonia (108 and 95), Crotone (107 in SSCI and ICity Rank), Agrigento (105 and 105), Enna (104 and 103), Reggio Calabria (103 and 99), Messina (102 and 92) are critical cases in both SSCI and ICity Rank.
Results at the municipal level are similar for both indexes. If the cities with the greatest smart and sustainable potential are placed in the centre–north of the country, the most deficient are in the central, southern and island areas. It is impossible avoid noticing that the systemic flaws that permeate the entire south of Italy widely penalize a major part of the southern municipalities. Thus, it is that Andria, Trapani, Caltanissetta and Carbonia, just to name a few, suffer from high levels of unemployment caused by a weak entrepreneurial fabric and an economy undermined by the lack of factors for rapid revival. The spiral acts on territorial economies in crisis, where the absence of job opportunities has swollen the staff of the participated companies, creating critical situations of disruption in public budgets. The lack of public resources precludes the injection of liquidity to encourage opportunities for public–private partnerships. The impossibility of reaction negatively affects private initiative. In such a situation, the efficiency of services is also seriously at risk.
Therefore, from our analysis it is possible to note that there is a polarization at the national level on the progressive transition to smart sustainable cities, as shown by macro-geographical analysis. On the one hand, the gap between north–centre and centre–south can be referred to the wider gap that involves the country system Italy between north and south [109,110]. The greatest differences between north and south can be attributed to four main orders of factors: transport infrastructures and services, investment capital, security and land development. The first gap suggests to further strengthening and developing the network of transport infrastructures and services that can activate in turn entrepreneurial and economic cumulative mechanism. Second and third penalizing factors are interrelated. Perceived security has a direct impact on the availability of investment and its scale. Promoting the fight against organised crime can be functional in this sense. Lastly, the image of southern Italy should be “corrected” and strengthened [109]. Against the prejudicial view that affects the south, adequate territorial marketing policies should be adopted. The aim is to modify the wrong knowledge of, and judgement about, the real territorial attractiveness of places. International events can help the growth of southern Italy [111], as well as the enhancement of specific mixes of tangible and intangible assets [112].
On the other hand, it can be assumed that there are spillovers that produce benefits between adjacent areas of the country. These influences, based on what happens for the dissemination of knowledge between companies operating in different geographical areas [113,114], can determine the joint progress of several municipalities through the sharing and adoption of good practices [115,116,117].
Recent analyses have been developed with the intention of measuring smart and sustainable progress and disproportions between different territorial areas. Remaining within Italian borders, Reference [67] formulates a methodology to measure the quality of urban life based on investigative checklists and both objective and subjective indicators. They are aggregated in order to develop an index to evaluate Cagliari’s level of smart urban quality.
Internationally, a recent empirical study on the smart and sustainable cities is represented in Reference [118]. In their study, the authors rank 28 European capital cities, using hierarchical clustering and principal component analysis. The results show that Berlin and Nordic capital cities are the best performing smart and sustainable cities. On the other hand, Sofia and Bucharest obtain the lowest scores. The authors show that the cities of Eastern Europe have not yet embarked on a path of development in a smart and sustainable sense or that the development proceeds particularly slowly, when compared to that of the most virtuous countries. The authors thus define a trend on a geographical basis, as well as a correlation between the smart and sustainable level and gross domestic product per inhabitant. On the contrary, population and city size do not seem to be particularly significant proxies in defining the smart and sustainable identity of a city.
With specific reference to Eastern Europe, the study by [119] is highlighted. Reference [120] studies instead how Belgian municipalities understand the concept of smart cities in 2016. Their results also show that municipalities with no understanding of the smart city concept or with a technical understanding are mostly located in small and rural municipalities. Extending the analysis to non-European borders, Reference [121] found a tendency for large Brazilian cities to perform better than small cities. This paper suggests a relationship between city size and smart performance that is difficult to empirically identify in the cases of European cities.
Despite the similarities or differences that may characterise the different studies, it is appropriate to take into account the needs arising from the different local, sub-national, national and supra-national territorial levels in the formulation of appropriate public policies. The deepest implication that can be deduced from the reading of the different papers just mentioned, is that the planners in the most critical areas, so that they can be properly upgraded in a smart and sustainable orientation, must provide policies congruent with the local context.
6. Conclusions
In this paper we offer an application of how it is possible, based on a specifically defined framework, to monitor the convergence process to the paradigm of smart sustainable cities in Italy. In literature it is possible to trace works that pursue this same goal, however, the particularity of the work is given by the development of this analysis according to a triple criterion: (i) the analysis is grafted within the paradigm of smart sustainable cities, so the choice of the constitutive dimensions of the SSCI reflects the theoretical developments of the literature on the subject; (ii) the method adopted is recognised as robust in the literature and offers many advantages in the analysis of a complex phenomenon; moreover, it allows to hierarchise statistical units according to the values obtained by the SSCI, so it is well suited to the comparative analysis and the purposes proposed in this paper; (iii) the basic statistical unit is selected at a local level and represents a geographical focus respect to the city level, if we consider that Italian municipalities are active entities in the pursuit of objectives in the field of sustainability and innovation; the geographical level of analysis is a peculiarity of our work, if compared with other articles on the topic [118,122].
In this case, the choice of indicators was the result of a literature review, the identification of the main thematic areas and the availability of complete data covering the identified thematic areas. More generally, the same process of selecting indicators should take into account a programmatic aspect, namely, the fact that a certain degree of subjectivity must precede the composition of the dashboard of indicators. In dealing with concepts that involve human wellbeing or quality of life, the consensus on what indicators should be selected and on their interpretation is often low [76]. In addition, the monitoring of different realities can also take place by means of different indicators, chosen consistently with the nature of the programmatic choices to be made [123,124].
By analysing the correlation results, it is possible to state that the municipalities where education prevails are also the municipalities where there are the best economic conditions. This result feeds the strand of literature that argues that education is the primary element that affects economic well-being, strengthens the economic and business fabric, produces innovation, development and makes areas more attractive for national and international investment [125]. More in general, economic well-being is an indispensable condition to generate a systematic transition to a more current paradigm of smart and sustainable cities [126]. The correlation between the mobility and the environment is also relevant. This testifies that in the smart sustainable city the two components are closely connected, positively related and not antithetical [53].
Among the main suggestions for further works, it would be advisable to reproduce this same analysis through non-aggregative approaches, i.e., methods that by their characteristics contrast with the current one. In this way, it would be possible to test the robustness of the index and its sensitivity to the calculation method used. We also recommend the analysis of demographic variables that may affect urban balances. In this way, it would be possible to identify the most relevant determinants capable of altering the benchmarks of smart sustainable cities on its different components. On the contrary, it could result more problematic the analysis in historical series. The amount of data currently made available to researchers by statistical institutions is small. More innovative data collection systems, where they have been adopted, have recently become fully operational and the database has not yet been consolidated. In addition, data takes several years before they can be adjusted and loaded into the database and, thus, made accessible [127]. Scarcity of data is the main limitation of the work. The choice of data, although set on an evaluative criterion that tends to limit as much as possible the discretionary space of the researcher, suffers from this flaw. We think it is important to encourage the emergence of a pervasive system of data collection that is broader and better integrated in its various dimensions. Doing so would make it possible to evaluate in greater depth and better the trend of phenomena at a level close to residents.
Author Contributions
Study conceptualization, A.C., E.I., R.G.-R.; Methodology, A.C. and E.I.; data collection, A.C. Supervision, R.G.-R. All authors have written and revised the text of this paper. All authors have read and agreed to the published version of the manuscript.
Funding
This research received no external funding.
Institutional Review Board Statement
Not applicable.
Informed Consent Statement
Not applicable.
Data Availability Statement
Not applicable.
Conflicts of Interest
The authors declare no conflict of interest.
Appendix A

Table A1.
Appendix: results for dimension, SSCI and variability. Source: Our elaboration.
| Municipality | Environment | Mobility | Technology | Economy | Education | Culture | Variability | SSCI | |||||||
|---|---|---|---|---|---|---|---|---|---|---|---|---|---|---|---|
| Value | Rank | Value | Rank | Value | Rank | Value | Rank | Value | Rank | Value | Rank | Value | Rank | ||
| Agrigento | 2.06 | 104 | 0.48 | 109 | 1.35 | 93 | 2.16 | 101 | 6.23 | 85 | 2.43 | 51 | 19.29 | 3.56 | 105 |
| Alessandria | 6.06 | 32 | 1.40 | 71 | 2.12 | 81 | 4.23 | 77 | 6.35 | 83 | 1.51 | 80 | 17.71 | 6.05 | 78 |
| Ancona | 3.87 | 74 | 1.84 | 52 | 5.54 | 7 | 6.73 | 22 | 8.75 | 16 | 2.77 | 42 | 22.99 | 9.33 | 29 |
| Andria | 3.40 | 80 | 0.43 | 111 | 1.26 | 95 | 0.82 | 112 | 1.94 | 112 | 0.19 | 112 | 12.23 | 1.36 | 112 |
| Aosta | 5.06 | 51 | 1.03 | 88 | 0.98 | 101 | 5.97 | 34 | 6.79 | 76 | 4.54 | 15 | 30.27 | 7.31 | 51 |
| Arezzo | 3.51 | 78 | 1.12 | 84 | 2.80 | 61 | 5.84 | 39 | 7.58 | 61 | 2.24 | 58 | 14.57 | 6.90 | 60 |
| Ascoli Piceno | 2.42 | 94 | 1.61 | 63 | 2.37 | 76 | 5.53 | 44 | 8.53 | 25 | 5.79 | 8 | 29.41 | 7.99 | 39 |
| Asti | 6.94 | 20 | 0.81 | 94 | 2.80 | 61 | 4.58 | 67 | 6.11 | 88 | 1.97 | 67 | 23.84 | 6.72 | 65 |
| Avellino | 4.83 | 53 | 1.66 | 60 | 1.18 | 97 | 4.69 | 63 | 8.07 | 39 | 2.29 | 56 | 17.67 | 6.31 | 72 |
| Bari | 4.49 | 63 | 2.53 | 34 | 4.58 | 16 | 4.38 | 71 | 5.81 | 89 | 2.38 | 53 | 23.94 | 7.29 | 52 |
| Barletta | 3.68 | 75 | 0.54 | 107 | 2.24 | 78 | 1.13 | 110 | 3.25 | 110 | 0.46 | 110 | 15.50 | 2.46 | 109 |
| Belluno | 4.45 | 65 | 1.96 | 49 | 1.41 | 92 | 5.99 | 33 | 9.04 | 11 | 3.87 | 22 | 27.24 | 7.88 | 42 |
| Benevento | 5.55 | 41 | 1.39 | 72 | 2.25 | 77 | 3.66 | 90 | 7.78 | 50 | 2.68 | 45 | 18.17 | 6.46 | 68 |
| Bergamo | 7.93 | 12 | 3.78 | 18 | 3.89 | 33 | 8.33 | 7 | 9.36 | 7 | 3.23 | 32 | 10.79 | 11.53 | 12 |
| Biella | 5.69 | 39 | 1.25 | 78 | 0.48 | 110 | 5.94 | 36 | 6.56 | 79 | 4.09 | 20 | 31.09 | 7.11 | 56 |
| Bologna | 5.36 | 45 | 4.02 | 13 | 5.39 | 8 | 8.49 | 5 | 10.04 | 1 | 4.46 | 16 | 14.43 | 12.21 | 6 |
| Bolzano | 4.57 | 58 | 3.95 | 16 | 4.2 | 23 | 7.68 | 12 | 7.86 | 47 | 2.54 | 47 | 17.53 | 9.8 | 23 |
| Brescia | 7.91 | 13 | 6.7 | 6 | 4.17 | 24 | 6.89 | 21 | 8.13 | 38 | 2.08 | 63 | 18.70 | 11.09 | 14 |
| Brindisi | 2.28 | 99 | 1.41 | 68 | 6.32 | 3 | 4.86 | 61 | 4.42 | 102 | 0.98 | 99 | 34.78 | 6.42 | 69 |
| Cagliari | 5.09 | 49 | 6.87 | 4 | 4.84 | 14 | 6.96 | 20 | 6.26 | 84 | 3.92 | 21 | 26.98 | 10.93 | 18 |
| Caltanissetta | 1.58 | 108 | 0.46 | 110 | 0.36 | 111 | 1.68 | 107 | 4.65 | 101 | 1.47 | 82 | 9.99 | 2.01 | 110 |
| Campobasso | 2.03 | 105 | 1.12 | 84 | 1.65 | 90 | 4.63 | 65 | 9.01 | 12 | 2.19 | 60 | 29.74 | 5.68 | 85 |
| Carbonia | 4.31 | 67 | 0.75 | 97 | 0.28 | 112 | 1.61 | 109 | 2.04 | 111 | 2.97 | 33 | 29.13 | 2.8 | 108 |
| Carrara | 4.32 | 66 | 2.03 | 46 | 1.32 | 94 | 4.4 | 69 | 6.56 | 79 | 0.6 | 106 | 19.49 | 5.18 | 87 |
| Caserta | 4.6 | 57 | 1.39 | 72 | 2.45 | 71 | 3.84 | 86 | 8.5 | 26 | 2.05 | 64 | 18.62 | 6.28 | 73 |
| Catania | 2.24 | 101 | 1.13 | 83 | 6.16 | 4 | 4.09 | 82 | 3.55 | 109 | 1.65 | 76 | 34.11 | 5.93 | 81 |
| Catanzaro | 4.25 | 70 | 1.3 | 75 | 2.8 | 61 | 2.98 | 96 | 6.85 | 74 | 1.19 | 93 | 12.43 | 5.15 | 88 |
| Cesena | 5.35 | 46 | 3.17 | 25 | 2.4 | 74 | 5.32 | 48 | 7.66 | 59 | 2.48 | 50 | 14.73 | 7.75 | 45 |
| Chieti | 4.31 | 67 | 2.76 | 30 | 1.11 | 98 | 4.19 | 81 | 8.14 | 37 | 2.03 | 65 | 23.57 | 6.13 | 75 |
| Como | 8.06 | 11 | 2.25 | 38 | 3.28 | 47 | 5.78 | 41 | 8.06 | 40 | 2.5 | 49 | 12.54 | 8.96 | 31 |
| Cosenza | 3.65 | 76 | 2.01 | 47 | 4.09 | 27 | 4.22 | 78 | 6.13 | 87 | 3.46 | 29 | 24.10 | 7.09 | 57 |
| Cremona | 7.76 | 14 | 4.3 | 10 | 3.31 | 45 | 5.84 | 39 | 8.16 | 35 | 2.79 | 40 | 13.45 | 9.68 | 26 |
| Crotone | 1.55 | 109 | 0.76 | 96 | 3.17 | 52 | 1.02 | 111 | 4.66 | 100 | 1.25 | 91 | 19.68 | 2.88 | 107 |
| Cuneo | 5.26 | 47 | 2.18 | 41 | 1.89 | 87 | 5.91 | 37 | 7.61 | 60 | 2.39 | 52 | 16.51 | 7.45 | 48 |
| Enna | 0.27 | 112 | 0.65 | 102 | 3.39 | 41 | 2.49 | 98 | 5.45 | 92 | 1.48 | 81 | 22.90 | 3.59 | 104 |
| Fermo | 3.58 | 77 | 0.61 | 104 | 0.66 | 106 | 3.94 | 85 | 7.05 | 69 | 5 | 11 | 31.72 | 5.83 | 83 |
| Ferrara | 5.59 | 40 | 1.76 | 56 | 2.82 | 60 | 5.74 | 42 | 7.78 | 50 | 4.8 | 14 | 15.03 | 8.7 | 34 |
| Florence | 5.53 | 42 | 6.02 | 8 | 4.28 | 21 | 7.39 | 13 | 8.33 | 30 | 6.05 | 6 | 12.74 | 12.07 | 9 |
| Foggia | 1.44 | 110 | 1.17 | 81 | 3.32 | 44 | 3 | 93 | 5.45 | 92 | 0.48 | 109 | 22.18 | 3.93 | 99 |
| Forlì | 4.62 | 56 | 1.97 | 48 | 2.44 | 72 | 5.21 | 52 | 7.73 | 54 | 1.64 | 77 | 10.75 | 6.82 | 63 |
| Frosinone | 6.12 | 29 | 1.41 | 68 | 2.1 | 82 | 4.88 | 60 | 7.21 | 67 | 0.86 | 104 | 22.65 | 6.34 | 71 |
| Genoa | 3.09 | 84 | 2.25 | 38 | 4.48 | 18 | 6.12 | 31 | 7.76 | 53 | 2.88 | 36 | 20.91 | 8.28 | 36 |
| Gorizia | 5.94 | 35 | 1.18 | 80 | 0.6 | 107 | 4.28 | 76 | 7.82 | 48 | 5.7 | 10 | 31.97 | 7.29 | 52 |
| Grosseto | 2.39 | 95 | 0.77 | 95 | 2.19 | 80 | 4.4 | 69 | 6.9 | 72 | 1.08 | 97 | 11.50 | 4.87 | 92 |
| Iglesias | 4.5 | 62 | 0.99 | 92 | 1.71 | 89 | 2.89 | 97 | 4 | 106 | 3.8 | 24 | 27.79 | 4.96 | 90 |
| Imperia | 2.94 | 86 | 0.52 | 108 | 0.7 | 105 | 4.63 | 65 | 6.93 | 71 | 3.52 | 26 | 27.71 | 5.38 | 86 |
| Isernia | 2.58 | 92 | 1.29 | 76 | 3.41 | 40 | 3.72 | 88 | 7.67 | 58 | 1.88 | 69 | 17.74 | 5.76 | 84 |
| La Spezia | 4.28 | 69 | 2.46 | 35 | 3 | 54 | 5 | 57 | 7.03 | 70 | 2.26 | 57 | 11.59 | 7.08 | 58 |
| L’Aquila | 2.32 | 97 | 1.77 | 55 | 2.53 | 69 | 6.16 | 30 | 8.87 | 15 | 2.89 | 35 | 27.22 | 7.35 | 49 |
| Latina | 2.31 | 98 | 1.45 | 66 | 4.22 | 22 | 5.12 | 55 | 6.8 | 75 | 0.59 | 107 | 28.05 | 6.08 | 76 |
| Lecce | 4.24 | 71 | 1.41 | 68 | 2.89 | 57 | 5.09 | 56 | 8.05 | 41 | 2.84 | 39 | 12.12 | 7.2 | 54 |
| Lecco | 5.11 | 48 | 1.36 | 74 | 1.06 | 99 | 6.67 | 24 | 8.4 | 28 | 1.13 | 96 | 30.18 | 6.87 | 61 |
| Livorno | 3.47 | 79 | 1.64 | 61 | 3.43 | 38 | 4.29 | 75 | 6.45 | 82 | 1.55 | 78 | 15.33 | 6.01 | 80 |
| Lodi | 7.1 | 19 | 2.54 | 33 | 4.92 | 11 | 9.15 | 2 | 8.93 | 14 | 2.86 | 38 | 12.47 | 11.51 | 13 |
| Lucca | 5.78 | 38 | 1.84 | 52 | 2.38 | 75 | 5.46 | 45 | 7.35 | 63 | 2.94 | 34 | 14.23 | 7.63 | 46 |
| Macerata | 3.94 | 73 | 1.22 | 79 | 1.25 | 96 | 5.41 | 46 | 8.66 | 21 | 6.74 | 3 | 32.91 | 8.17 | 37 |
| Mantua | 8.1 | 10 | 6.29 | 7 | 3.23 | 49 | 6.53 | 26 | 8.39 | 29 | 6.22 | 4 | 15.70 | 12.1 | 8 |
| Massa | 2.76 | 88 | 1.06 | 87 | 2.68 | 65 | 3.8 | 87 | 5.34 | 95 | 1.01 | 98 | 10.56 | 4.59 | 94 |
| Matera | 10.73 | 1 | 0.56 | 106 | 2.79 | 64 | 3.67 | 89 | 7.12 | 68 | 1.52 | 79 | 32.94 | 7.33 | 50 |
| Messina | 1.67 | 106 | 1.28 | 77 | 2.53 | 69 | 2.02 | 103 | 4.97 | 98 | 2.36 | 54 | 19.21 | 3.81 | 101 |
| Milan | 8.87 | 3 | 10.33 | 2 | 4.35 | 19 | 10.8 | 1 | 9.33 | 8 | 1.39 | 86 | 30.21 | 14.56 | 2 |
| Modena | 6.09 | 30 | 3.79 | 17 | 4.11 | 26 | 6.97 | 19 | 8.29 | 32 | 2.72 | 44 | 8.96 | 9.96 | 22 |
| Monza | 8.71 | 6 | 2.1 | 44 | 5.05 | 9 | 8.33 | 7 | 9.16 | 9 | 0.55 | 108 | 37.12 | 10.64 | 19 |
| Naples | 7.4 | 16 | 2.08 | 45 | 4.5 | 17 | 3 | 93 | 3.66 | 108 | 1.68 | 74 | 35.57 | 6.49 | 67 |
| Novara | 5.79 | 37 | 1.75 | 57 | 3.77 | 35 | 5.39 | 47 | 6.86 | 73 | 1.75 | 73 | 15.43 | 7.59 | 47 |
| Nuoro | 3.25 | 82 | 1.01 | 90 | 0.88 | 102 | 3.55 | 91 | 5.56 | 91 | 2.78 | 41 | 19.59 | 4.55 | 95 |
| Oristano | 4.54 | 60 | 0.68 | 100 | 0.6 | 107 | 4.05 | 83 | 4.07 | 105 | 1.84 | 70 | 17.91 | 4.25 | 96 |
| Padua | 8.3 | 7 | 6.75 | 5 | 6.1 | 6 | 8.98 | 3 | 9.77 | 5 | 4.32 | 18 | 4.92 | 14.35 | 3 |
| Palermo | 4.63 | 55 | 1.68 | 59 | 4.17 | 24 | 2.27 | 99 | 3.98 | 107 | 1.14 | 95 | 29.54 | 4.92 | 91 |
| Parma | 6.25 | 27 | 4 | 14 | 4.08 | 28 | 7.34 | 15 | 8.71 | 18 | 4.26 | 19 | 5.46 | 10.94 | 17 |
| Pavia | 7.16 | 18 | 3.22 | 22 | 3.39 | 41 | 7.37 | 14 | 9.83 | 3 | 6.76 | 2 | 13.11 | 11.91 | 11 |
| Perugia | 4.69 | 54 | 1.44 | 67 | 2.9 | 56 | 5.32 | 48 | 8.75 | 16 | 6.06 | 5 | 22.51 | 8.87 | 32 |
| Pesaro | 5.08 | 50 | 2.24 | 40 | 2.87 | 58 | 5.54 | 43 | 7.87 | 46 | 3.41 | 30 | 8.64 | 8.1 | 38 |
| Pescara | 6.08 | 31 | 2.4 | 36 | 3.98 | 29 | 5.14 | 54 | 8.58 | 24 | 0.98 | 99 | 25.72 | 7.94 | 40 |
| Piacenza | 6.04 | 33 | 3.18 | 23 | 3.29 | 46 | 6.29 | 28 | 7.99 | 42 | 2.88 | 36 | 7.82 | 9.05 | 30 |
| Pisa | 4.55 | 59 | 2.35 | 37 | 6.16 | 4 | 8.49 | 5 | 8.68 | 19 | 5.87 | 7 | 20.17 | 12.02 | 10 |
| Pistoia | 2.75 | 89 | 0.63 | 103 | 2.43 | 73 | 4.67 | 64 | 6.61 | 77 | 3.49 | 27 | 23.68 | 6.04 | 79 |
| Pordenone | 8.25 | 8 | 3.25 | 21 | 2.04 | 84 | 6.27 | 29 | 8.97 | 13 | 2.73 | 43 | 25.45 | 9.34 | 28 |
| Potenza | 4.51 | 61 | 0.6 | 105 | 2.55 | 68 | 4.38 | 71 | 7.95 | 43 | 1.76 | 72 | 18.46 | 6.08 | 76 |
| Prato | 6.55 | 23 | 1.95 | 50 | 3.26 | 48 | 5.31 | 50 | 5.38 | 94 | 1.23 | 92 | 25.47 | 7.07 | 59 |
| Ragusa | 1.62 | 107 | 0.87 | 93 | 2.86 | 59 | 3 | 93 | 5.65 | 90 | 0.78 | 105 | 15.73 | 3.85 | 100 |
| Ravenna | 4.47 | 64 | 1.6 | 64 | 1.97 | 86 | 4.71 | 62 | 7.71 | 55 | 3.34 | 31 | 16.21 | 6.86 | 62 |
| Reggio Calabria | 3.22 | 83 | 0.72 | 99 | 1.73 | 88 | 1.65 | 108 | 7.71 | 55 | 0.96 | 101 | 17.31 | 3.65 | 103 |
| Reggio Emilia | 6.27 | 26 | 3.71 | 19 | 3.93 | 31 | 6.1 | 32 | 7.36 | 62 | 1.41 | 85 | 23.29 | 8.75 | 33 |
| Rieti | 2.25 | 100 | 2.18 | 41 | 2.03 | 85 | 4.94 | 59 | 7.94 | 44 | 1.45 | 84 | 22.18 | 5.86 | 82 |
| Rimini | 6.62 | 22 | 3.13 | 26 | 3.21 | 50 | 4.95 | 58 | 8.32 | 31 | 0.95 | 102 | 27.29 | 7.82 | 44 |
| Rome | 4.96 | 52 | 4.14 | 11 | 6.75 | 2 | 8.13 | 9 | 8.41 | 27 | 1.67 | 75 | 26.14 | 11.08 | 15 |
| Rovigo | 5.43 | 43 | 2.75 | 31 | 3.39 | 41 | 5.19 | 53 | 7.82 | 48 | 2.14 | 61 | 9.46 | 7.9 | 41 |
| Salerno | 6.34 | 25 | 1 | 91 | 3.13 | 53 | 4.22 | 78 | 8.17 | 34 | 1.35 | 88 | 25.84 | 6.8 | 64 |
| Sassari | 2.85 | 87 | 1.15 | 82 | 1.48 | 91 | 3.29 | 92 | 5.06 | 97 | 3.69 | 25 | 24.58 | 4.84 | 93 |
| Savona | 2.95 | 85 | 1.69 | 58 | 3.54 | 36 | 5.23 | 51 | 7.26 | 65 | 4.87 | 13 | 22.62 | 7.87 | 43 |
| Siena | 2.65 | 91 | 3.18 | 23 | 4.87 | 13 | 8.8 | 4 | 10.01 | 2 | 14.37 | 1 | 31.64 | 14.93 | 1 |
| Syracuse | 2.34 | 96 | 0.66 | 101 | 2.99 | 55 | 2.25 | 100 | 4.91 | 99 | 2.12 | 62 | 19.26 | 4.02 | 98 |
| Sondrio | 7.23 | 17 | 2.77 | 29 | 2.2 | 79 | 7.09 | 16 | 8.68 | 19 | 3.49 | 27 | 21.94 | 9.6 | 27 |
| Taranto | 2.09 | 102 | 1.95 | 50 | 2.66 | 66 | 1.96 | 104 | 5.25 | 96 | 0.39 | 111 | 22.26 | 3.47 | 106 |
| Teramo | 3.26 | 81 | 1.02 | 89 | 0.84 | 103 | 4.21 | 80 | 7.71 | 55 | 1.99 | 66 | 15.42 | 5.07 | 89 |
| Terni | 7.69 | 15 | 2.14 | 43 | 2.64 | 67 | 3.97 | 84 | 7.92 | 45 | 1.36 | 87 | 25.27 | 7.15 | 55 |
| Turin | 8.87 | 3 | 7.08 | 3 | 6.93 | 1 | 8.09 | 10 | 7.22 | 66 | 1.83 | 71 | 30.45 | 12.97 | 5 |
| Trani | 2.07 | 103 | 1.63 | 62 | 3.53 | 37 | 1.73 | 105 | 4.16 | 104 | 1.26 | 90 | 25.59 | 3.71 | 102 |
| Trapani | 1.1 | 111 | 1.1 | 86 | 0.52 | 109 | 1.73 | 105 | 4.3 | 103 | 0.88 | 103 | 8.09 | 1.86 | 111 |
| Trento | 8.81 | 5 | 2.8 | 28 | 4.96 | 10 | 8.05 | 11 | 9.8 | 4 | 3.82 | 23 | 8.96 | 12.12 | 7 |
| Treviso | 9.01 | 2 | 4 | 14 | 3.96 | 30 | 7 | 18 | 9.55 | 6 | 2.36 | 54 | 17.38 | 10.97 | 16 |
| Trieste | 4.07 | 72 | 4.04 | 12 | 4.69 | 15 | 5.96 | 35 | 8.16 | 35 | 5.71 | 9 | 21.62 | 10.32 | 20 |
| Udine | 6 | 34 | 3.11 | 27 | 4.34 | 20 | 6.73 | 22 | 9.05 | 10 | 2.23 | 59 | 15.38 | 9.69 | 25 |
| Varese | 5.86 | 36 | 1.79 | 54 | 3.78 | 34 | 6.3 | 27 | 8.24 | 33 | 1.46 | 83 | 19.12 | 8.29 | 35 |
| Venice | 6.87 | 21 | 13.66 | 1 | 3.42 | 39 | 5.88 | 38 | 7.28 | 64 | 4.94 | 12 | 20.59 | 13.03 | 4 |
| Verbania | 5.38 | 44 | 5.39 | 9 | 1 | 100 | 4.35 | 74 | 6.51 | 81 | 1.18 | 94 | 31.51 | 6.59 | 66 |
| Vercelli | 6.36 | 24 | 1.52 | 65 | 0.72 | 104 | 4.53 | 68 | 6.57 | 78 | 2.51 | 48 | 24.72 | 6.17 | 74 |
| Verona | 6.16 | 28 | 2.64 | 32 | 4.92 | 11 | 7.02 | 17 | 8.63 | 22 | 1.95 | 68 | 18.46 | 9.77 | 24 |
| Vibo Valentia | 2.73 | 90 | 0.33 | 112 | 3.18 | 51 | 2.11 | 102 | 6.22 | 86 | 1.31 | 89 | 18.93 | 4.03 | 97 |
| Vicenza | 8.25 | 8 | 3.41 | 20 | 3.93 | 31 | 6.63 | 25 | 8.63 | 22 | 2.62 | 46 | 11.54 | 10.26 | 21 |
| Viterbo | 2.56 | 93 | 0.75 | 97 | 2.07 | 83 | 4.38 | 71 | 7.78 | 50 | 4.41 | 17 | 27.76 | 6.35 | 70 |
Table A2.
Appendix: average of the municipalities’ ranks for each Region. Source: Our elaboration.
| Regions | Environment | Mobility | Technology | Economy | Education | Culture | SSCI |
|---|---|---|---|---|---|---|---|
| Abruzzo | 69 | 52.5 | 74.75 | 61.25 | 32.75 | 66.25 | 63.25 |
| Basilicata | 31 | 105.5 | 66 | 80 | 55.5 | 75.5 | 63 |
| Calabria | 85.6 | 85.8 | 55.8 | 99 | 80.4 | 80.6 | 68.8 |
| Campania | 38.4 | 68 | 63 | 82 | 51.4 | 65.4 | 90.4 |
| Emilia Romagna | 38.78 | 27.67 | 46.78 | 35.44 | 39.33 | 51.11 | 35.78 |
| Friuli Venezia Giulia | 37.25 | 35 | 56.5 | 40.5 | 26.5 | 30.25 | 31.25 |
| Lazio | 74.4 | 56.6 | 54.8 | 50.8 | 52.6 | 77.4 | 62.8 |
| Liguria | 81 | 59.75 | 53.25 | 51 | 64.75 | 33 | 55.75 |
| Lombardy | 17.25 | 28.08 | 40.83 | 18.75 | 21.92 | 52.33 | 21.58 |
| Marche | 73.6 | 67.6 | 68.6 | 48 | 35.4 | 18.8 | 45.2 |
| Molise | 98.5 | 80 | 65 | 76.5 | 35 | 64.5 | 84.5 |
| Piedmont | 30.75 | 52.25 | 72.38 | 52 | 76 | 63.13 | 54.88 |
| Puglia | 87.88 | 72.63 | 49.5 | 89 | 93.25 | 90.38 | 87.88 |
| Sardinia | 67.83 | 77.5 | 85.83 | 82 | 99 | 35.67 | 83.33 |
| Sicily | 100 | 91.11 | 62.78 | 98.67 | 98.22 | 78.78 | 100.11 |
| Tuscany | 65.67 | 58.5 | 52.67 | 46.83 | 60.33 | 51.5 | 54.25 |
| Trentino Alto Adige | 31.5 | 22 | 16.5 | 11.5 | 25.5 | 35 | 15 |
| Umbria | 34.5 | 55 | 61.5 | 66 | 30.5 | 46 | 43.5 |
| Aosta Valley | 51 | 88 | 101 | 34 | 76 | 15 | 51 |
| Veneto | 24.86 | 21.71 | 35.71 | 26.71 | 25.43 | 40.14 | 21.57 |
Table A3.
Appendix: municipalities divided into classes. Source: Our elaboration.
| Municipalities | Classes | Classes Concentration |
|---|---|---|
| Siena, Milan, Padua, Venice, Turin, Bologna, Trento, Mantua, Florence, Pisa, Pavia, Bergamo, Lodi, Brescia, Rome, Treviso, Parma, Cagliari, Monza, Trieste, Vicenza, Modena | 5 | 19.64% |
| Bolzano/Bozen, Verona, Udine, Cremona, Sondrio, Pordenone, Ancona, Piacenza, Como, Perugia, Reggio Emilia, Ferrara, Varese, Genoa, Macerata, Pesaro, Ascoli Piceno, Pescara, Rovigo, Belluno, Savona, Rimini, Cesena, Lucca, Novara, Cuneo | 4 | 23.21% |
| L’Aquila, Matera, Aosta, Bari, Gorizia, Lecce, Terni, Biella, Cosenza, La Spezia, Prato, Arezzo, Lecco, Ravenna, Forlì, Salerno, Asti, Verbania, Naples, Benevento, Brindisi, Viterbo, Frosinone, Avellino, Caserta, Vercelli, Chieti, Latina, Potenza, Alessandria, Pistoia, Livorno, Catania, Rieti, Fermo, Isernia | 3 | 32.14% |
| Campobasso, Imperia, Carrara, Catanzaro, Teramo, Iglesias, Palermo, Grosseto, Sassari, Massa, Nuoro, Oristano, Vibo Valentia, Syracuse, Foggia, Ragusa, Messina, Trani, Reggio Calabria, Enna, Agrigento, Taranto | 2 | 19.64% |
| Crotone, Carbonia, Barletta, Caltanissetta, Trapani, Andria | 1 | 5.36% |
References
- United Nations, Department of Economic and Social Affairs. Population Division (2019), World Population Prospects; United Nations: New York, NY, USA, 2019. [Google Scholar]
- Bibri, S.E. Transitioning from Smart Cities to Smarter Cities: The Future Potential of ICT of Pervasive Computing for Advancing Environmental Sustainability. In Smart Sustainable Cities of the Future; The Urban Book Series; Springer Science and Business Media LLC.: Berlin/Heidelberg, Germany, 2018; pp. 535–599. [Google Scholar]
- Nam, T.; Pardo, T.A. Conceptualizing smart city with dimensions of technology, people, and institutions. In Proceedings of the 12th Annual International Digital Government Research Conference on Digital Government Innovation in Challenging Times—dg.o ’11, College Park, MD, USA, 12–15 June 2011; Association for Computing Machinery (ACM): New York, NY, USA, 2011; pp. 282–291. [Google Scholar]
- Huovila, A.; Bosch, P.; Airaksinen, M. Comparative analysis of standardized indicators for Smart sustainable cities: What indicators and standards to use and when? Cities 2019, 89, 141–153. [Google Scholar] [CrossRef]
- Purnomo, F.; Prabowo, H.M. Smart City Indicators: A Systematic Literature Review. J. Telecommun. Electr. Comput. Eng. 2016, 8, 161–164. [Google Scholar]
- Baig, Z.; Szewczyk, P.; Valli, C.; Rabadia, P.; Hannay, P.; Chernyshev, M.; Johnstone, M.; Kerai, P.; Ibrahim, A.; Sansurooah, K.; et al. Future challenges for smart cities: Cyber-security and digital forensics. Digit. Investig. 2017, 22, 3–13. [Google Scholar] [CrossRef]
- Naya, F.; Sawada, H. From multidimensional mixture data analysis to spatio-temporal multidimensional collective data analysis. NTT Tech. Rev. 2016, 14. Available online: https://www.ntt-review.jp/archive/ntttechnical.php?contents=ntr201602fa2.html (accessed on 10 November 2020).
- Ueda, N.; Naya, F. Spatio-temporal multidimensional collective data analysis for providing comfortable living anytime and anywhere. APSIPA Trans. Signal Inf. Process. 2018, 7, 4. [Google Scholar] [CrossRef] [Green Version]
- Bibri, S.E.; Krogstie, J. Smart sustainable cities of the future: An extensive interdisciplinary literature review. Sustain. Cities Soc. 2017, 31, 183–212. [Google Scholar] [CrossRef]
- United Nations World Urbanization Prospects. World Urbanization Prospects. The 2014 Revision. New York: Department of Economic and Social Affairs 2015. Available online: http://esa.un.org/unpd/wup/Publications/Files/WUP2014-Report.pdf (accessed on 22 January 2017).
- United Nations. 2018 Revision of World Urbanization Prospects; United Nations: New York, NY, USA, 2020. [Google Scholar]
- OECD Environmental Outlook to 2050. The Consequences of Inaction. OECD Publishing: Paris, France, 2012; Available online: http://www.naturvardsverket.se/upload/miljoarbete-i-samhallet/internationelltmiljoarbete/multilateralt/oecd/outolook-2050-oecd.pdf (accessed on 11 February 2017).
- Brock, K.; Ouden, E.D.; Van Der Klauw, K.; Podoynitsyna, K.; Langerak, F.F. Light the way for smart cities: Lessons from Philips Lighting. Technol. Forecast. Soc. Chang. 2019, 142, 194–209. [Google Scholar] [CrossRef]
- Komninos, N. The Age of Intelligent Cities: Smart Environments and Innovation-for-All Strategies, 1st ed.; Routledge: New York, NY, USA, 2015. [Google Scholar]
- Bulkeley, H.; Betsill, M. Rethinking Sustainable Cities: Multilevel Governance and the ’Urban’ Politics of Climate Change. Environ. Politics 2005, 14, 42–63. [Google Scholar] [CrossRef]
- World Commission on Environment and Development (WCED). Our Common Future (The Brundtland Report); Oxford University Press: Oxford, UK; New York, NY, USA, 1987. [Google Scholar]
- Bibri, S.E. The Shaping of Ambient Intelligence and the Internet of Things: Historico–Epistemic, Socio– Cultural, Politico–Institutional and Eco–Environmental Dimensions; Springer: Berlin/Heidelberg, Germany, 2015. [Google Scholar]
- Kennedy, C.; Cuddihy, J.; Engel-Yan, J. The changing metabolism of cities. J. Ind. Ecol. 2007, 11, 43–59. [Google Scholar] [CrossRef]
- Belli, L.; Cilfone, A.; Davoli, L.; Ferrari, G.; Adorni, P.; Di Nocera, F.; Dall’Olio, A.; Pellegrini, C.; Mordacci, M.; Bertolot-ti, E. IoT-Enabled Smart Sustainable Cities: Challenges and Approaches. Smart Cities 2020, 3, 52. [Google Scholar] [CrossRef]
- Dameri, R.P. Searching for Smart City definition: A comprehensive proposal. Int. J. Comput. Technol. 2013, 11, 2544–2551. [Google Scholar] [CrossRef]
- Toppeta, D. The Smart City Vision: How Innovation and ICT Can Build Smart, “Livable”, Sustainable Cities. The Innova-tion Knowledge Foundation. 2010. Available online: http://www.thinkinnovation.org/file/research/23/en/Toppeta_Report_005_2010.pdf (accessed on 10 November 2020).
- Yigitcanlar, T. Technology and the City: Systems, Applications and Implications; Routledge: New York, NY, USA, 2016. [Google Scholar]
- Marceau, J. Introduction: Innovation in the city and innovative cities. Innovation: Management. Policy Pract. 2008, 10, 136–145. [Google Scholar] [CrossRef]
- Ivaldi, E.; Ciacci, A. Measuring Level of Technological Infrastructure in Smart Cities: A Non-Compensatory Approach. In Strategic Outlook for Innovative Work Behaviours. Contributions to Management Science; Springer: Cham, Switzerland, 2020. [Google Scholar]
- Al-Hader, M.; Rodzi, A.; Sharif, A.R.; Ahmad, N. Smart city components architecture. In Proceedings of the International Conference on Computational Intelligence, Modelling and Simulation, Brno, Czech Republic, 7–9 September 2009. [Google Scholar]
- Al-Hader, M.; Rodzi, A.; Sharif, A.R.; Ahmad, N. SOA of Smart City Geospatial Management. In Proceedings of the 2009 Third UKSim European Symposium on Computer Modeling and Simulation, Athens, Greece, 25–27 November 2009; pp. 6–10. [Google Scholar]
- Caragliu, A.; Del Bo, C.; Nijkamp, P. Smart Cities in Europe. J. Urban Technol. 2011, 18, 65–82. [Google Scholar] [CrossRef]
- Giffinger, R.; Fertner, C.; Kramar, H.; Kalasek, R.; Pichler-Milanovic, N.; Meijers, E. Smart Cities: Ranking of European Medium-Sized Cities; Vienna University of Technology: Vienna, Austria, 2007. [Google Scholar]
- Washburn, D.; Sindhu, U.; Balaouras, S.; Dines, R.A.; Hayes, N.; Nelson, L.E. Helping CIOs understand “smart city” ini-tiatives. Growth 2009, 17, 1–17. [Google Scholar]
- Chourabi, H.; Nam, T.; Walker, S.; Gil-Garcia, J.R.; Mellouli, S.; Nahon, K.; Pardo, T.A.; Scholl, H.J. Understanding Smart Cities: An Integrative Framework. In Proceedings of the 2012 45th Hawaii International Conference on System Sciences, Maui, HI, USA, 4–7 January 2012; pp. 2289–2297. [Google Scholar]
- Neirotti, P.; De Marco, A.; Cagliano, A.C.; Mangano, G.; Scorrano, F. Current trends in smart city initiatives: Some styl-ised facts. Cities 2014, 38, 25–36. [Google Scholar] [CrossRef] [Green Version]
- Petrolo, R.; Loscrí, V.; Mitton, N. Towards a smart city based on cloud of things, a survey on the smart city vision and paradigms. Trans. Emerg. Telecommun. Technol. 2015, 28, e2931. [Google Scholar] [CrossRef] [Green Version]
- Bibri, S.E.; Krogstie, J. On the social shaping dimensions of smart sustainable cities: A study in science, technology, and society. Sustain. Cities Soc. 2017, 29, 219–246. [Google Scholar] [CrossRef] [Green Version]
- Bibri, S.E.; Krogstie, J. Big data analytics and context–aware computing for smart sustainable cities of the future. In Proceedings of the NOBIDS Conference, Trondheim, Norway, 15 November 2016. [Google Scholar]
- Lucendo-Monedero, A.L.; Ruiz-Rodríguez, F.; González-Relaño, R. Measuring the digital divide at regional level. A spatial analysis of the inequalities in digital development of households and individuals in Europe. Telemat. Inform. 2019, 41, 197–217. [Google Scholar] [CrossRef]
- Albino, V.; Dangelico, R.M. Green Cities into Practice. In The Economy of Green Cit-ies: A World Compendium on the Green Urban Economy; Simpson, R., Zimmermann, M., Eds.; Springer Science Business Media B.V.: Dordrecht, The Netherlands, 2012. [Google Scholar]
- Alawadhi, S.; Aldama-Nalda, A.; Chourabi, H.; Gil-Garcia, J.R.; Leung, S.; Mellouli, S.; Nam, T.; Pardo, T.A.; Scholl, H.J.; Walker, S. Building Understanding of Smart City Initiatives; Scholl, H.J., Janssen, M., Wimmer, M.A., Moe, C.E., Flak, L.S., Eds.; EGOV: Berlin/Heidelberg, Germany, 2012; pp. 40–53. [Google Scholar]
- Barrionuevo, J.M.; Berrone, P.; Costa, J.E.R. Smart Cities, Sustainable Progress: Opportunities for Urban Development. IESE Insight 2012, 14, 50–57. [Google Scholar] [CrossRef]
- Thuzar, M. Urbanization in Southeast Asia: Developing Smart Cities for the Future? Reg. Outlook 2011, 96–100. [Google Scholar] [CrossRef]
- Albino, V.; Berardi, U.; Dangelico, R.M. Smart Cities: Definitions, Dimensions, Performance, and Initiatives. J. Urban Technol. 2015, 22, 3–21. [Google Scholar] [CrossRef]
- Piccialli, F.; Chianese, A. Editorial for FGCS Special Issue: The Internet of Cultural Things: Towards a Smart Cultural Heritage; Elsevier: New York, NY, USA, 2008. [Google Scholar]
- Rutten, P. Cultural activities & creative industries. In A Driving Force for Urban Regeneration. Culture & Urban Regenera-tion; Finding & Conclusions on the Economic Perspective; Urbact Culture Network: Helsinki, Finland, 2006. [Google Scholar]
- Girard, L.; Nijkamp, P. Cultural Tourism and Sustainable Local Development; New Directions in Tourism Analysis; Taylor & Francis: Abingdon, UK, 2016. [Google Scholar]
- Allam, Z.; Ao, P.N. Redefining the Smart City: Culture, Metabolism and Governance. Smart Cities 2018, 1, 2. [Google Scholar] [CrossRef] [Green Version]
- Ruggedised European Project. Available online: https://ruggedised.eu/ (accessed on 10 July 2020).
- Romão, J.; Van Leeuwen, E.; Neuts, B.; Nijkamp, P. Tourist Loyalty and Urban E-Services: A Comparison of Behavioral Impacts in Leipzig and Amsterdam. J. Urban Technol. 2015, 22, 85–101. [Google Scholar] [CrossRef]
- Romao, J.; Neuts, B.; Nijkamp, P.; van Leeuwen, E. Culture, Product Differentiation and Market Segmentation: A Struc-tural Analysis of the Motivation and Satisfaction of Tourists in Amsterdam. Tour. Econ. 2015, 21, 455–474. [Google Scholar] [CrossRef]
- Angelidou, M.; Karachaliou, E.; Stylianidis, E. Cultural heritage in smart city environments. ISPRS Int. Arch. Photogramm. Remote. Sens. Spat. Inf. Sci. 2017, 42, 27–32. [Google Scholar] [CrossRef] [Green Version]
- Burlando, C.; Ivaldi, E.; Saiani, P.P.; Penco, L. To own or not to own? Car ownership and consumer awareness: Evidence from an Italian survey. Res. Transp. Bus. Manag. 2019, 33. [Google Scholar] [CrossRef]
- Golbabaei, F.; Yigitcanlar, T.; Bunker, J. The role of shared autonomous vehicle systems in delivering smart urban mobility: A systematic review of the literature. Int. J. Sustain. Transp. 2020, 1–18. [Google Scholar] [CrossRef]
- Benevolo, C.; Dameri, R.P.; D’Auria, B. Smart Mobility in Smart City. In Empowering Organizations; Torre, T., Braccini, A.M., Spinelli, R., Eds.; Springer International Publishing: Cham, Switzerland, 2016; pp. 13–28. [Google Scholar]
- Mechant, P.; Stevens, I.; Evens, T.; Verdegem, P. E-deliberation 2.0 for smart cities: A critical assessment of two ’idea generation’ cases. Int. J. Electron. Gov. 2012, 5, 82. [Google Scholar] [CrossRef]
- Zygiaris, S. Smart city reference model: Assisting planners to conceptualize the building of smart city innovation eco-systems. J. Knowl. Econ. 2013, 4, 217–231. [Google Scholar] [CrossRef]
- Lee, S.-H.; Yigitcanlar, T.; Han, J.-H.; Leem, Y.-T. Ubiquitous urban infrastructure: Infrastructure planning and development in Korea. Innovation 2008, 10, 282–292. [Google Scholar] [CrossRef] [Green Version]
- Jennings, P. Managing the risks of Smarter Planet solutions. IBM J. Res. Dev. 2010, 54, 1–9. [Google Scholar] [CrossRef]
- Singer, P.W.; Friedman, A. Cybersecurity and Cyberwar; Oxford University Press: Oxford, UK, 2014. [Google Scholar]
- Durbin, S. Building Smart City Security. TechCrunch, 12 September 2015. Available online: www.techcrunch.com/2015/09/12/building-smart-city-security (accessed on 12 November 2020).
- Hollands, R.G. Will the real smart city please stand up? Intelligent, progressive or entrepreneurial? City 2008, 12, 303–320. [Google Scholar] [CrossRef]
- Greenfield, A. Against the Smart City; Verso: London, UK, 2013. [Google Scholar]
- Marvin, S.; Luque-Ayala, A.; McFarlane, C. Smart Urbanism. Utopian Vision or False Dawn? Routledge: London, UK, 2015; ISBN 9781138844230. [Google Scholar]
- Hill, B. Fastest-50 list includes only three Ottawa firms. Ottawa Citizen, 26 September 2002; p. D1. [Google Scholar]
- Harvey, D. From managerialism to entrepreneurialism: The transformation in urban governance in late capitalism. Geogr. Ann. 1989, 71, 3–17. [Google Scholar] [CrossRef]
- Valdez, A.-M.; Wigley, E.; Zanetti, O.; Rose, G. Learning Lessons for Avoiding the Inadvertent Exclusion of Communities from Smart City Projects. In Shaping Smart for Better Cities; Aurigi, A., Odendaal, N., Eds.; Academic Press: Cambridge, MA, USA, 2021; pp. 221–237. ISBN 9780128186367. [Google Scholar]
- Florida, R. The Rise of the Creative Class: And How It’s Transforming Work, Leisure, Community and Everyday Life; Basic Books: New York, NY, USA, 2002. [Google Scholar]
- Calbimonte, J.-P.; Eberle, J.; Aberer, K. Toward Self-monitoring Smart Cities: The OpenSense2 Approach. Inform. Spektrum 2016, 40, 75–87. [Google Scholar] [CrossRef] [Green Version]
- Kitchin, R.; Dodge, M. The (In) Security of Smart Cities: Vulnerabilities, Risks, Mitigation, and Prevention. J. Urban Technol. 2019, 26, 47–65. [Google Scholar] [CrossRef] [Green Version]
- Garau, C.; Pavan, V.M. Evaluating Urban Quality: Indicators and Assessment Tools for Smart Sustainable Cities. Sustainability 2018, 10, 575. [Google Scholar] [CrossRef] [Green Version]
- Kaivonen, S.; Ngai, E.C.-H. Real-time air pollution monitoring with sensors on city bus. Digit. Commun. Netw. 2020, 6, 23–30. [Google Scholar] [CrossRef]
- Tanguay, G.A.; Rajaonson, J.; Lefebvre, J.-F.; Lanoie, P. Measuring the sustainability of cities: An analysis of the use of local indicators. Ecol. Indic. 2010, 10, 407–418. [Google Scholar] [CrossRef]
- Marsal-Llacuna, M.-L.; Colomer-Llinàs, J.; Meléndez-Frigola, J. Lessons in urban monitoring taken from sustainable and livable cities to better address the Smart Cities initiative. Technol. Forecast. Soc. Chang. 2015, 90, 611–622. [Google Scholar]
- Wołek, M.; Wolański, M.; Bartłomiejczyk, M.; Wyszomirski, O.; Grzelec, K.; Hebel, K. Ensuring sustainable development of urban public transport: A case study of the trolleybus system in Gdynia and Sopot (Poland). J. Clean. Prod. 2021, 279, 123807. [Google Scholar] [CrossRef]
- Mugion, R.G.; Toni, M.; Raharjo, H.; Di Pietro, L.; Sebathu, S.P. Does the service quality of urban public transport enhance sustainable mobility? J. Clean. Prod. 2018, 174, 1566–1587. [Google Scholar] [CrossRef]
- Anwar, M.; Fayyaz, A.; Sohail, N.; Khokhar, M.; Baqar, M.; Khan, W.-U.-D.; Rasool, K.; Rehan, M.; Nizami, A.-S. CO2 capture and storage: A way forward for sustainable environment. J. Environ. Manag. 2018, 226, 131–144. [Google Scholar] [CrossRef]
- Adamczyk, M.; Betlej, A.; Gondek, J.; Ohotina, A. Technology and sustainable development: Towards the future? Entrep. Sustain. Issues 2019, 6, 2003–2016. [Google Scholar] [CrossRef] [Green Version]
- Mazziotta, M.; Pareto, A. Synthesis of Indicators: The Composite Indicators Approach. In Complexity in Society: From Indicators Construction to their Synthesis; Maggino, F., Ed.; Springer: Cham, Switzerland, 2017; Volume 70, pp. 161–191. [Google Scholar]
- Maggino, F. Developing Indicators and Managing the Complexity. In Complexity in Society: From Indicators Construction to Their Synthesis; Social Indicators Research Series; Maggino, F., Ed.; Springer: Cham, Switzerland, 2017; Volume 70, pp. 87–114. [Google Scholar]
- Diamantopoulos, A.; Winklhofer, H. Index Construction with Formative Indicators: An Alternative to Scale Development. J. Mark. Res. 2001, 38, 269–277. [Google Scholar] [CrossRef]
- Diamantopoulos, A.; Riefler, P.; Roth, K.P. Advancing formative measurement models. J. Bus. Res. 2008, 61, 1203–1218. [Google Scholar] [CrossRef]
- Bruggemann, R.; Carlsen, L.; Wittmann, J. Multi-Indicator Systems and Modelling in Partial Order; Springer: New York, NY, USA, 2014. [Google Scholar]
- Fattore, M. Synthesis of Indicators: The Non-aggregative Approach. In Complexity in Society: From Indicators Construction to their Synthesis; Maggino, F., Ed.; Springer: Cham, Switzerland, 2017; pp. 193–212. [Google Scholar]
- Alaimo, L.S.; Ciacci, A.; Ivaldi, E. Measuring Sustainable Development by Non-aggregative Approach. Soc. Indic. Res. 2020, 1–22. [Google Scholar] [CrossRef]
- Ivaldi, E.; Ciacci, A.; Soliani, R. Urban deprivation in Argentina: A POSET analysis. Pap. Reg. Sci. 2020, 99, 1723–1747. [Google Scholar] [CrossRef]
- Ciacci, A.; Ivaldi, E.; Soliani, R. A potential business environment of a smart cities: A subjective approach in Strategic Out-look. In Business and Finance Innovation: Multidimensional Policies for Emerging Economies; Dinçer, H., Yüksel, S., Eds.; Emerald: Bingley, UK, 2020. [Google Scholar]
- Peña, J. Problemas de la Medición del Bienestar y Conceptos Afines (Una Aplicación al Caso Espanol) Presidencia del Go-bierno; Instituto Nacional de Estadística: Madrid, Spain, 1977. [Google Scholar]
- Arechavala, N.S.; Trapero, B.P. Synthetic Indicators of Quality of Life in Europe. Soc. Indic. Res. 2008, 94, 115–133. [Google Scholar] [CrossRef]
- Montero, J.-M.; Yrigoyen, C.C.; Larraz, B. Building an environmental quality index for a big city: A spatial interpolation approach combined with a distance indicator. J. Geogr. Syst. 2010, 12, 435–459. [Google Scholar] [CrossRef] [Green Version]
- Martín, J.A.R.; Fernández, J.A.S. An index of maternal and child health in the least developed countries of Asia. Gac. Sanit. 2012, 26, 190–192. [Google Scholar] [CrossRef] [Green Version]
- Bruzzi, C.; Ivaldi, E.; Musso, E.; Penco, L. The Role of Knowledge City Features in Nurturing Entrepreneurship: Evidence from EU Cities. In Urban Studies and Entrepreneurship; The Urban Book Series; Springer: Cham, Switzerland, 2019; pp. 53–76. [Google Scholar]
- Ciacci, A.; Tagliafico, G. Measuring the existence of a link between crime and social deprivation within a metropolitan area. Rev. Estud. Andal. 2020, 40, 58–77. [Google Scholar] [CrossRef]
- Penco, L.; Ivaldi, E.; Bruzzi, C.; Musso, E. Knowledge-based urban environments and entrepreneurship: Inside EU cities. Cities 2020, 96, 102443. [Google Scholar] [CrossRef]
- MacQueen, J. Some methods for classification and analysis of multivariate observations. In Proceedings of the Fifth Berkeley Symposium on Mathematical Statistics and Probability, 1st ed.; Le Cam, L., Neyman, J., Eds.; University of California Press: Berkeley, CA, USA, 1967; Volume 1, pp. 281–297. [Google Scholar]
- Hartigan, J.A.; Wong, M.A. Algorithm AS 136: A K-Means Clustering Algorithm. J. R. Stat. Soc. Ser. C Appl. Stat. 1979, 28, 100. [Google Scholar] [CrossRef]
- Berkhin, P. A survey of clustering data mining techniques. In Grouping Multidimen-Sional Data; Kogan, J.N., Teboulle, M., Eds.; Springer: Berlin/Heidelberg, Germany, 2006; pp. 25–71. [Google Scholar]
- Pérez-Luque, A.J.; Moreno, R.; Pérez-Pérez, R.; Bonet, F.J. p2distance: Well-Being’s Synthetic Indicator; R Package Version 1.0.1. 2012. Available online: https://cran.r-project.org/web/packages/p2distance/p2distance.pdf (accessed on 4 January 2021).
- Ferraro, M.B.; Giordani, P.; Serafini, A. Fclust: An R Package for Fuzzy Clustering. R J. 2019, 11, 1–18. [Google Scholar] [CrossRef]
- Smart City & Utilities Siena. 2017. Available online: https://www.comune.siena.it/index.php/Il-Comune/Struttura/Finestra-sul-Comune/Siena-Smart-City-via-al-progetto (accessed on 15 November 2020).
- FPA, Digital 360. ICity Rank Rapporto Annuale 2019. Available online: https://d110erj175o600.cloudfront.net/wp-content/uploads/2019/11/I-City-Rank-2019.pdf (accessed on 15 November 2020).
- EU-GUGLE. European Cities Serving as Green Urban Gate towards Leadership in Sustainable Energy. 2013. Available online: https://smartcities-infosystem.eu/sites-projects/projects/eu-gugle (accessed on 15 November 2020).
- Sharing Cities. 2016. Available online: https://smartcities-infosystem.eu/sites-projects/projects/sharing-cities (accessed on 15 November 2020).
- Weiss, C.H. New Approaches to Evaluating Community Initiatives: Concepts, Methods and Contexts. In Nothing as Practical as Good Theory: Exploring Theory-Based Evalua-tion for Comprehensive Community-Based Initiatives for Children and Families; Connell, J.P., Kubisch, A.C., Schorr, L.B., Weiss, C.H., Eds.; Aspen Institute: Washington, DC, USA, 1995; pp. 65–92. [Google Scholar]
- James, C. Theory of Change Review. In 2011 A Report Commissioned by Comic Relief; Comic Relief: London, UK, 2011. [Google Scholar]
- Stein, D.; Valters, C. Understanding Theory of Change in International Development; The Justice and Security Re-search Programme (JSRP): London, UK, 2012. [Google Scholar]
- Allen, W. Diagramming a Theory of Change. Learning for Sustainability (LfS). 2016. Available online: http://learningforsustainability.net/post/diagramming-theory-change/ (accessed on 15 November 2020).
- Vogel, I. ESPA Guide to Working with Theory of Change for Research Projects; The Ecosystem Services for Poverty Alleviation (ESPA) Programme: Scotland, UK, 2012. [Google Scholar]
- Ibrahim, M.; El-Zaart, A.; Adams, C. Paving the Way to Smart Sustainable Cities: Transformation Models and Challeng-es. J. Inf. Syst. Technol. Manag. 2015, 12, 559–576. [Google Scholar] [CrossRef] [Green Version]
- Ibrahim, M.; El-Zaart, A.; Adams, C. Smart sustainable cities roadmap: Readiness for transformation towards urban sustainability. Sustain. Cities Soc. 2018, 37, 530–540. [Google Scholar] [CrossRef] [Green Version]
- Stachowiak, S. Pathways for Change: 10 Theories to Inform Advocacy and Policy Change Efforts. Center for Evaluation Innovation; ORS Impact (Organizational Research Services): Washington, DC, USA, 2013. [Google Scholar]
- Laing, K.; Todd, L. (Eds.) Theory-based Methodology: Using Theories of Change for Development, Research and Evaluation; Research Centre for Learning and Teaching, Newcastle University: Newcastle, UK, 2015. [Google Scholar]
- Musolino, D. The North-South Divide in Italy: Reality or Perception? Eur. Spat. Res. Policy 2018, 25, 29–53. [Google Scholar] [CrossRef] [Green Version]
- Bianchi, L.; Petraglia, C.; Vecchione, G. Europe-Italy, North-South: The Double Gap; Rivista economica del Mezzogiorno, Società editrice il Mulino: Bologna, Italy, 2019; pp. 673–687. [Google Scholar]
- Alferi, P.; Favazzo, A. Expo e la città. Il nuovo passo di Milano. In Milano Produttiva 2016; 26° Rapporto della Camera di Commercio di Milano; Camera di Commercio: Milano, Italy, 2016. [Google Scholar]
- Avola, M.; Gherardini, A.; Nisticò, R. Il sistema produttivo dell’elettronica di Catania. QA Riv. dell’Associazione Ross. 2013, 1, 143–167. [Google Scholar] [CrossRef]
- Mueller, P.; Van Stel, A.; Storey, D.J. The effects of new firm formation on regional development over time: The case of Great Britain. Small Bus. Econ. 2008, 30, 59–71. [Google Scholar] [CrossRef] [Green Version]
- Kremer, H.; Villamor, I.; Aguinis, H. Innovation leadership: Best-practice recommendations for promoting employee creativity, voice, and knowledge sharing. Bus. Horizons 2019, 62, 65–74. [Google Scholar] [CrossRef]
- Allmendinger, P.; Haughton, G. Soft Spaces, Fuzzy Boundaries, and Metagovernance: The New Spatial Planning in the Thames Gateway. Environ. Plan. A Econ. Space 2009, 41, 617–633. [Google Scholar] [CrossRef] [Green Version]
- Allmendinger, P.; Haughton, G.; Knieling, J.; Othengrafen, F. Soft spaces, planning and emerging practices of territo-rial governance. In Soft Spaces in Europe: Re-Negotiating Governance, Boundaries and Borders; Allmendinger, P., Haughton, G., Knieling, J., Othengrafen, F., Eds.; Routledge: Abingdon, VI, USA, 2015; pp. 3–22. [Google Scholar]
- Caesar, B. European Groupings of Territorial Cooperation: A means to harden spatially dispersed cooperation? Reg. Stud. Reg. Sci. 2017, 4, 247–254. [Google Scholar] [CrossRef] [Green Version]
- Akande, A.; Cabral, P.; Gomes, P.; Casteleyn, S. The Lisbon ranking for smart sustainable cities in Europe. Sustain. Cities Soc. 2019, 44, 475–487. [Google Scholar] [CrossRef]
- Kogut-Jaworska, M.; Ociepa-Kicińska, E. Smart Specialisation as a Strategy for Implementing the Regional Innovation Development Policy—Poland Case Study. Sustainabliaty 2020, 12, 7986. [Google Scholar] [CrossRef]
- Desdemoustier, J.; Crutzen, N.; Giffinger, R. Municipalities’ understanding of the Smart City concept: An exploratory analysis in Belgium. Technol. Forecast. Soc. Chang. 2019, 142, 129–141. [Google Scholar] [CrossRef]
- Machado, C.; Ribeiro, D.M.N.M.; Da Silva-Pereira, R.; Bazanini, R. Do Brazilian cities want to become smart or sustainable? J. Clean. Prod. 2018, 199, 214–221. [Google Scholar] [CrossRef]
- Ivaldi, E.; Penco, L.; Isola, G.; Musso, E. Smart Sustainable Cities and the Urban Knowledge-Based Economy: A NUTS3 Level Analysis. Soc. Indic. Res. 2020, 150, 45–72. [Google Scholar] [CrossRef]
- Stiglitz, J.E.; Sen, A.; Fitoussi, J.-P. Report by the commission on the measurement of economic performance and so-cial progress, Paris. 2009. Available online: http://www.stiglitz-sen-fitoussi.fr/en/index.htm (accessed on 16 November 2020).
- Sharpe, A.; Salzman, J. Methodological Choices Encountered in the Construction of Composite Indices of Economic and Social Well-Being; Center for the Study of Living Standards: Ottawa, ON, Canada, 2004. [Google Scholar]
- Penco, L. The Development of the Successful City in the Knowledge Economy: Toward the Dual Role of Consumer Hub and Knowledge Hub. J. Knowl. Econ. 2013, 6, 818–837. [Google Scholar] [CrossRef]
- Yigitcanlar, T.; Lee, S.H. Korean ubiquitous-eco-city: A smart-sustainable urban form or a branding hoax? Technol. Forecast. Soc. Chang. 2014, 89, 100–114. [Google Scholar] [CrossRef] [Green Version]
- Hashem, I.A.T.; Chang, V.; Anuar, N.B.; Adewole, K.; Yaqoob, I.; Gani, A.; Ahmed, E.; Chiroma, H. The role of big data in smart city. Int. J. Inf. Manag. 2016, 36, 748–758. [Google Scholar] [CrossRef] [Green Version]
Figure 1.
Pearson’s correlation matrix between single SSCI dimensions and aggregated SSCI. Source: Our elaboration.
Figure 1.
Pearson’s correlation matrix between single SSCI dimensions and aggregated SSCI. Source: Our elaboration.

Figure 2.
Results of the cluster analysis of Italian municipalities. Source: Our elaboration.

Table 1.
Selected indicators for each dimension and their characteristics.
| Dimensions | Indicators | Units of Measure | Polarity | Year |
|---|---|---|---|---|
| Environment | Soil consumption | Percentage over total area | NEG | 2017 |
| Urban greenery | Square meter per inhabitant | POS | 2015 | |
| Urban air quality | Number of daily limit value exceedances (PM10) | NEG | 2016 | |
| Urban waste | Percentage of collected urban waste | POS | 2017 | |
| Mobility | Pedestrian areas | Square meter for 100 residents | POS | 2015 |
| Cycle paths | Km of paths per 100 square km of municipal area | POS | 2016 | |
| Local public transport | Places km per inhabitant | POS | 2016 | |
| Technology | Ultra-Broadband | 30 Mb (per 100 units) | POS | 2016 |
| High technology | Employees in high technology sectors per 100 employees in local units | POS | 2015 | |
| Economy | Gross income per capita | Euro | POS | 2015 |
| Entrepreneurship rate | Companies for 1000 residents | POS | 2015 | |
| Employed | Percentage of employees between registered 20–64 year olds in October | POS | 2015 | |
| Education | Hold degree | 30–34 graduated enrolled in the registry office | POS | 2015 |
| Graduated | 25–64 graduated enrolled in the registry office | POS | 2015 | |
| Numerical competence | Score obtained in the INVALSI numerical proficiency tests of students in secondary school | POS | 2017 | |
| Culture | Museums, galleries, archaeological sites and monuments | Number of museums, galleries, archaeological sites and monuments per 100,000 inhabitants | POS | 2015 |
| Cultural heritage resources | Number of cultural assets per 10,000 inhabitants | POS | 2017 | |
| Libraries | Libraries for 100,000 inhabitants | POS | 2017 |
POS = positive; NEG = negative; INVALSI = National Institute for the Evaluation of the Educational System of Education and Training.
Publisher’s Note: MDPI stays neutral with regard to jurisdictional claims in published maps and institutional affiliations. |
© 2021 by the authors. Licensee MDPI, Basel, Switzerland. This article is an open access article distributed under the terms and conditions of the Creative Commons Attribution (CC BY) license (http://creativecommons.org/licenses/by/4.0/).
Share and Cite
MDPI and ACS Style
Ciacci, A.; Ivaldi, E.; González-Relaño, R. A Partially Non-Compensatory Method to Measure the Smart and Sustainable Level of Italian Municipalities. Sustainability 2021, 13, 435. https://doi.org/10.3390/su13010435
AMA Style
Ciacci A, Ivaldi E, González-Relaño R. A Partially Non-Compensatory Method to Measure the Smart and Sustainable Level of Italian Municipalities. Sustainability. 2021; 13(1):435. https://doi.org/10.3390/su13010435
Chicago/Turabian StyleCiacci, Andrea, Enrico Ivaldi, and Reyes González-Relaño. 2021. "A Partially Non-Compensatory Method to Measure the Smart and Sustainable Level of Italian Municipalities" Sustainability 13, no. 1: 435. https://doi.org/10.3390/su13010435
Note that from the first issue of 2016, this journal uses article numbers instead of page numbers. See further details here.