
Missed Cystic Fibrosis Newborn Screening Cases due to Immunoreactive Trypsinogen Levels below Program Cutoffs: A National Survey of Risk Factors

 , , , ,
  , add
Show full author list
, add
Show full author list
Abstract
:1. Introduction
2. Materials and Methods
3. Results
3.1. Program Recruitment
3.2. Study Subjects
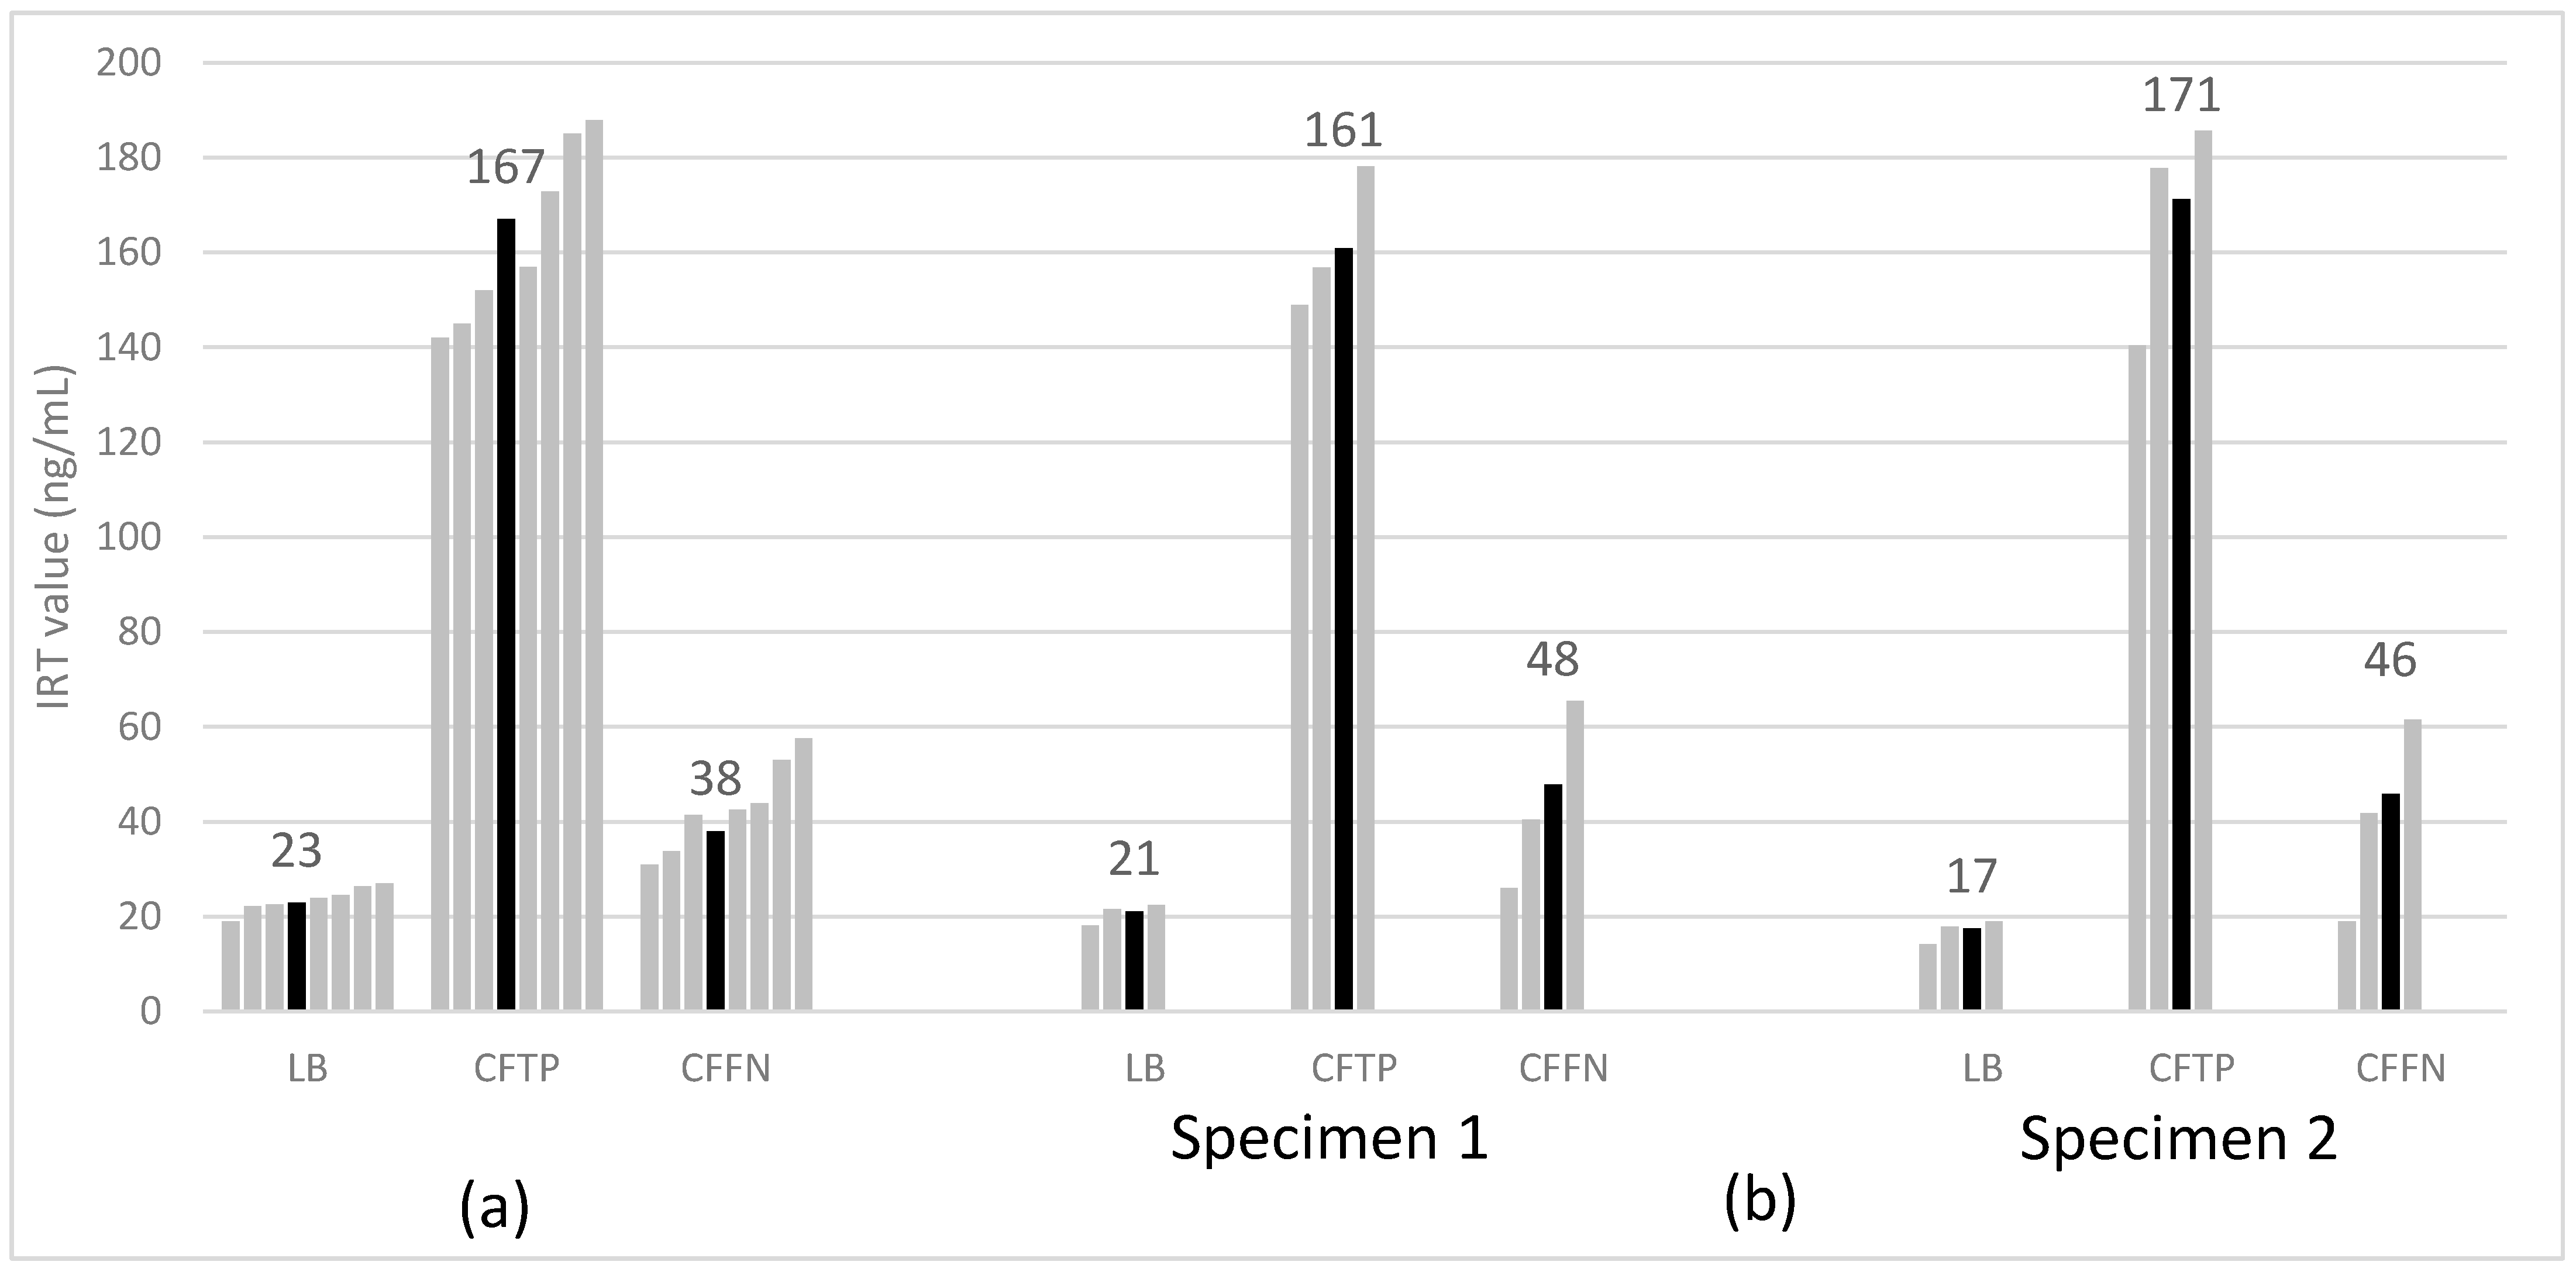
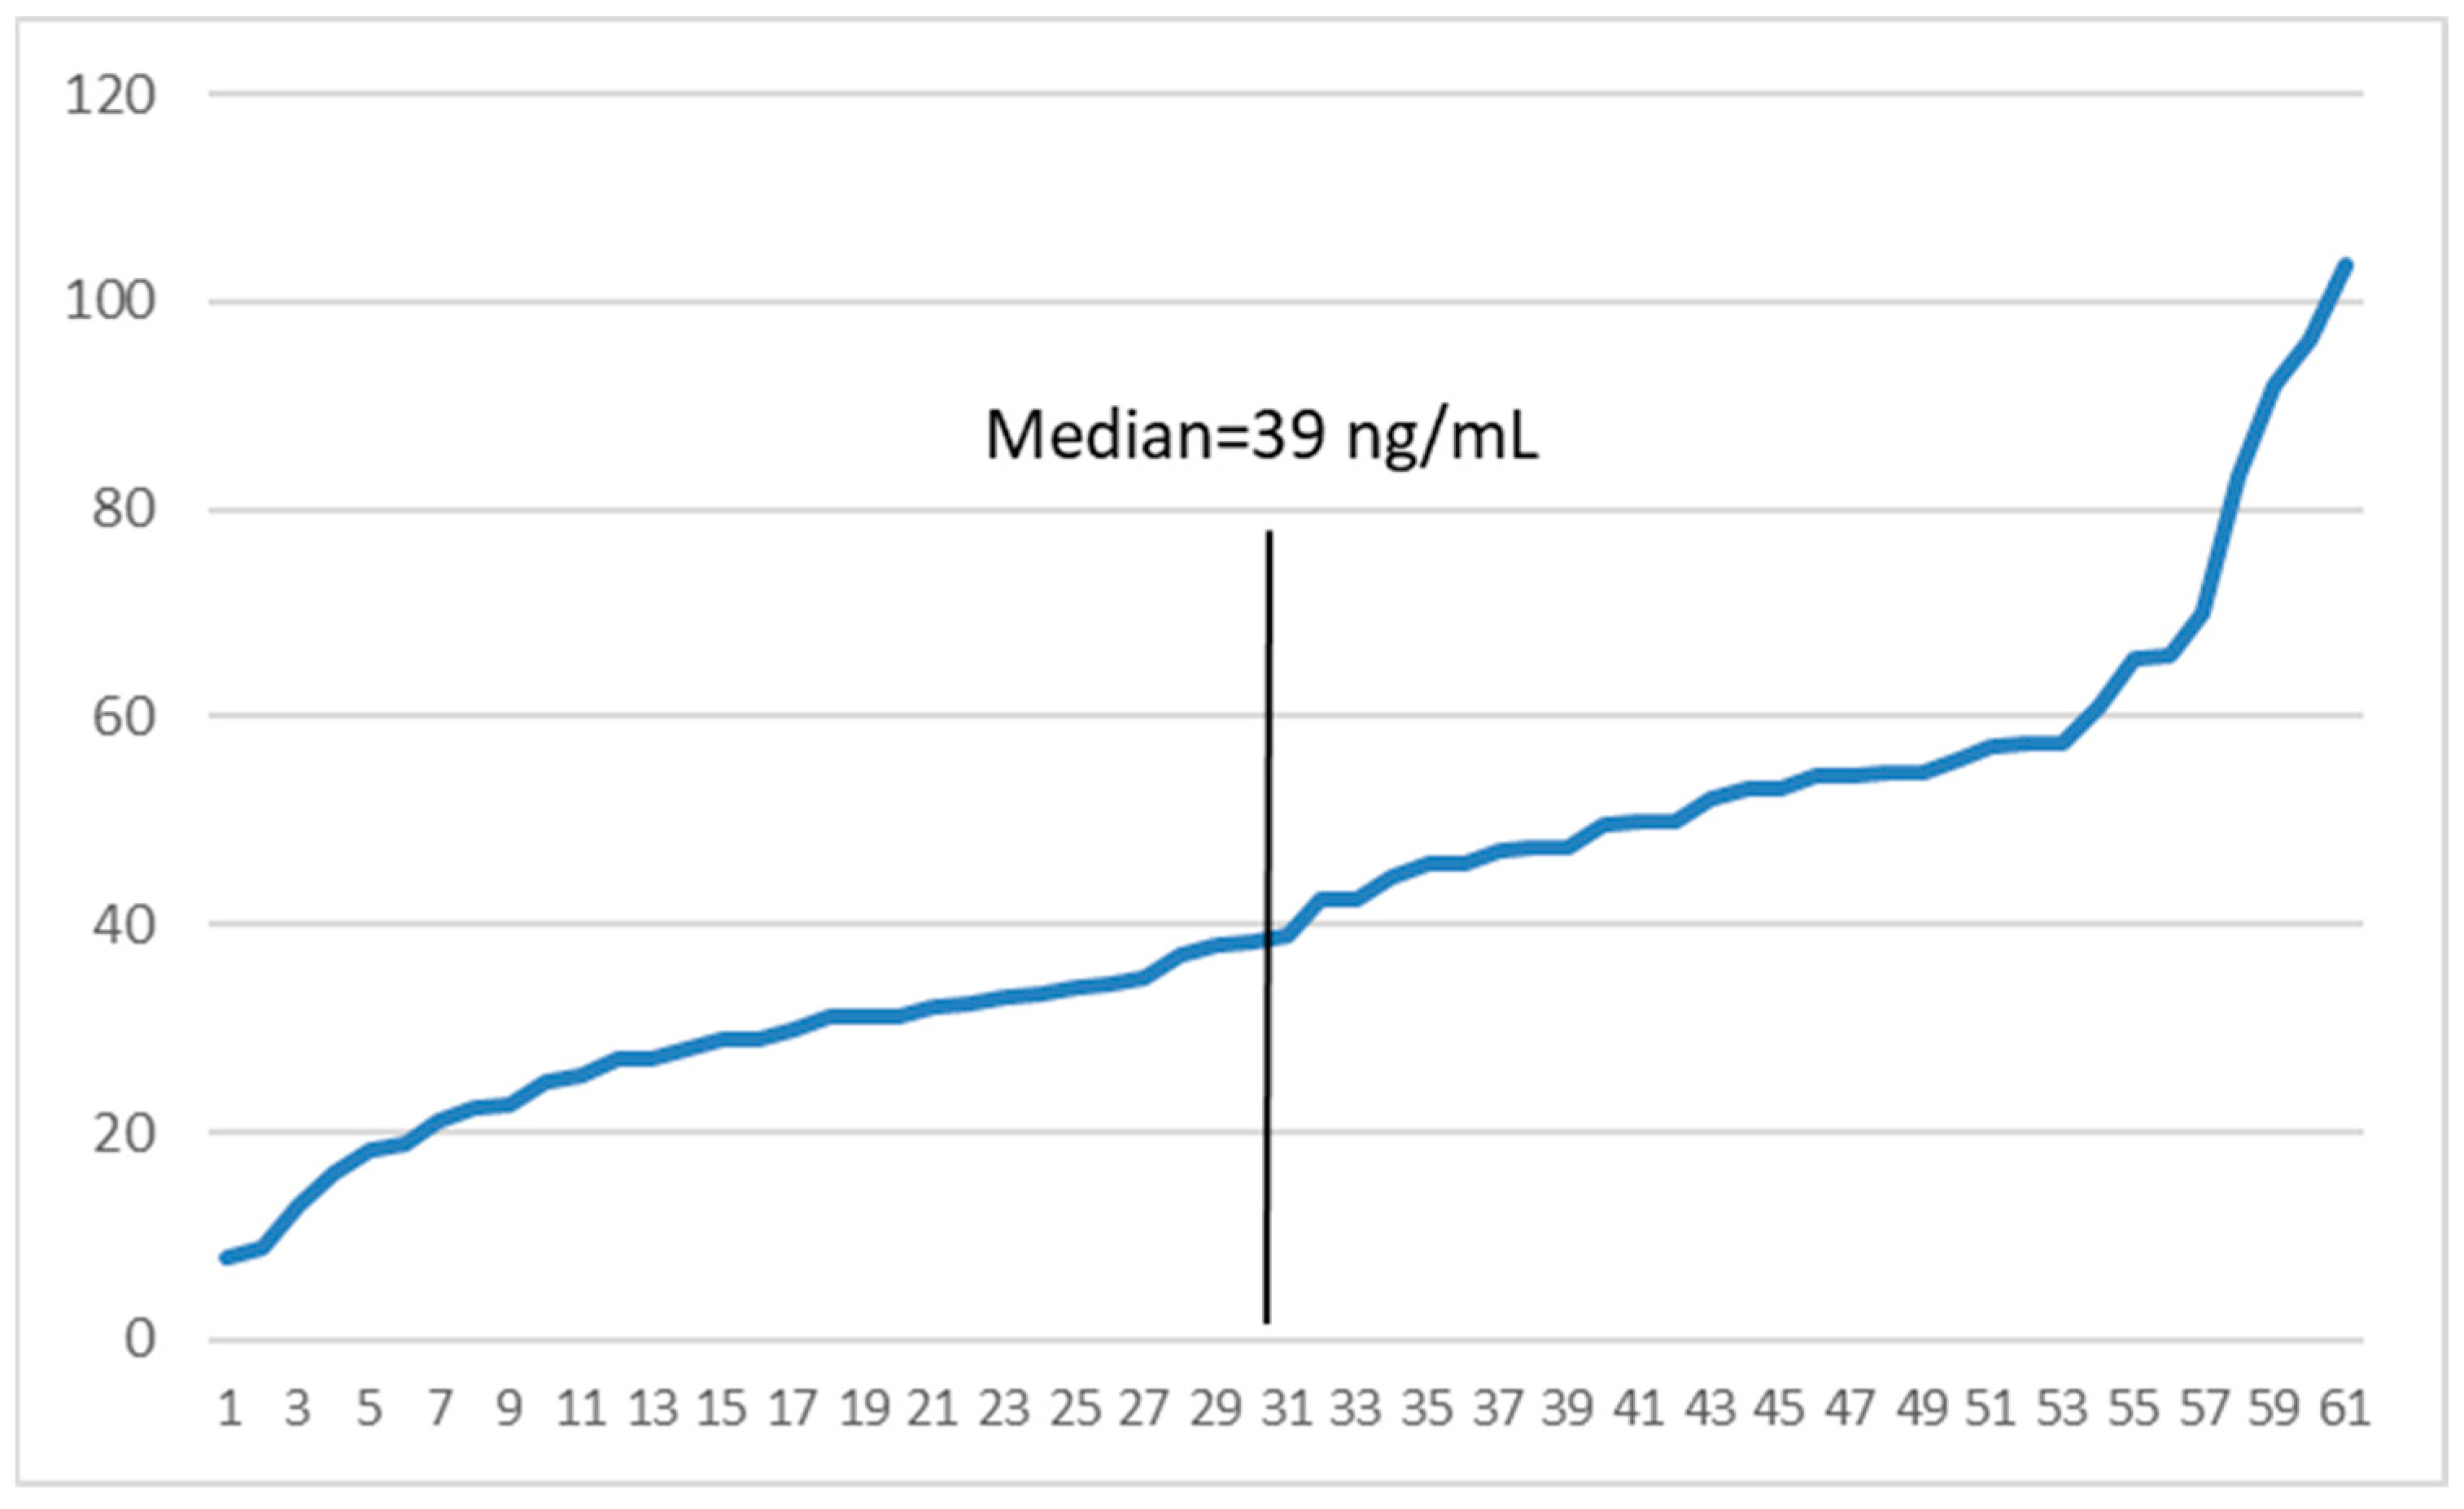
3.3. IRT Values
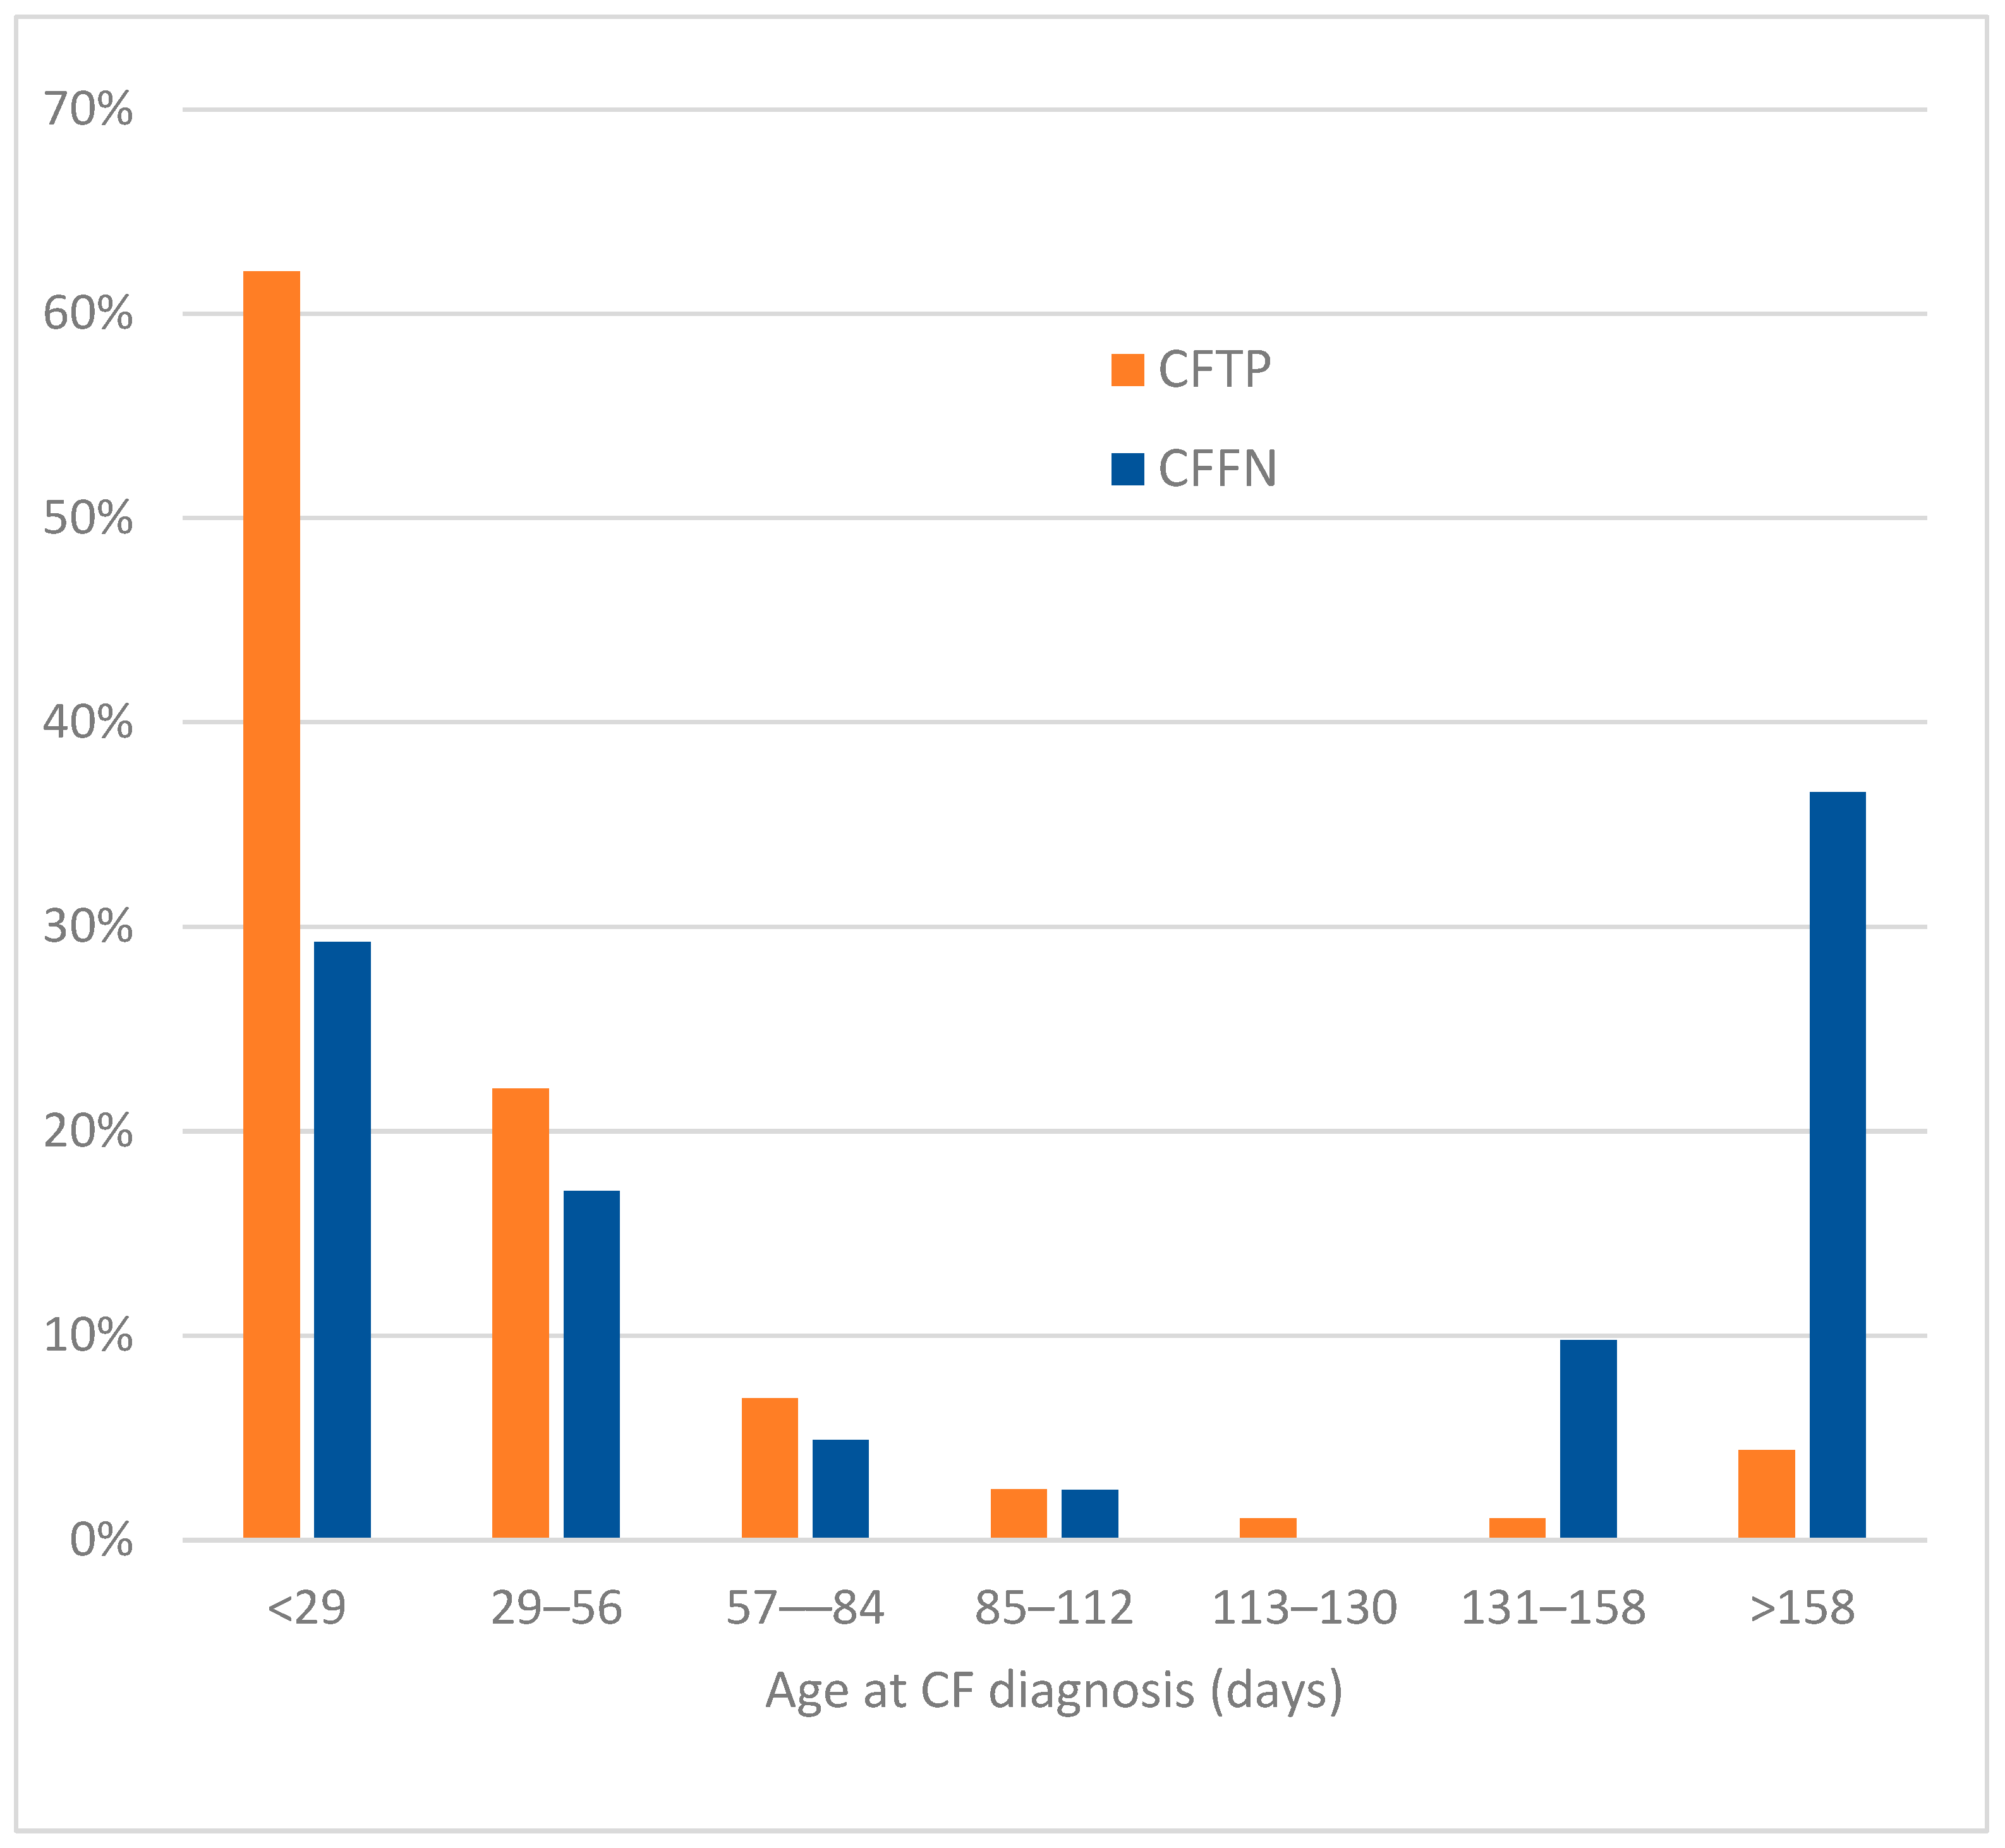
3.4. Age at CF Diagnosis
3.5. Risk Factors
3.5.1. Demographic Factors
Sex
Race
Ethnicity
3.5.2. Timing and Program Factors
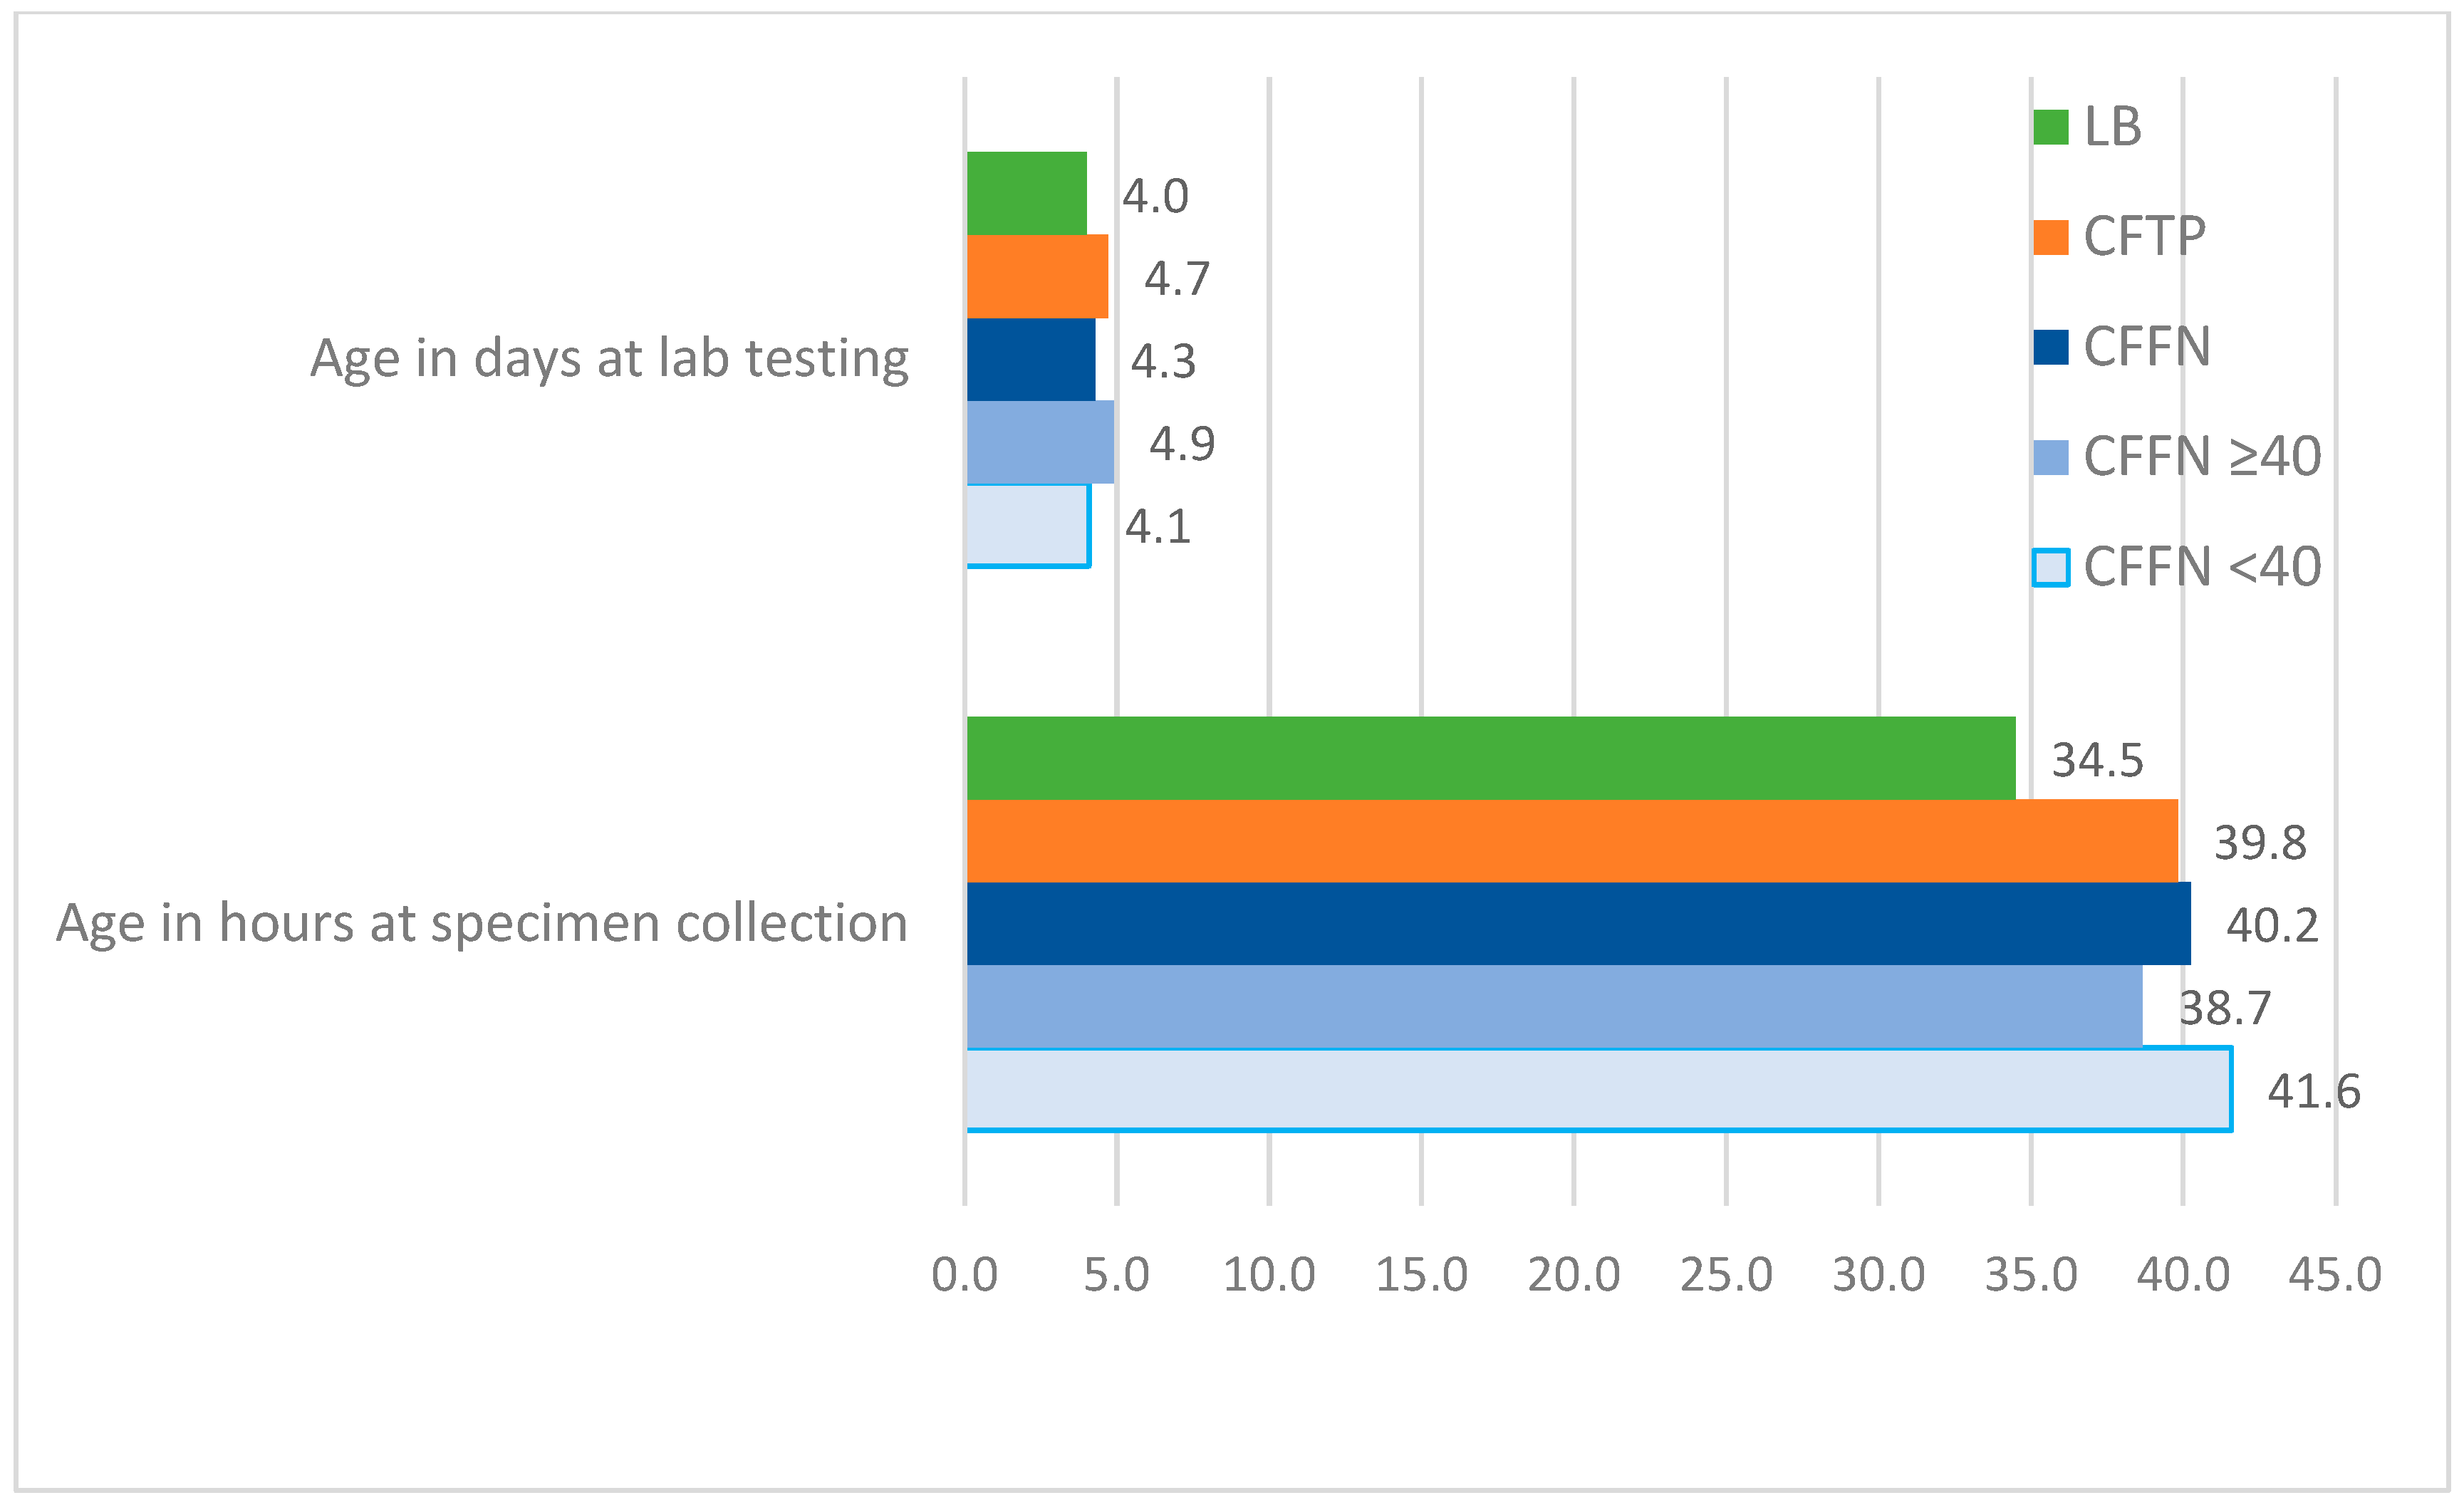
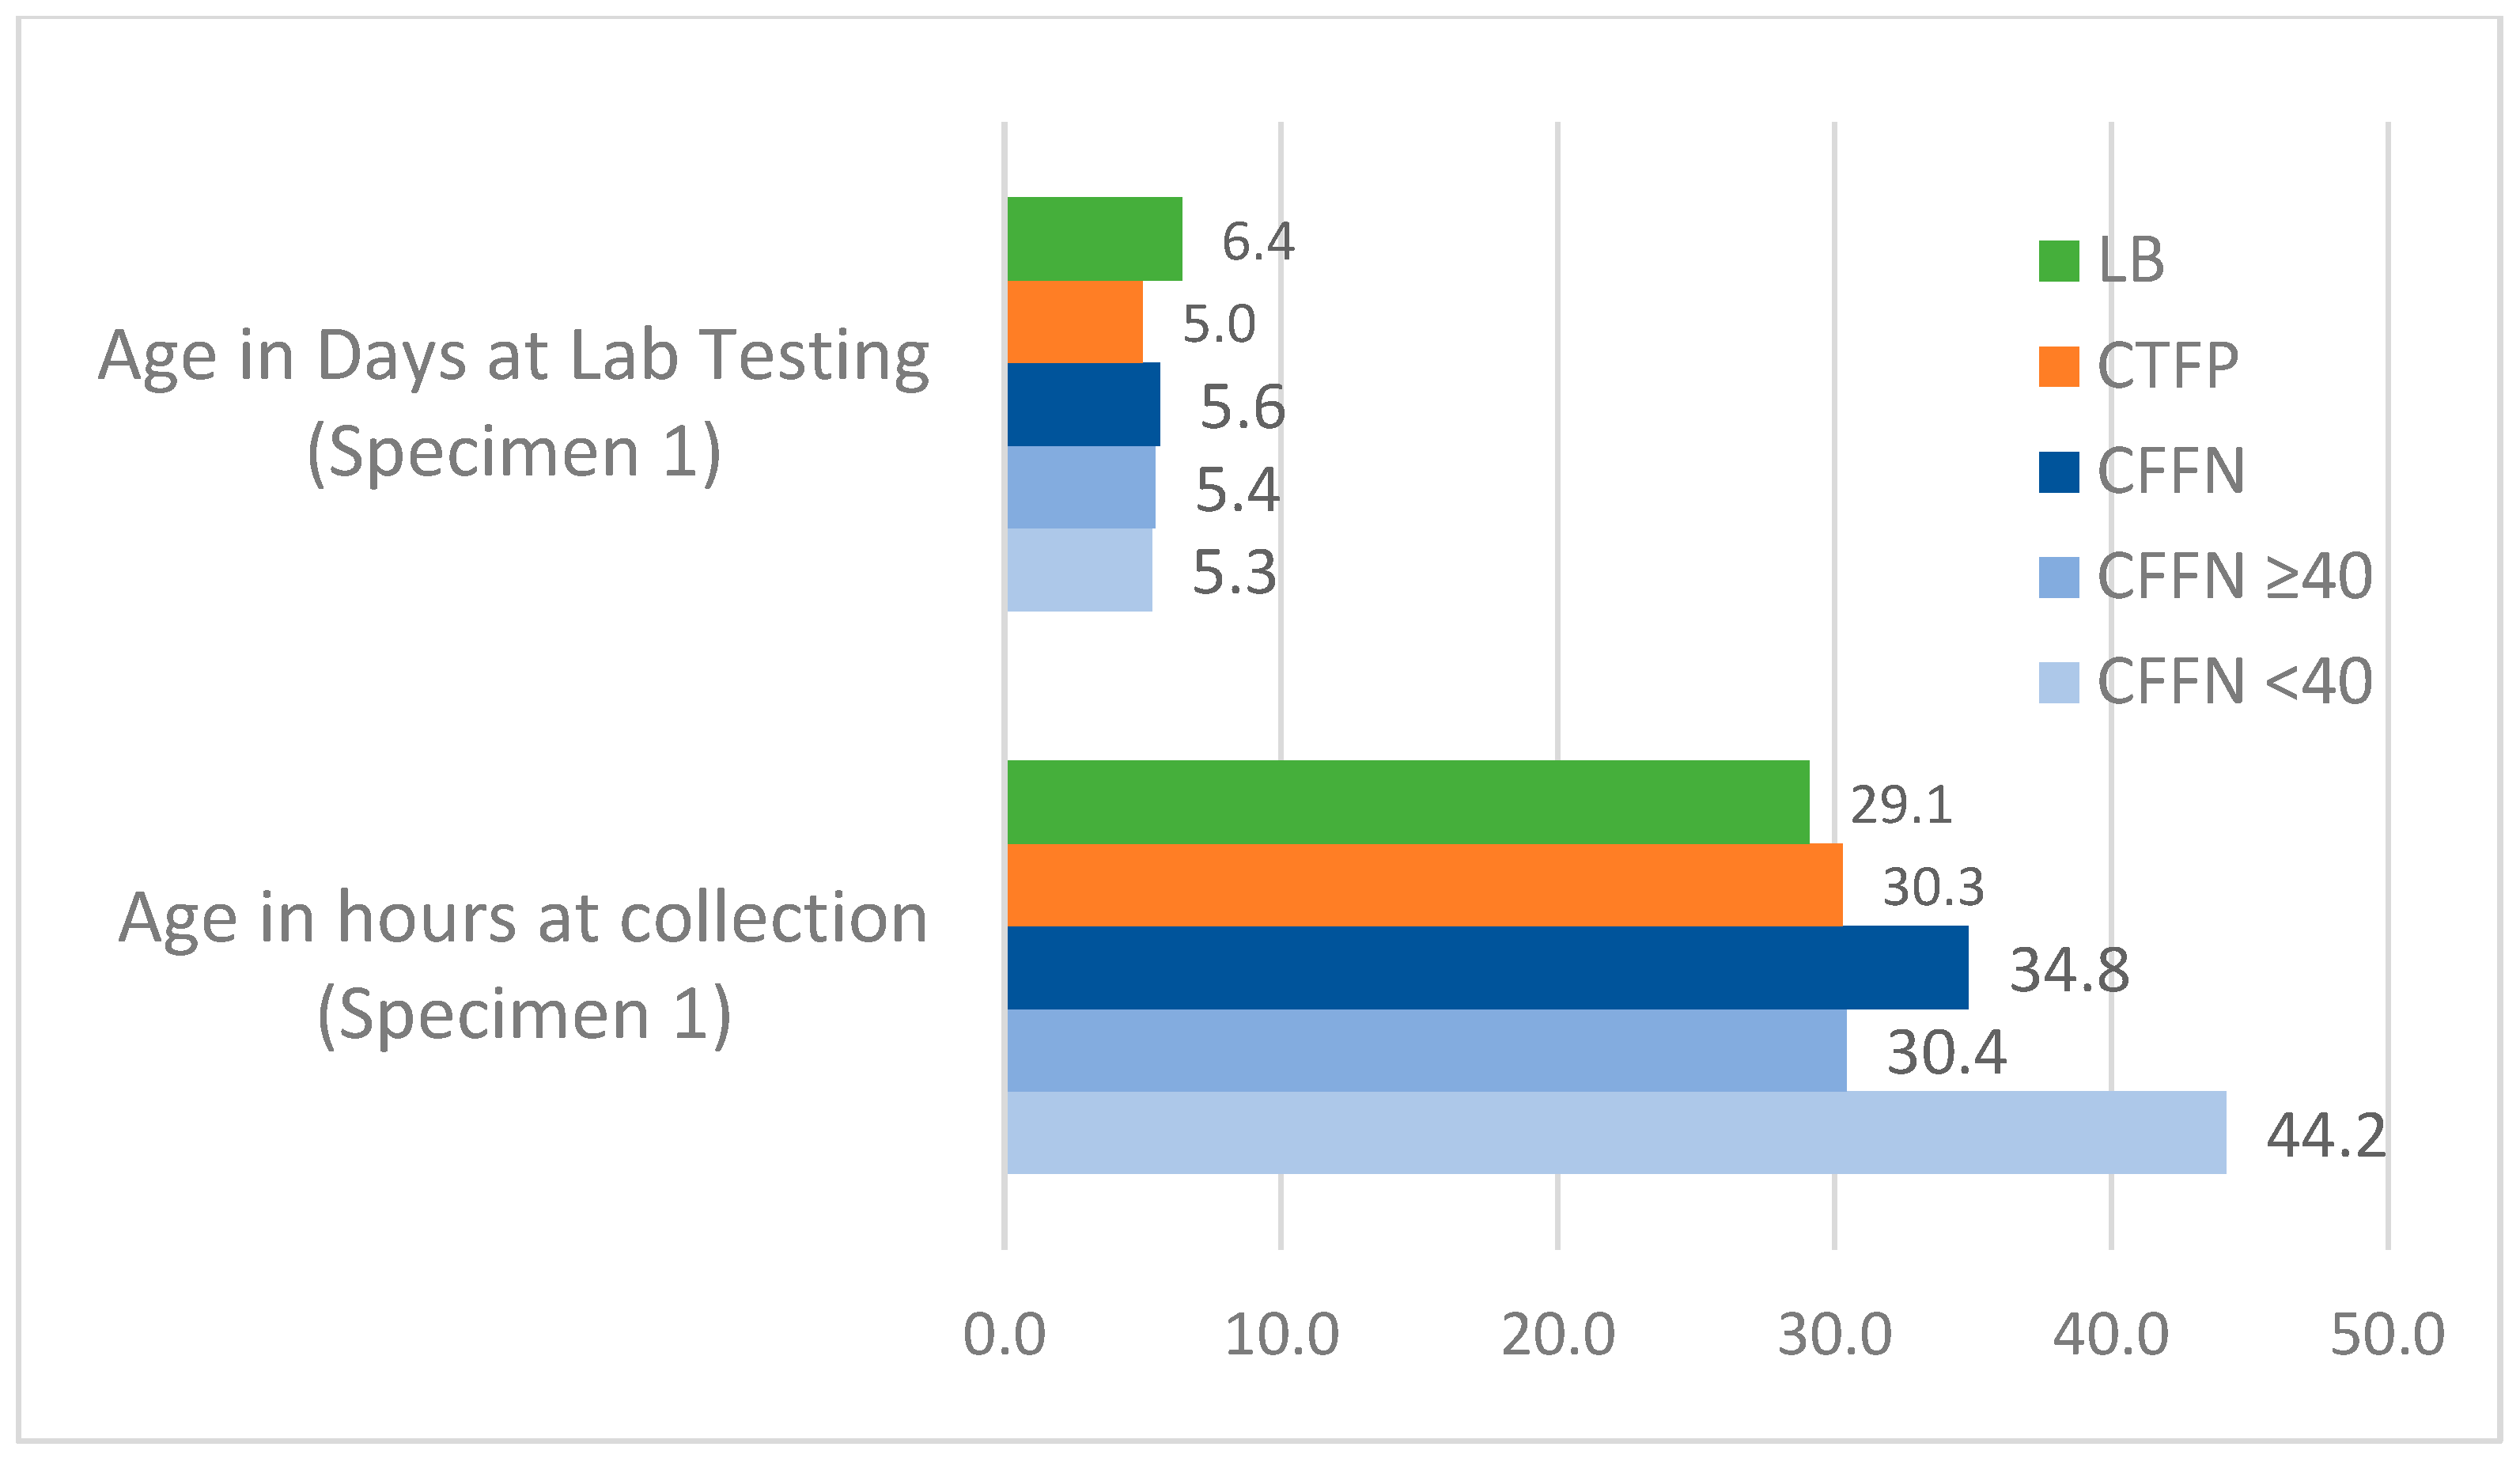
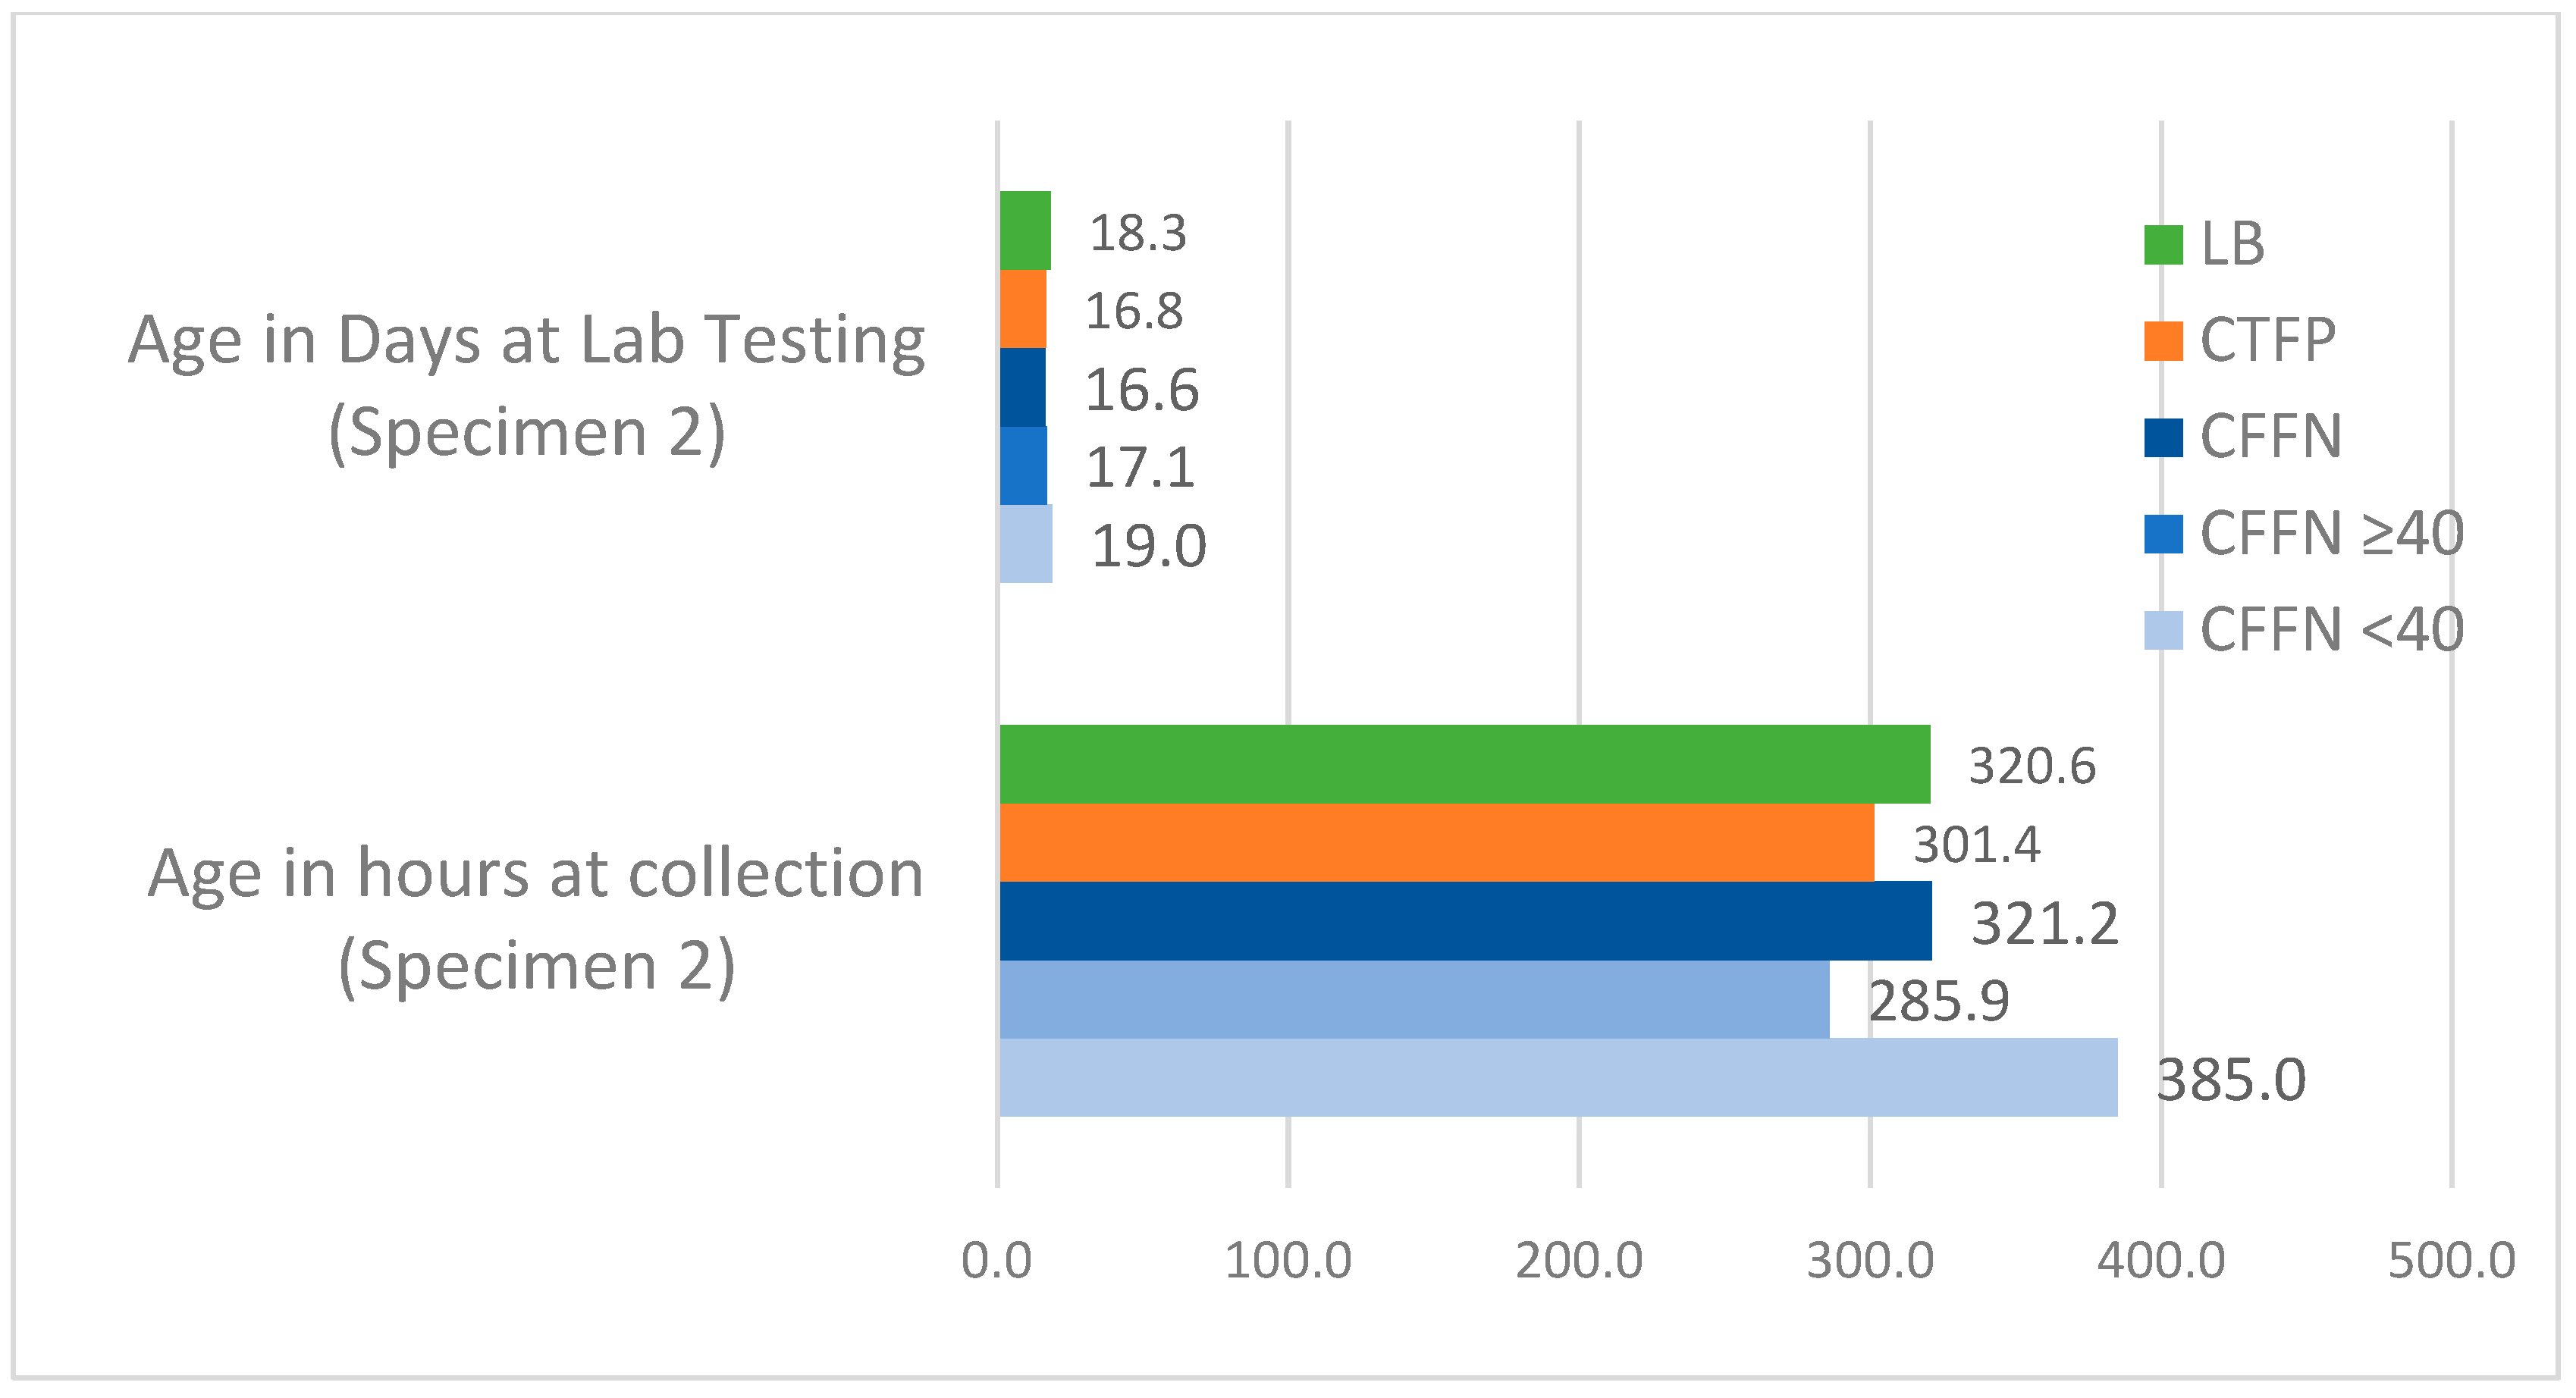
Age at Specimen Collection and Testing
Day of the Week of Birth
Season Specimen Collected
Maximum Consecutive Days Lab Closed
Program Type
3.5.3. CF Algorithm Factors
IRT Cutoff Type
IRT Cutoff Level
3.5.4. Biologic and Health Factors
CFTR Genotype
Birth Weight
Gestational Duration
Infant Feeding
Meconium Ileus
4. Discussion
4.1. Factors Associated with Timing and Practices
4.2. Factors Associated with Newborn Characteristics
4.3. Practice Recommendations
4.4. Study Strengths and Weaknesses
5. Conclusions
Supplementary Materials
Author Contributions
Funding
Institutional Review Board Statement
Informed Consent Statement
Data Availability Statement
Acknowledgments
Conflicts of Interest
References
- Sims, E.J.; Clark, A.; McCormick, J.; Mehta, G.; Connett, G.; Mehta, A. Cystic fibrosis diagnosed after 2 months of age leads to worse outcomes and requires more therapy. Pediatrics 2007, 119, 19–28. [Google Scholar] [CrossRef] [PubMed]
- Sontag, M.K.; Hammond, K.B.; Zielenski, J.; Wagener, J.S.; Accurso, F.J. Two-tiered immunoreactive trypsinogen-based newborn screening for cystic fibrosis in Colorado: Screening efficacy and diagnostic outcomes. J. Pediatr. 2005, 147, S83–S88. [Google Scholar] [CrossRef] [PubMed]
- Rock, M.J.; Hoffman, G.; Laessig, R.H.; Kopish, G.J.; Litsheim, T.J.; Farrell, P.M. Newborn screening for cystic fibrosis in Wisconsin: Nine-year experience with routine trypsinogen/DNA testing. J. Pediatr. 2005, 147, S73–S77. [Google Scholar] [CrossRef] [PubMed]
- Comeau, A.M.; Parad, R.B.; Dorkin, H.L.; Dovey, M.; Gerstle, R.; Haver, K.; Lapey, A.; O’Sullivan, B.; Waltz, D.A.; Zwerdling, R.; et al. Population-based newborn screening for genetic disorders when multiple mutation DNA testing is incorporated: A cystic fibrosis newborn screening model demonstrating increased sensitivity but more carrier detections. Pediatrics 2004, 113, 1573–1581. [Google Scholar] [CrossRef] [PubMed]
- Clinical and Laboratory Standards Institute (CLSI). Newborn Screening for Cystic Fibrosis, 2nd ed.; CLSI Guideline NBS05; Clinical and Laboratory Standards Institute: Wayne, PA, USA, 2019. [Google Scholar]
- Sontag, M.K.; Corey, M.; Hokanson, J.E.; Marshall, J.A.; Sommer, S.S.; Zerbe, G.O.; Accurso, F.J. Genetic and physiologic correlates of longitudinal immunoreactive trypsinogen decline in infants with cystic fibrosis identified through newborn screening. J. Pediatr. 2006, 149, 650–657. [Google Scholar] [CrossRef] [PubMed]
- Therrell, B.L., Jr.; Hannon, W.H.; Hoffman, G.; Ojodu, J.; Farrell, P.M. Immunoreactive Trypsinogen (IRT) as a Biomarker for Cystic Fibrosis: Challenges in newborn dried blood spot screening. Mol. Genet. Metab. 2012, 106, 1–6. [Google Scholar] [CrossRef] [PubMed]
- Rock, M.J.; Levy, H.; Zaleski, C.; Farrell, P.M. Factors accounting for a missed diagnosis of cystic fibrosis after newborn screening. Pediatr. Pulmonol. 2011, 46, 1166–1174. [Google Scholar] [CrossRef] [PubMed] [Green Version]
- Kloosterboer, M.; Hoffman, G.; Rock, M.; Gershan, W.; Laxova, A.; Li, Z.; Farrell, P.M. Clarification of laboratory and clinical variables that influence cystic fibrosis newborn screening with initial analysis of immunoreactive trypsinogen. Pediatrics 2009, 123, e338–e346. [Google Scholar] [CrossRef] [PubMed]
- Calvin, J.; Hogg, S.L.; McShane, D.; McAuley, S.A.; Iles, R.; Ross-Russell, R.; MacLean, F.M.; Heeley, M.E.; Heeley, A.F. Thirty-years of screening for cystic fibrosis in East Anglia. Arch. Dis. Child 2012, 97, 1043–1047. [Google Scholar] [CrossRef] [PubMed]
- Taccetti, G.; Botti, M.; Terlizzi, V.; Cavicchi, M.C.; Neri, A.S.; Galici, V.; Mergni, G.; Centrone, C.; Peroni, D.G.; Festini, F. Clinical and genotypical features of false-negative patients in 26 years of cystic fibrosis neonatal screening in Tuscany, Italy. Diagnostics 2020, 10, 446. [Google Scholar] [CrossRef] [PubMed]
- Rock, M.J.; Mischler, E.H.; Farrell, P.M.; Wei, L.J.; Bruns, W.T.; Hassemer, D.J.; Laessig, R.H. Newborn screening for cystic fibrosis is complicated by age-related decline in immunoreactive trypsinogen levels. Pediatrics 1990, 85, 1001–1007. [Google Scholar] [CrossRef] [PubMed]
- Gregg, R.G.; Simantel, A.; Farrell, P.M.; Koscik, R.; Kosorok, M.R.; Laxova, A.; Laessig, R.; Hoffman, G.; Hassemer, D.; Mischler, E.H.; et al. Newborn screening for cystic fibrosis in Wisconsin: Comparison of biochemical and molecular methods. Pediatrics 1997, 99, 819–824. [Google Scholar] [CrossRef] [PubMed]
- Eaton, R.B.; (New England Newborn Screening Program, Worcester, MA, USA). Personal Communication, 2022.
- Clinical and Laboratory Standards Institute (CLSI). Blood Collection on Filter Paper for Newborn Screening Programs; Approved Standard—Sixth Edition; CLSI Document NBS01-A6; Clinical and Laboratory Standards Institute: Wayne, PA, USA, 2013. [Google Scholar]
- Southern, K.W.; Munck, A.; Pollitt, R.; Travert, G.; Zanolla, L.; Dankert-Roelse, J.; Castellani, C.; ECFS CF Neonatal Screening Working Group. A survey of newborn screening for cystic fibrosis in Europe. J. Cyst. Fibros. 2007, 6, 57–65. [Google Scholar] [CrossRef] [PubMed] [Green Version]
- Doull, I.; Course, C.W.; Hanks, R.E.; Southern, K.W.; Forton, J.T.; Thia, L.P.; Moat, S.J. Cystic fibrosis newborn screening: The importance of bloodspot sample quality. Arch. Dis. Child 2021, 106, 253–257. [Google Scholar] [CrossRef] [PubMed]
- Paracchini, V.; Seia, M.; Raimondi, S.; Costantino, L.; Capasso, P.; Porcaro, L.; Colombo, C.; Coviello, D.A.; Mariani, T.; Manzoni, E.; et al. Cystic fibrosis newborn screening: Distribution of blood immunoreactive trypsinogen concentrations in hypertrypsinemic neonates. JIMD Rep. 2012, 4, 17–23. [Google Scholar] [CrossRef] [PubMed] [Green Version]
- Adam, B.W.; Flores, S.R.; Hou, Y.; Allen, T.W.; De Jesus, V.R. Galactose-1-phosphate uridyltransferase dried blood spot quality control materials for newborn screening tests. Clin. Biochem. 2015, 48, 437–442. [Google Scholar] [CrossRef] [PubMed] [Green Version]
- Adam, B.W.; Hall, E.M.; Sternberg, M.; Lim, T.H.; Flores, S.R.; O’Brien, S.; Simms, D.; Li, L.X.; De Jesus, V.R.; Hannon, W.H. The stability of markers in dried-blood spots for recommended newborn screening disorders in the United States. Clin. Biochem. 2011, 44, 1445–1450. [Google Scholar] [CrossRef] [PubMed] [Green Version]
- Farrell, P.M.; Rosenstein, B.J.; White, T.B.; Accurso, F.J.; Castellani, C.; Cutting, G.R.; Durie, P.R.; Legrys, V.A.; Massie, J.; Parad, R.B.; et al. Guidelines for diagnosis of cystic fibrosis in newborns through older adults: Cystic Fibrosis Foundation consensus report. J. Pediatr. 2008, 153, S4–S14. [Google Scholar] [CrossRef] [PubMed]


| Variable | Inclusion | Exclusion 1 | Number of States | Response Categories |
|---|---|---|---|---|
| Demographic Factors | ||||
| Sex | All states 2 | Subjects with sex missing or unknown | Summed for 13 states | % female, male |
| Race | States providing data for all study groups 2 | 2 States not collecting data; Subjects with race missing or unknown | Summed for 11 states | % White, Black, Other |
| Ethnicity | States providing data for all study groups 2 | 2 States not collecting data; subjects with ethnicity missing or unknown | Summed for 11 states | % Hispanic |
| Timing and Program Factors | ||||
| Median newborn age at specimen collection and IRT testing | States providing data; subjects had data for both variables | 2 States not providing one or both data items for all study groups; 2 States with zero CFFNs | 9 states stratified by 1- and 2-specimen programs | Average median age weighted by state birth counts and number of CFTPs and CFFNs |
| Day of week birth occurred | States providing data for all study groups | 2 States with missing data for CFFNs or CFTPs | Summed for 11 states | % born on different days of the week |
| Season of Specimen Collection | States providing data on month of specimen collection for all study groups | 2 States with missing data for CFFNs or CFTPs | Summed for 11 states | % specimens collected in different seasons of the year |
| Maximum consecutive days lab closed 3 | All states | none | Summed for 13 states | % in states with a lab that can be closed for a maximum of 3 or more or less than 3 days |
| Program type 3 | All states | none | Summed for 13 states | % in states screening 1- or 2- specimens |
| CF Algorithm Factors | ||||
| Median IRT value | States providing data for all study groups | 3 States with missing data for CFTPs and LBs | 10 states stratified by 1- and 2-specimen programs | Average median IRT weighted by the number of LBs, CFTPs and CFFNs |
| IRT cutoff type 3 | All states | none | Summed for 13 states | % in states using a fixed or floating IRT cutoff |
| IRT cutoff level 3 | All states | none | Summed for 13 states | % in states with an IRT cutoff of <0.96, ≥0.96, ≥0.97, ≥0.98, ≥0.99 percentiles |
| Biologic and Health Factors | ||||
| CFTR genotype 4 | States providing data for both CFTP and CFFN study groups | 2 States not collecting data; subjects not undergoing genotype testing | Summed for 11 states | % in ranked categories based on CFTR2 5: 1. Both variants unidentified 2. Both variants known CF-causing 3. All other genotype combinations |
| Birth weight | All states 2 | Subjects with birth weight missing or unknown | Summed for 13 states | % <2500, ≥2500 g |
| Gestational duration | States providing data for all study groups 2 | 5 States not collecting data; 2 States with a high proportion of missing data; subjects with gestational age missing or unknown | Summed for 6 states | % <37, ≥37 completed weeks |
| Infant feeding | States providing data for all study groups | 7 states not collecting data; subjects with feeding data unknown or missing | Summed for 6 states | % breast only, any formula use |
| Meconium ileus | States providing data for both CFTP and CFFN study groups | 4 States not collecting data | Summed for 9 states | % meconium ileus present, not indicated |
| LB | CFTP | CFFN | CFFN/(CFTP + CFFN) | ||||||
|---|---|---|---|---|---|---|---|---|---|
| Characteristic | Response Categories | State N 1 | N | % | N | % | N | % | % CF Cases Missed |
| Total | (Includes subjects with ≥1 missing values | 13 | 11,246,522 | 100% | 2019 | 100% | 61 | 100% | 2.93% |
| Demographic Factors | |||||||||
| Sex | Total 2 | 13 | 11,187,241 | 100% | 2009 | 100% | 61 | 100% | 2.95% |
| Female | 5,463,266 | 49% | 990 | 49% | 30 | 49% | 2.94% | ||
| Male | 5,723,975 | 51% | 1019 | 51% | 31 | 51% | 2.95% | ||
| Race | Total 2 | 11 | 9,710,432 | 100% | 1671 | 100% | 55 | 100% | 3.19% |
| White | 5,630,167 | 58% | 1337 | 80% | 40 | 73% | 2.90% | ||
| Black | 1,381,196 | 14% | 69 | 4% | 7 | 13% | 9.21% | ||
| Total | 11 | 9,708,228 | 100% | 1671 | 100% | 55 | 100% | 3.19% | |
| Other | 1,609,495 | 17% | 137 | 8% | 6 | 11% | 4.20% | ||
| Ethnicity | Total 2 | 11 | 8,747,765 | 100% | 1458 | 100% | 54 | 100% | 3.57% |
| Hispanic | 2,613,806 | 30% | 262 | 18% | 7 | 13% | 2.60% | ||
| Non-Hispanic | 6,133,959 | 70% | 1196 | 82% | 47 | 87% | 3.78% | ||
| Timing and Program Factors | |||||||||
| Day of | Total 2 | 11 | 9,338,370 | 100% | 1614 | 100% | 52 | 100% | 3.01% |
| Week Birth | Sunday | 918,843 | 10% | 161 | 10% | 3 | 6% | 1.63% | |
| Occurred | Monday | 1,361,901 | 15% | 205 | 13% | 9 | 17% | 3.57% | |
| Tuesday | 1,532,034 | 16% | 269 | 17% | 4 | 8% | 1.59% | ||
| Wednesday | 1,519,135 | 16% | 246 | 15% | 9 | 17% | 3.75% | ||
| Thursday | 1,502,243 | 16% | 274 | 17% | 8 | 15% | 2.71% | ||
| Friday | 1,474,005 | 16% | 272 | 17% | 8 | 15% | 3.13% | ||
| Saturday | 1,030,209 | 11% | 187 | 12% | 11 | 21% | 4.76% | ||
| Season of | Total 1 | 11 | 10,125,349 | 100% | 1833 | 100% | 55 | 100% | 2.91% |
| Specimen | Winter | 2,417,172 | 24% | 422 | 23% | 12 | 22% | 2.76% | |
| Collection | Spring | 2,415,596 | 24% | 435 | 24% | 9 | 16% | 2.03% | |
| Summer | 2,585,070 | 26% | 503 | 27% | 17 | 31% | 3.27% | ||
| Fall | 2,707,511 | 27% | 473 | 26% | 17 | 31% | 3.47% | ||
| Maximum | Total | 13 | 11,246,522 | 100% | 2019 | 100% | 61 | 100% | 2.93% |
| consecutive | ≥3 | 6,050,025 | 54% | 993 | 49% | 34 | 56% | 3.31% | |
| days lab closed | <3 | 5,196,497 | 46% | 1026 | 51% | 27 | 44% | 2.56% | |
| Program | Total | 13 | 11,246,522 | 100% | 2019 | 100% | 61 | 100% | 2.93% |
| Type | 2-specimen | 2,116,730 | 19% | 367 | 18% | 13 | 21% | 3.42% | |
| 1-specimen | 9,129,792 | 81% | 1652 | 82% | 48 | 79% | 2.82% | ||
| CF Algorithm Factors | |||||||||
| IRT | Total | 13 | 11,246,522 | 100% | 2019 | 100% | 61 | 100% | 2.93% |
| Cutoff | Fixed | 6,444,732 | 57% | 1025 | 51% | 37 | 61% | 3.48% | |
| Type | Floating | 4,801,790 | 43% | 994 | 49% | 24 | 39% | 2.36% | |
| IRT Cutoff | Total | 13 | 11,246,522 | 100% | 2019 | 100% | 61 | 100% | 2.93% |
| Level | <0.96 | 5,016,295 | 45% | 921 | 46% | 24 | 39% | 2.54% | |
| (percentile) | ≥0.96 | 6,230,227 | 55% | 1098 | 54% | 37 | 61% | 3.26% | |
| ≥0.97 | 4,308,751 | 38% | 679 | 34% | 28 | 46% | 3.96% | ||
| ≥0.98 | 4,054,073 | 36% | 611 | 30% | 23 | 38% | 3.63% | ||
| ≥0.99 | 809,440 | 7% | 126 | 6% | 6 | 10% | 4.55% | ||
| Biologic and Health Factors | |||||||||
| Genotype | Total 2 | 11 | N/A | N/A | 1853 | 100% | 55 | 100% | 2.88% |
| Both variants unidentified | 89 | 5% | 3 | 5% | 3.26% | ||||
| Both variants known CF-causing | 1295 | 70% | 27 | 49% | 2.04% | ||||
| Other combinations | 469 | 25% | 25 | 45% | 5.06% | ||||
| Birth weight | Total 2 | 13 | 11,071,755 | 100% | 1988 | 100% | 61 | 100% | 2.98% |
| (g) | <2500 | 917,081 | 8% | 209 | 11% | 8 | 13% | 3.69% | |
| ≥2500 | 10,154,674 | 92% | 1779 | 89% | 53 | 87% | 2.89% | ||
| Gestational | Total 2 | 6 | 1,899,932 | 100% | 426 | 100% | 14 | 100% | 3.18% |
| age (weeks) | <37 | 211,168 | 11% | 50 | 12% | 4 | 29% | 7.41% | |
| ≥37 | 1,688,764 | 89% | 376 | 88% | 10 | 71% | 2.59% | ||
| Infant Feeding | Total 2 | 6 | 5,247,261 | 100% | 824 | 100% | 24 | 100% | 2.83% |
| Breast Only | 2,727,016 | 52% | 454 | 55% | 9 | 38% | 1.94% | ||
| Any Formula Use | 2,520,245 | 48% | 370 | 45% | 15 | 63% | 3.90% | ||
| Meconium | Total 2 | 9 | N/A | N/A | 1090 | 100% | 37 | 100% | 3.28% |
| Ileus | Present | 169 | 16% | 11 | 30% | 6.11% | |||
| Not present | 921 | 84% | 26 | 70% | 2.75% | ||||
| CFTP Cases | CFFN Cases | |||||||||||
|---|---|---|---|---|---|---|---|---|---|---|---|---|
| All | ≥40 ng/mL | <40 ng/mL | Odds Ratios 1 (90% CI) 2 | |||||||||
| Characteristic | Response Categories | N | % | N | % | N | % | N | % | All CFFNs | ≥40 ng/mL | <40 ng/mL |
| Demographic Factors | ||||||||||||
| Sex | Total | 2009 | 100% | 61 | 100% | 30 | 100% | 31 | 100% | |||
| Female | 990 | 49% | 30 | 49% | 14 | 47% | 16 | 52% | 1.0 | 0.9 | 1.1 | |
| vs. Male | 1019 | 51% | 31 | 51% | 16 | 53% | 15 | 48% | ||||
| Race | Total | 1671 | 100% | 55 | 100% | 26 | 100% | 29 | 100% | |||
| White | 1337 | 80% | 40 | 73% | 18 | 69% | 22 | 76% | 0.7 | 0.6 | 0.8 | |
| vs. Rest | 334 | 20% | 15 | 27% | 8 | 31% | 7 | 24% | ||||
| Black | 69 | 4% | 7 | 13% | 4 | 15% | 3 | 10% | 3.4 | 4.2 | 2.7 | |
| vs. Rest | 1602 | 96% | 48 | 87% | 22 | 85% | 26 | 90% | (1.7, 6.8) | (1.7, 10.6) | (0.96, 7.5) | |
| Other | 137 | 8% | 6 | 11% | 3 | 12% | 3 | 10% | 1.4 | 1.4 | 1.5 | |
| vs. Rest | 1534 | 92% | 49 | 89% | 23 | 88% | 26 | 90% | ||||
| Ethnicity | Total | 1458 | 100% | 54 | 100% | 25 | 100% | 29 | 100% | |||
| Hispanic | 262 | 18% | 7 | 13% | 1 | 4% | 6 | 21% | 0.7 | 0.2 | 1.2 | |
| vs. Rest | 1196 | 82% | 47 | 87% | 24 | 96% | 23 | 79% | (0.0, 0.98) | |||
| Timing and Program Factors | ||||||||||||
| Day of | Total | 1614 | 100% | 52 | 100% | 24 | 100% | 28 | 100% | |||
| Week Birth | Saturday | 187 | 12% | 11 | 21% | 4 | 17% | 7 | 25% | 2.0 | 1.5 | 2.5 |
| Occurred | vs. Other | 1427 | 88% | 41 | 79% | 20 | 83% | 21 | 75% | (1.2, 3.6) | (1.2, 5.3) | |
| Sunday | 161 | 10% | 3 | 6% | (a) | (a) | (a) | (a) | 0.6 | (a) | (a) | |
| vs. Other | 1453 | 90% | 49 | 94% | (a) | (a) | ||||||
| Tuesday | 269 | 17% | 4 | 8% | 2 | 8% | 2 | 7% | 0.4 | 0.5 | 0.4 | |
| vs. Other | 1345 | 83% | 48 | 92% | 22 | 92% | 26 | 93% | (0.2, 0.99) | (0.1, 1.5) | (0.1, 1.3) | |
| Season of | Total | 1833 | 100% | 55 | 100% | 25 | 100% | 30 | 100% | |||
| Specimen | Summer/Fall | 976 | 53% | 34 | 62% | 13 | 52% | 21 | 70% | 1.4 | 1.0 | 2.0 |
| Collection | vs. Other | 857 | 47% | 21 | 38% | 12 | 48% | 9 | 30% | (1.1, 4.0) | ||
| Maximum Con- | Total | 2019 | 100% | 61 | 100% | 30 | 100% | 31 | 100% | |||
| secutive Days | ≥3 | 993 | 49% | 34 | 56% | 13 | 43% | 21 | 68% | 1.2 | 0.7 | 2.0 |
| Lab Closed | <3 | 1026 | 51% | 27 | 44% | 17 | 57% | 10 | 32% | (1.1, 3.8) | ||
| Program | Total | 2019 | 100% | 61 | 100% | 30 | 100% | 31 | 100% | |||
| Type | 2-specimen | 367 | 18% | 13 | 21% | 7 | 23% | 6 | 19% | 1.2 | 1.4 | 1.1 |
| vs. 1-specimen | 1652 | 82% | 48 | 79% | 23 | 77% | 25 | 81% | ||||
| CF Algorithm Factors | ||||||||||||
| IRT | Total | 2019 | 100% | 61 | 100% | 30 | 100% | 31 | 100% | |||
| Cutoff | Fixed | 1025 | 51% | 37 | 61% | 20 | 67% | 17 | 55% | 1.5 | 2.0 | 1.2 |
| Type | vs. Floating | 994 | 49% | 24 | 39% | 10 | 33% | 14 | 45% | (1.1, 3.8) | ||
| IRT Cutoff | Total | 2019 | 100% | 61 | 100% | 30 | 100% | 31 | 100% | |||
| Level | ≥0.96 | 1098 | 54% | 37 | 61% | 20 | 67% | 17 | 55% | 1.3 | 1.7 | 1.0 |
| (percentile) | vs. <0.96 | 921 | 46% | 24 | 39% | 10 | 33% | 14 | 45% | |||
| Biologic and Health Factors | ||||||||||||
| Genotype | Total | 1853 | 100% | 55 | 100% | 25 | 100% | 30 | 100% | |||
| Both variants unidentified | 89 | 5% | 3 | 5% | 1 | 4% | 2 | 7% | 1.1 | 0.8 | 1.4 | |
| vs. other genotypes | 1764 | 95% | 52 | 95% | 24 | 96% | 28 | 93% | ||||
| Both variants CF-causing | 1295 | 70% | 27 | 49% | 9 | 36% | 18 | 60% | 0.4 | 0.2 | 0.6 | |
| vs. other genotypes | 558 | 30% | 28 | 51% | 16 | 64% | 12 | 30% | (0.3, 0.7) | (0.1, 0.5) | ||
| Other combinations | 469 | 25% | 25 | 45% | 15 | 60% | 10 | 33% | 2.5 | 4.4 | 1.5 | |
| vs. other genotypes | 1384 | 75% | 30 | 55% | 10 | 40% | 20 | 67% | (1.6, 3.9) | (2.2, 8.7) | ||
| Birth weight | Total | 1988 | 100% | 61 | 100% | 30 | 100% | 31 | 100% | |||
| (g) | <2500 | 209 | 11% | 8 | 13% | 3 | 10% | 5 | 16% | 1.3 | 0.9 | 1.6 |
| ≥2500 | 1779 | 53 | 27 | 26 | ||||||||
| Gestational age | Total | 426 | 100% | 14 | 100% | 8 | 100% | 6 | 100% | |||
| (weeks) | <37 | 50 | 12% | 4 | 29% | 1 | 13% | 3 | 50% | 3.0 | 1.1 | 7.5 |
| ≥37 | 376 | 88% | 10 | 71% | 7 | 67% | 3 | 50% | (1.1, 8.2) | (1.9, 29.5) | ||
| Infant Feeding | Total | 824 | 100% | 24 | 100% | 13 | 100% | 11 | 100% | |||
| Any Formula Use | 370 | 45% | 15 | 63% | 5 | 38% | 10 | 91% | 2.0 | 0.8 | 12.3 | |
| Breast Only | 454 | 55% | 9 | 37% | 8 | 62% | 1 | 9% | (1.01, 4.1) | (2.2, 69.1) | ||
| Meconium | Total | 1090 | 100% | 37 | 100% | 21 | 100% | 16 | 100% | |||
| Ileus | Present | 169 | 16% | 11 | 30% | 7 | 33% | 4 | 25% | 2.3 | 2.7 | 1.8 |
| Not present | 921 | 84% | 26 | 70% | 14 | 67% | 12 | 75% | (1.2, 4.2) | (1.3, 5.9) | ||
Publisher’s Note: MDPI stays neutral with regard to jurisdictional claims in published maps and institutional affiliations. |
© 2022 by the authors. Licensee MDPI, Basel, Switzerland. This article is an open access article distributed under the terms and conditions of the Creative Commons Attribution (CC BY) license (https://creativecommons.org/licenses/by/4.0/).
Share and Cite
Kharrazi, M.; Sacramento, C.; Comeau, A.M.; Hale, J.E.; Caggana, M.; Kay, D.M.; Lee, R.; Reilly, B.; Thompson, J.D.; Nasr, S.Z.; et al. Missed Cystic Fibrosis Newborn Screening Cases due to Immunoreactive Trypsinogen Levels below Program Cutoffs: A National Survey of Risk Factors. Int. J. Neonatal Screen. 2022, 8, 58. https://doi.org/10.3390/ijns8040058
Kharrazi M, Sacramento C, Comeau AM, Hale JE, Caggana M, Kay DM, Lee R, Reilly B, Thompson JD, Nasr SZ, et al. Missed Cystic Fibrosis Newborn Screening Cases due to Immunoreactive Trypsinogen Levels below Program Cutoffs: A National Survey of Risk Factors. International Journal of Neonatal Screening. 2022; 8(4):58. https://doi.org/10.3390/ijns8040058
Chicago/Turabian StyleKharrazi, Martin, Charlene Sacramento, Anne Marie Comeau, Jaime E. Hale, Michele Caggana, Denise M. Kay, Rachel Lee, Brendan Reilly, John D. Thompson, Samya Z. Nasr, and et al. 2022. "Missed Cystic Fibrosis Newborn Screening Cases due to Immunoreactive Trypsinogen Levels below Program Cutoffs: A National Survey of Risk Factors" International Journal of Neonatal Screening 8, no. 4: 58. https://doi.org/10.3390/ijns8040058