End-to-End Modeling Reveals Species-Specific Effects of Large-Scale Coastal Restoration on Living Resources Facing Climate Change
 Kim de Mutsert
 Kristy A. Lewis
 Eric D. White
 Joe Buszowski4
- 1Department of Environmental Science and Policy, George Mason University, Fairfax, VA, United States
- 2National Center for Integrated Coastal Research, Department of Biology, University of Central Florida, Orlando, FL, United States
- 3Research and Planning Division, Louisiana Coastal Protection and Restoration Authority, Baton Rouge, LA, United States
- 4Ecopath International Initiative Research Association, Barcelona, Spain
Coastal erosion and wetland loss are affecting Louisiana to such an extent that the loss of land between 1932 and 2016 was close to 5,000 km2. To mitigate this decline, coastal protection and restoration projects are being planned and implemented by the State of Louisiana, United States. The Louisiana Coastal Master Plan (CMP) is an adaptive management approach that provides a suite of projects that are predicted to build or maintain land and protect coastal communities. Restoring the coast with this 50-year large-scale restoration and risk reduction plan has the potential to change the biomass and distribution of economically and ecologically important fisheries species in this region. However, not restoring the coast may have negative impacts on these species due to the loss of habitat. This research uses an ecosystem model to evaluate the effects of plan implementation versus a future without action (FWOA) on the biomass and distribution of fisheries species in the estuaries over 50 years of model simulations. By simulating effects using a spatially-explicit ecosystem model, not only can the changes in biomass in response to plan implementation be evaluated, but also the distribution of species in response to the planned restoration and risk reduction projects. Simulations are performed under two relative sea level rise (SLR) scenarios to understand the effects of climate change on project performance and subsequent fisheries species biomass and distribution. Simulation output of eight economically important fisheries species shows that the plan mostly results in increases in species biomass, but that the outcomes are species-specific and basin-specific. The SLR scenario highly affects the amount of wetland habitat maintained after 50 years (with higher levels of wetland loss under increased SLR) and, subsequently, the biomass of species depending on that habitat. Species distribution results can be used to identify expected changes for specific species on a regional basis. By making this type of information available to resource managers, precautionary measures of ecosystem management and adaptation can be implemented.
Introduction
The estuaries of the northern Gulf of Mexico, United States, are nowhere as extensive as in the Louisiana coastal zone, where an area of 56,000 km2 supports productive commercially and recreationally important species (Keithly and Roberts, 2017). This region is also suffering the highest rates of wetland loss in the United States due to coastal erosion and relative sea level rise (SLR); the amount of land already lost between 1932 and 2016 is close to 5,000 km2 (calculated using data from Couvillion et al., 2017). Projected accelerated rates of SLR are expected to increase this loss in the future (IPCC, 2014). To mitigate this decline, coastal protection and restoration projects are being planned and implemented. The 2017 Louisiana Coastal Master Plan (CMP) is the latest plan in an adaptive management approach that provides a list of projects that build or maintain land and protect coastal communities (CPRA, 2017). The restoration measures that are implemented or proposed to be employed in the CMP have been selected using an extensive simulation process, using multiple models that determine the effect of all projects on, e.g., land building, water quality, vegetation growth, and coastal flooding, under three different future scenarios that vary SLR, hurricane frequency and intensity, precipitation patterns, and subsidence (rate of land compaction and sinking). Most models that support the CMP are actively linked within one framework, the Integrated Compartment Model (ICM; CPRA, 2017). The ICM simulates the effect of several proposed restoration and risk reduction projects, with a focus on building and maintaining land. Additional models during the plan development process were added to examine the effects of flood risk reduction projects. A planning tool that made use of simulation output—including economic considerations—informed the decisions of which restoration and protection projects to include in the CMP (CPRA, 2017).
Any changes in the coastal area have the potential to change the habitat suitability of the fish and shellfish that live in that area. We developed a new ecosystem model and coupled that to the ICM using an automated one-way coupling approach, which allowed us to simulate effects of the restoration and protection projects on the biomass and distribution of living marine resources within the Louisiana coastal area. ICM outputs used as environmental drivers include salinity, total Kjeldahl nitrogen (TKN), temperature, total suspended solids (TSS), and percent cover of marsh. With these linked models, we addressed the following research questions: (1) How does the biomass and spatial distribution of economically and ecologically important fisheries species change with the implementation of the Louisiana CMP as compared to a future without action (FWOA)? and (2) How does SLR affect these species in a future with and without restoration over 50 years?
The ecosystem model developed to this purpose is an Ecospace model built within the Ecopath with Ecosim (EwE) software, representing the local food web with 55 groups. EwE is an open source ecosystem modeling software, originally developed by Polovina (1984) to model trophic interactions and to estimate mean annual biomass on a Hawaiian coral reef ecosystem. The Ecosim and Ecospace components were developed later (Walters et al., 1997, 2000). The utility of the model has expanded from investigating changes in mean annual biomass of fish species to operational ecosystem management approaches such as investigations into combined effects of fishing impacts and environmental drivers (Coll et al., 2016; De Mutsert et al., 2016; Hernvann et al., 2020) and marine protected area placement and environmental drivers (Dahood et al., 2020), environmental impact studies (Raoux et al., 2018), and spatial–temporal modeling for marsh restoration effects on fish species (De Mutsert et al., 2017).
To identify how the restoration and protection projects selected for the 2017 CMP differentially affect living marine resources from changes occurring over 50 years under different rates of SLR, an FWOA scenario was simulated as well. Both the CMP and the FWOA were simulated under three future SLR projections (Meselhe et al., 2017); here we show output from the “high” and “low” SLR projections (details of these two projections are provided in section “Materials and Methods”). By directly linking the models through an executable version of Ecospace (the EwE Console), we evaluate effects of proposed projects on biomass and distribution of living marine resources within the estuaries under two different SLR scenarios. This information provides managers and other stakeholders with a fuller picture of trade-offs that are part of the decision-making process, a better understanding of what to expect when selected projects are implemented, and estimates how different SLR projections can affect the outcome.
Materials and Methods
Study Area and Model Domain
The model domain encompasses all of the Coastal Study Areas (CSAs) as defined by the Louisiana Department of Wildlife and Fisheries (LDWF., 2002; Figure 1). In this paper, we focus on a subset of these basins, the Pontchartrain, Breton, Birdsfoot, and Barataria regions (highlighted in color in Figure 1). We chose this area because it includes most large sediment diversion projects (Supplementary Table S1) proposed in the 2017 CMP, which, in similar models, have been shown to affect fish distributions over both short and long time intervals (De Mutsert et al., 2017).
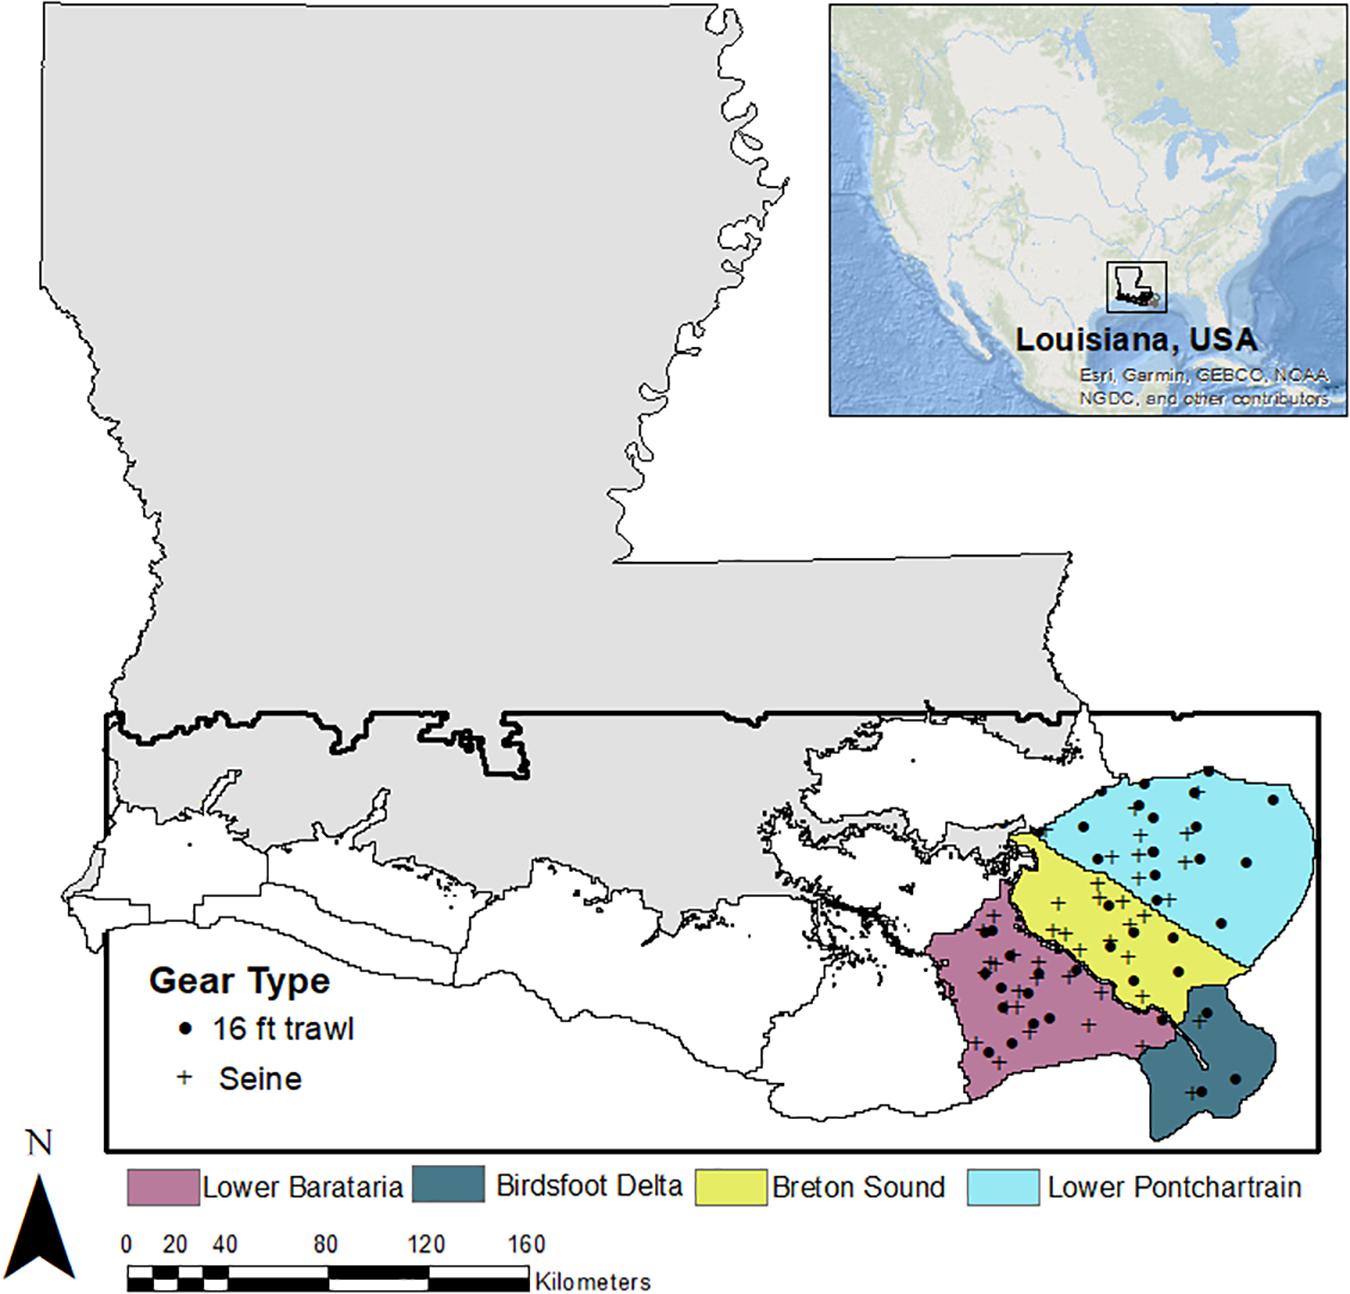
Figure 1. Model domain for the ICM and CMP Ecospace model (area within the black box). Each color represents a different Coastal Study Area (CSA) within the model domain; dark gray CSAs are excluded from this analysis. Symbols represent the sampling locations of fish surveys that are used for CMP Ecospace model development and calibration.
The Integrated Compartment Model
The ICM is a suite of dynamic landscape models that simulate coastal wetland hydrology, vegetation cover, and wetland elevation change across the Louisiana coastal zone. Hydrologic and hydraulic calculations are performed in a link-node model that calculates daily water levels, salinity concentrations, and sediment deposition and resuspension at 946 calculation nodes within the model domain (Meselhe et al., 2013; White et al., 2018). The vegetation dynamics module determines a relative coverage of vegetation species at a given location based upon salinity and water level variability conditions during the warm growing season (May through August, for details, see Visser and Duke-Sylvester, 2017). Within the wetland elevation model, simulated sediment deposition rates in open water bodies are used to calculate annual rates of shoaling, and vertical accretion of the marsh surface is calculated from deposition rates of mineral sediments on the marsh surface in conjunction with marsh type-specific organic matter accretion rates to calculate annual total vertical accretion of marsh areas (Couvillion and Beck, 2013; White et al., 2017). The vertical accretion component of the wetland elevation change model is counteracted by subsidence rates of assumed future scenarios as well as assumed rates of global mean SLR (Meselhe et al., 2017; White et al., 2018), which result in relative SLR scenarios that may be greater or less than the simulated rates of vertical accretion. This results in a modeled wetland area that may experience greater inundation over the simulation period. If the inundation depth was persistently greater than a threshold depth, which varied by habitat type (Couvillion and Beck, 2013), or a low-salinity habitat type experienced a prolonged period of elevated salinity values, the wetland area would collapse into open water (Supplementary Table S2). As the modeled landscape changed due to deposition and erosion of sediment and the collapse and/or gain of land, the modeled representation of the landscape (depth of water bodies, width of flow pathways, elevation of marsh platform, etc.) was updated, resulting in a feedback between the hydrodynamic calculations, the vegetation response, and the wetland elevation changes. These feedbacks were modeled on an annual timestep, and annually updated maps of marsh cover were included in Ecospace simulations. Spatial output of salinity and temperature was read into Ecospace on a monthly basis during simulations to affect nekton distribution, and salinity, temperature, and TSS were read in on a daily basis to affect oyster survival and distribution. TKN was read into Ecospace on a monthly basis to affect primary production, which subsequently affected secondary production through food web interactions.
The CMP Ecospace Model
Ecopath Base Model
Ecopath is a virtual representation of an aquatic food web that models the flows and pools of biomass within that system and must be developed prior to using the other components of the modeling suite (i.e., Ecosim and Ecospace). The Ecopath model assumes conservation of mass over a year by satisfying two master equations. The first equation describes the production of each functional group as a set of n linear equations for n groups:
where is the production to biomass ratio for group i, EEi is the ecotrophic efficiency (the proportion of production used in the system), Bi and Bj are the biomasses of the prey and predators, respectively, is the consumption to biomass ratio, DCji is the fraction of preyi in predator j’s diet, Yi is the catch rate for the fishery for group i, Ei is the net migration rate, and BAi is the biomass accumulation for group i.
Energy balance within each group is ensured with the second master equation:
where production can be described as:
Which can be described in function notation by the following equation:
where Pi is the production of prey group i, Qjis the consumption of predator j, DCji is the diet composition contribution of i to j’s diet (by weight, not energy), Fi is the instantaneous rate of fishing mortality, NMi is the net migration rate of prey group i, BAi is the biomass accumulation rate for i, M0i is the other mortality rate for i (non-predation, non-fishery), and Bi is the biomass of i.
This Ecopath model characterizes the food web in the model area (Figure 1) in the year 2000. Fifty-five functional groups that represent life stages of species or guilds were defined (Table 1). Species of interest (due to their ecological or economic importance) were characterized with a juvenile as well as an adult life stage to better represent the ontogenetic changes through a species’ life history (Christensen and Walters, 2004). This multi-stanza approach consists of two or more groups in the model that are linked with a von Bertalanffy growth function. The consumer groups considered in this study include zoobenthos, zooplankton, nektonic shrimps and crabs, oysters, fishes, birds, and bottlenose dolphin. Estimates of initial biomass were obtained from the data sources indicated in Table 1. When available, we used mean biomasses calculated from 1995 to 2000 data collected in the Barataria, Breton Sound, and Lake Pontchartrain basins by the LDWF fisheries independent monitoring program (FIMP). In addition to initial biomass, consumption to biomass (Q/B) and production to biomass parameters (P/B) were entered for each group. Age in months was also provided for multi-stanza groups that depict that start of each life stage (i.e., age in month when the juvenile turns into an adult) and the von Bertalanffy k value (a curvature parameter that suggests how fast a fish will reach L8; von Bertalanffy, 1933). The values and sources for each of these parameters are indicated in Table 1.
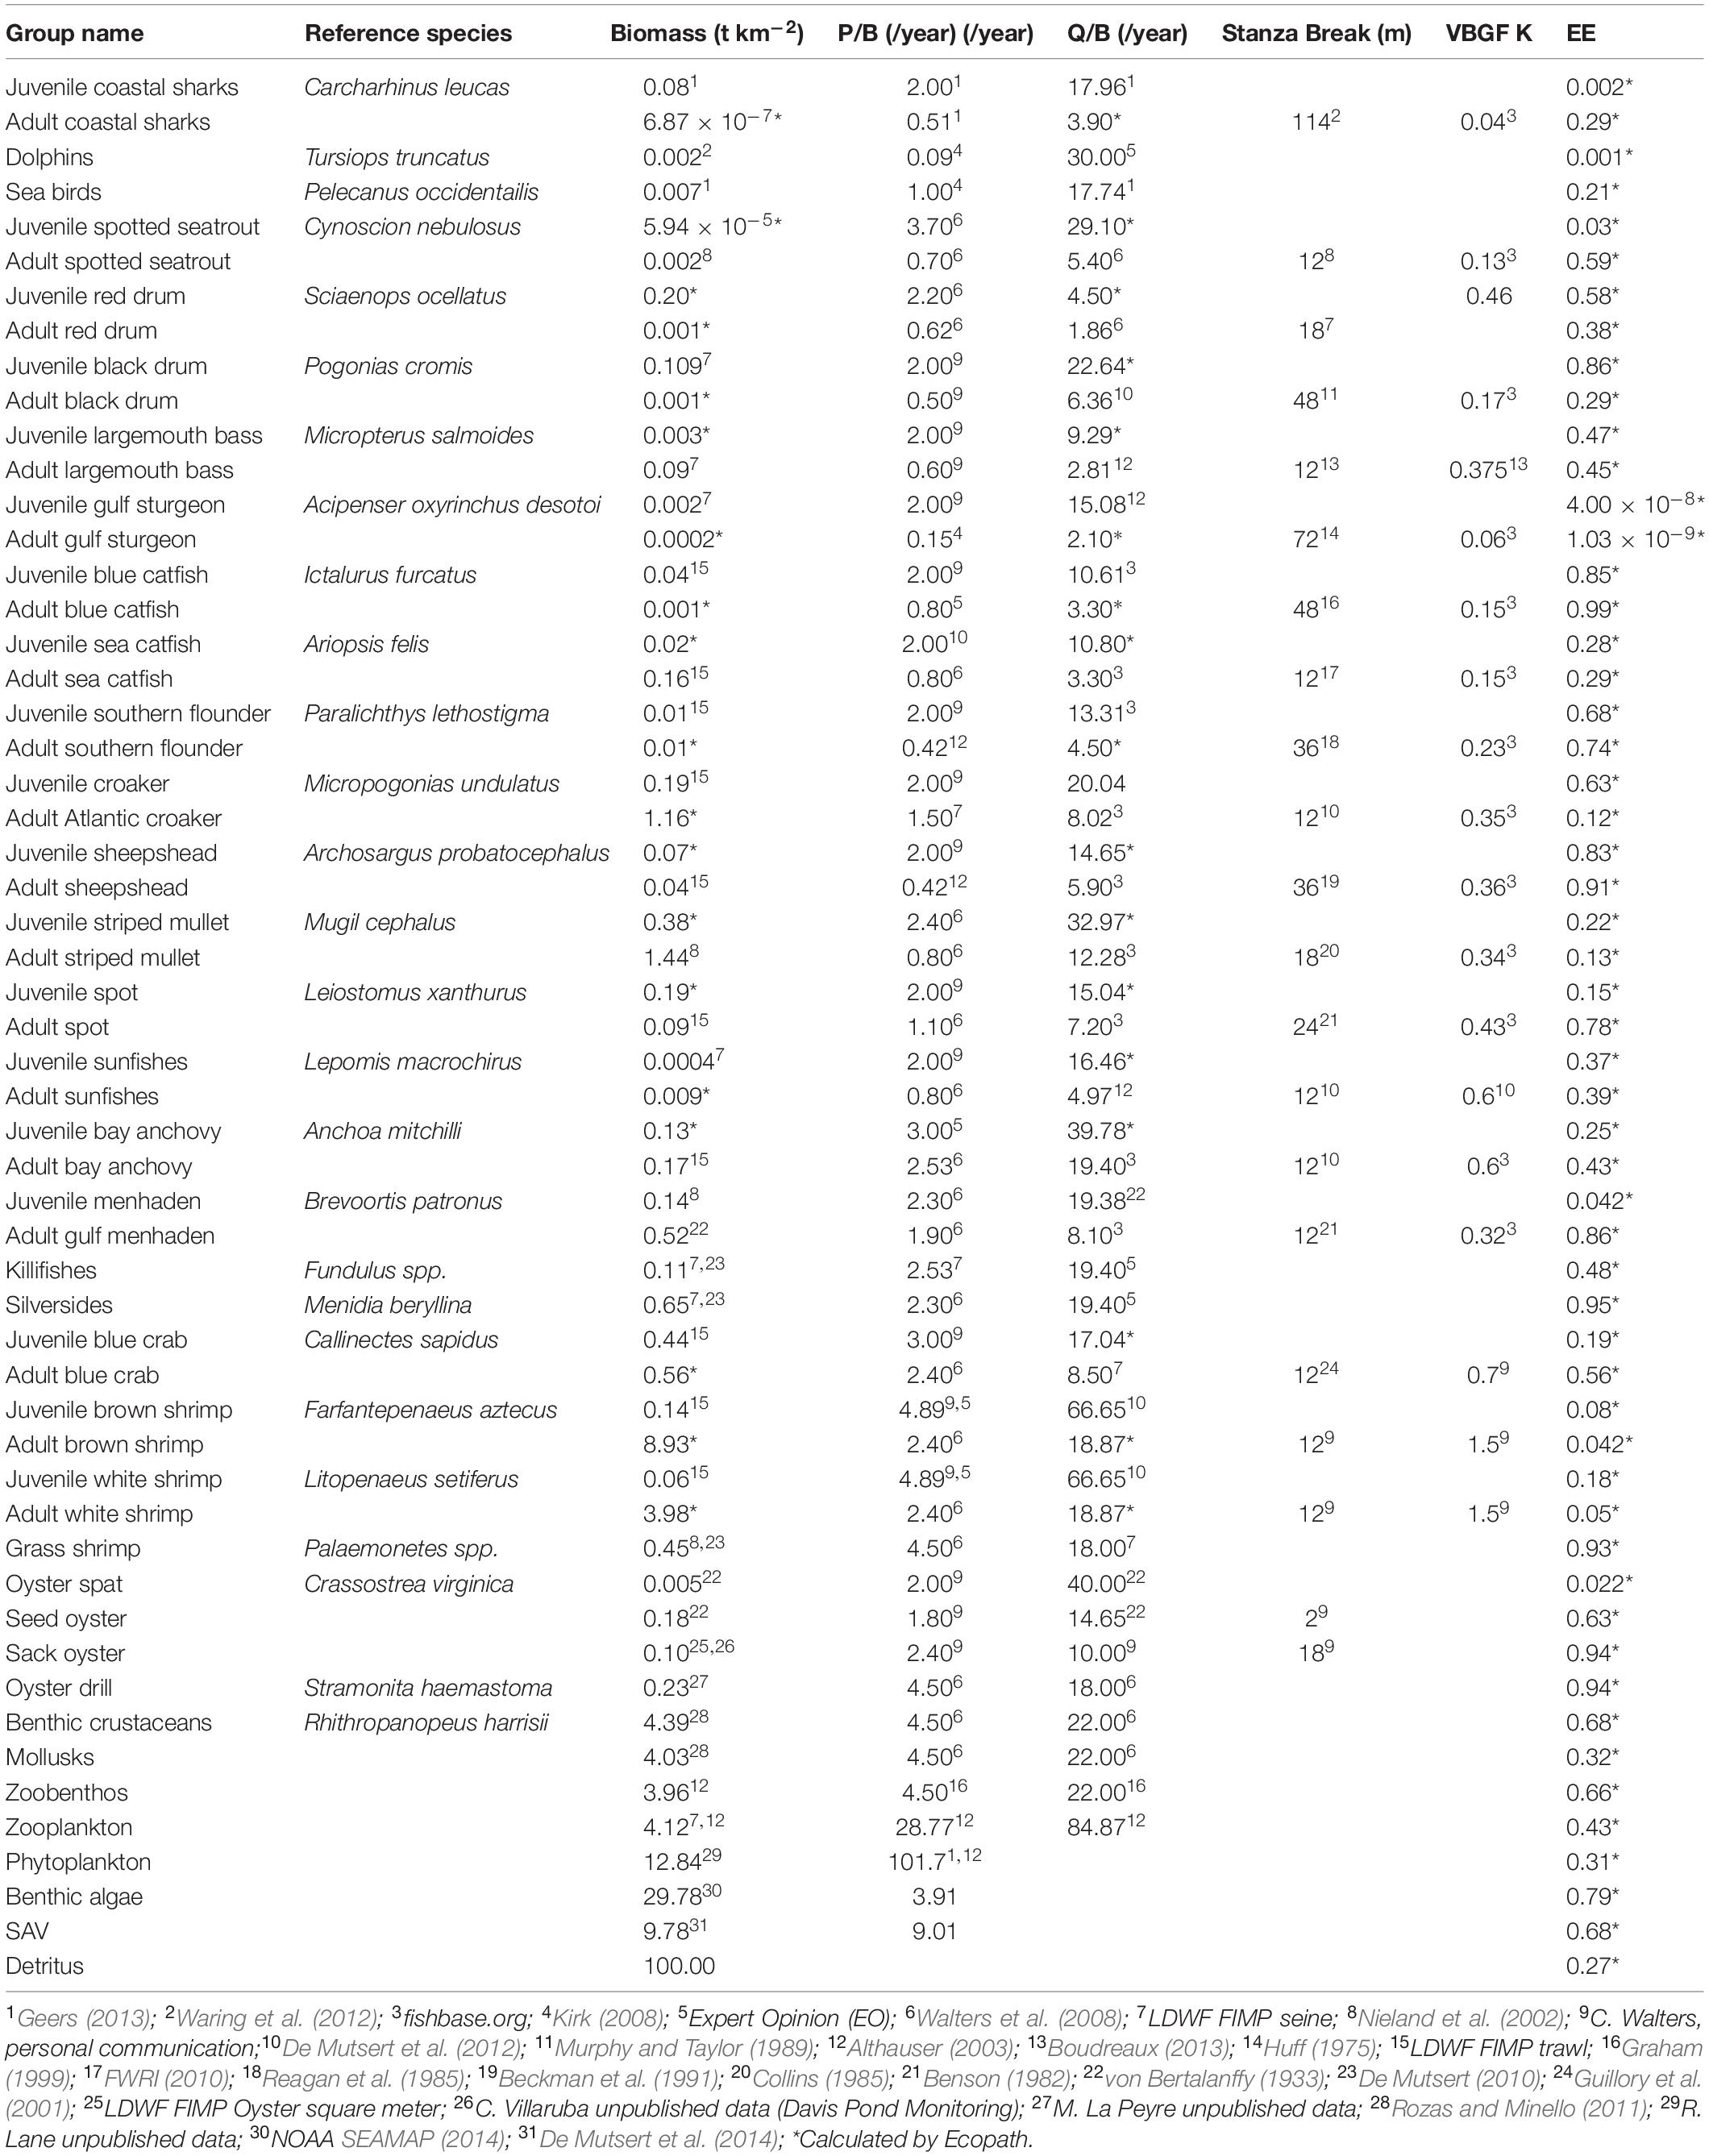
Table 1. Mass-balanced Ecopath parameters.
A diet matrix is used to link the trophic interactions among species in the model. The diet of each group consists of the proportional consumption of some combination of other groups in the model, summing to one. The diet composition was constructed from previously completed diet studies for each species. Using these proportional diets as a baseline, we constructed the matrix that was then iteratively adjusted as needed. That is, during the model balancing process, the diet matrix was adjusted within the bounds of what is reported in local diet studies and published stomach content analyses for each specific species (see Supplementary Table S3) to ensure a balanced flow of energy into and out of the system.
In addition to predation captured by the diet matrix, fishery removal plays a role in the mass-balancing process. Fisheries present in the ecosystem were added to the Ecopath model with commercial landings that were derived from the LDWF Trip Ticket data and recreational landings derived from NOAA’s MRIP program. The commercial fleets included in the Ecopath model are those targeting brown shrimp, white shrimp, blue crab, black drum, oysters, and menhaden. In addition to that, one recreational “fleet” was added, targeting adult spotted seatrout, adult red drum, adult black drum, adult largemouth bass, adult blue catfish, adult southern flounder, adult sheepshead, adult sunfishes, and adult blue crab. Bycatch of fleets was included in the model, based on estimates from Walters et al. (2008). If these inputs did not meet the mass balance assumption during model balancing procedures, the relatively uncertain discard values were iteratively reduced to meet those assumptions.
Model Calibration
The model was calibrated in Ecosim, which is the temporal dynamic module of EwE. Ecosim re-expresses the system of linear equations from Ecopath as a system of coupled differential equations to predict future outcomes:
where gi is the net growth efficiency; Ii is the biomass immigration rate; Mi is the non-predation mortality rate; Fi is the fishing mortality rate; ei is the emigration rate; and Cij can be considered the “flow” from pool i to pool j organisms as a function of time—the consumption rate of type i biomass pool by type j biomass pool.
During model calibration, biomass and landings output of groups in the model were fitted to observed biomass data, landings data, and fishing effort, for each group for which we had such data available (see Supplementary Table S4 for data sources). Spatially averaged ICM output of TKN, salinity, and temperature was included as environmental drivers. Model fitting in Ecosim adjusts the vulnerability exchange rate to predation until the best fit to observed data is found. During the fitting procedure, the vulnerability exchange rates were adjusted until the model with the lowest sum of squared deviations (SS) of the observed logarithmic (log) biomass values and AIC values was found, which is the model that best recreates historical patterns of biomass (Christensen et al., 2008). Model calibration was completed for annual observed data of biomass (fishery independent data) and catch (fishery dependent data) of species for which data were available for the 14-year simulation (2000–2013; Figure 2) using the same procedures as used in De Mutsert et al. (2017). Additional goodness of fit metrics, including %RMSE, PBIAS, and r, were calculated for catch and biomass after calibration (Supplementary Table S5).
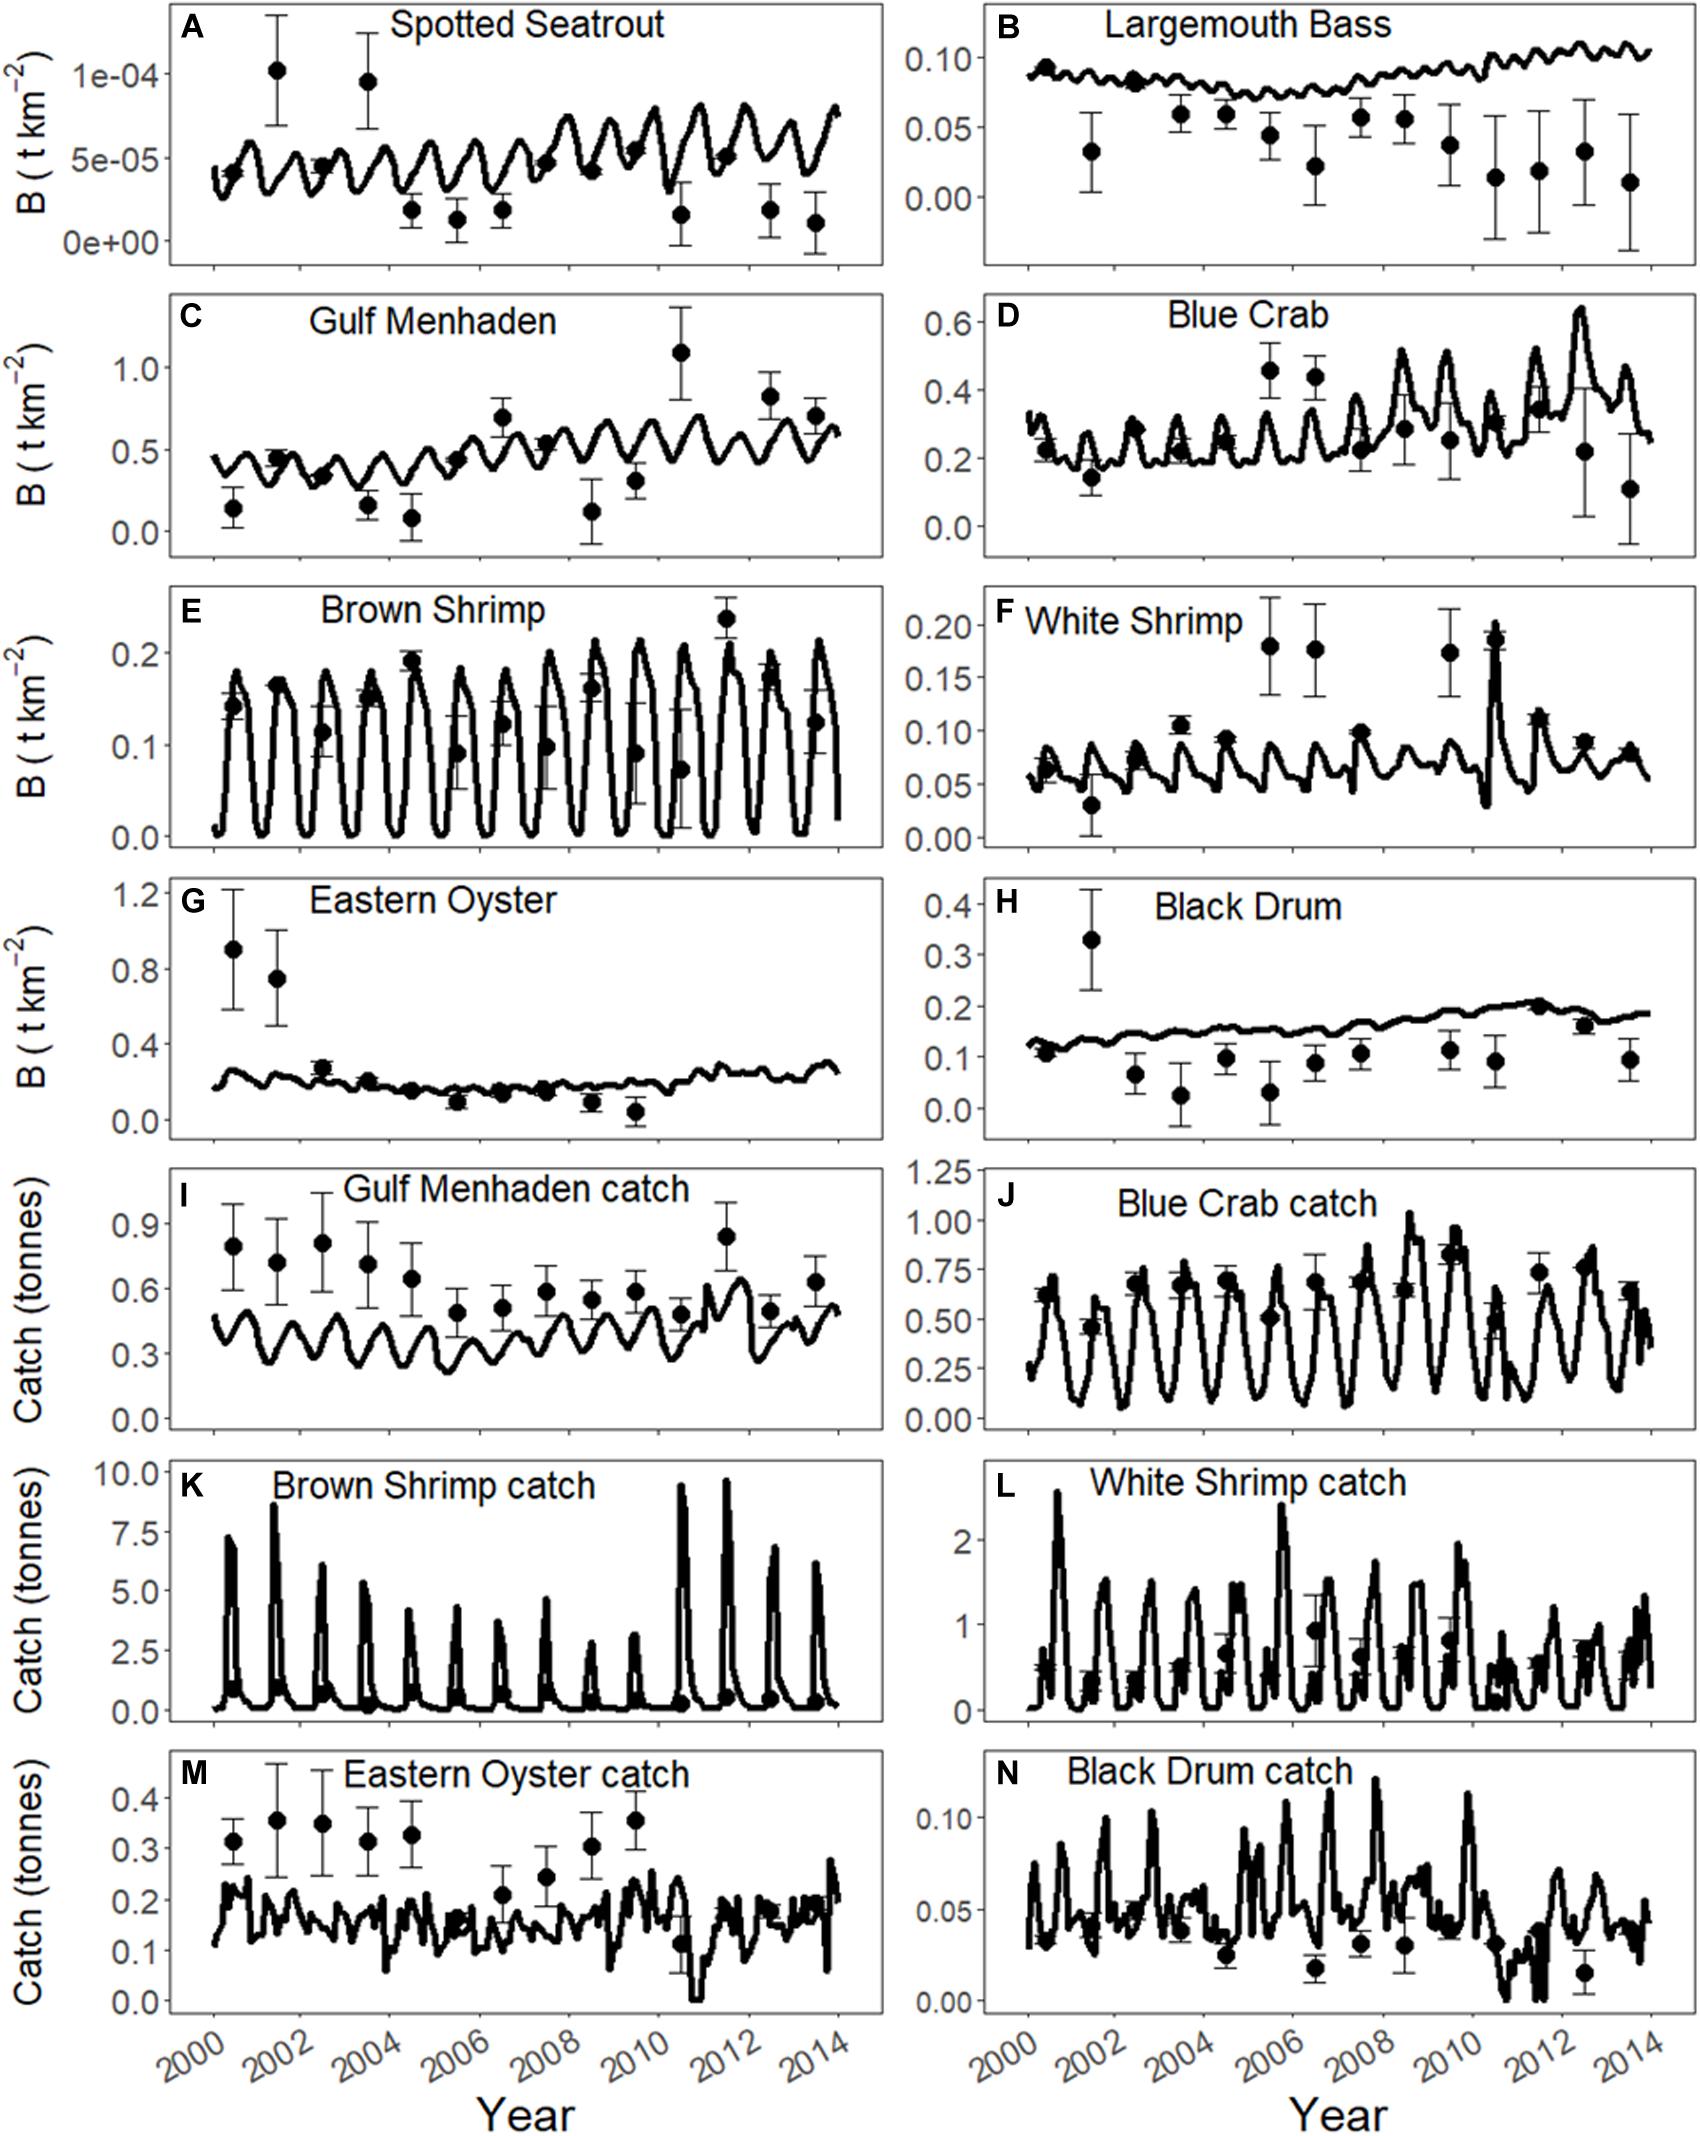
Figure 2. Biomass (B, t km−2) and catch (tonnes) calibration fits to annual biomass observations and annual landings data respectively. Error bars indicate the standard error of the observations. Biomass observations reflect coastwide averages based on collections at stations indicated in Figure 1. (A) Spotted Seatrout, (B) Largemouth Bass, (C) Gulf Menhaden, (D) Blue Crab, (E) Brown Shrimp, (F) White Shrimp, (G) Eastern Oyster, (H) Black Drum, (I) Gulf Menhaden catch, (J) Blue Crab catch, (K) Brown Shrimp catch, (L) White Shrimp catch, (M) Eastern Oyster catch, (N) Black Drum catch.
Ecospace
In the CMP Ecospace model, the same set of differential equations applied in Ecosim is applied in every grid cell over a georeferenced base map (Walters et al., 1997; Christensen et al., 2008). The model domain presented above is included as a base map with 1 km2 grid cells totaling 58,079 cells; the subset of basins we focus on in this study totals 21,363 cells. Cells are connected through movement of groups and fleets as described in Walters et al. (1999), while environmental parameters affect biomass and movement of groups using the habitat capacity model as described in Christensen et al. (2014).
Maps of the environmental drivers affect all fish groups in the model as determined by response curves (see Figure 3 for the curves of the species discussed in this paper). Response curves were derived by plotting LDWF FIMP catch data of groups in the model versus salinity and temperature. The trapezoidal shape of the curves was decided upon to reflect tolerance ranges rather than having one optimum salinity or temperature value, which is what a binomial curve would suggest. The response curve of marsh cover was derived from Minello and Rozas (2002), and only applied to juvenile life stages of nekton species. Of the drivers, salinity and temperature were loaded monthly, while percent cover of marsh was loaded annually during a model run. TKN was used as a relative primary productivity driver to affect primary producers and was loaded monthly. Oysters were affected by daily salinity, temperature, and TSS through oyster environmental capacity layers (OECLs) as described in De Mutsert et al. (2017). In short, the capacity of oysters to grow in a certain model cell in 1 month is determined by daily levels of salinity, temperature, and TSS in that month in combination with response curves; this creates one OECL. These OECLs are then loaded monthly into Ecospace to affect oyster biomass. One habitat map was added for oysters, which describes the % cultch (oyster rubble on which spat can settle) in each model cell. This addition was important to simulate oyster distribution, as oysters only settle on cultch. All environmental driver maps except for % cultch were output from the ICM. The CMP Ecospace model received these driver values for each grid cell from the ICM through one-way coupling to the ICM as described below.
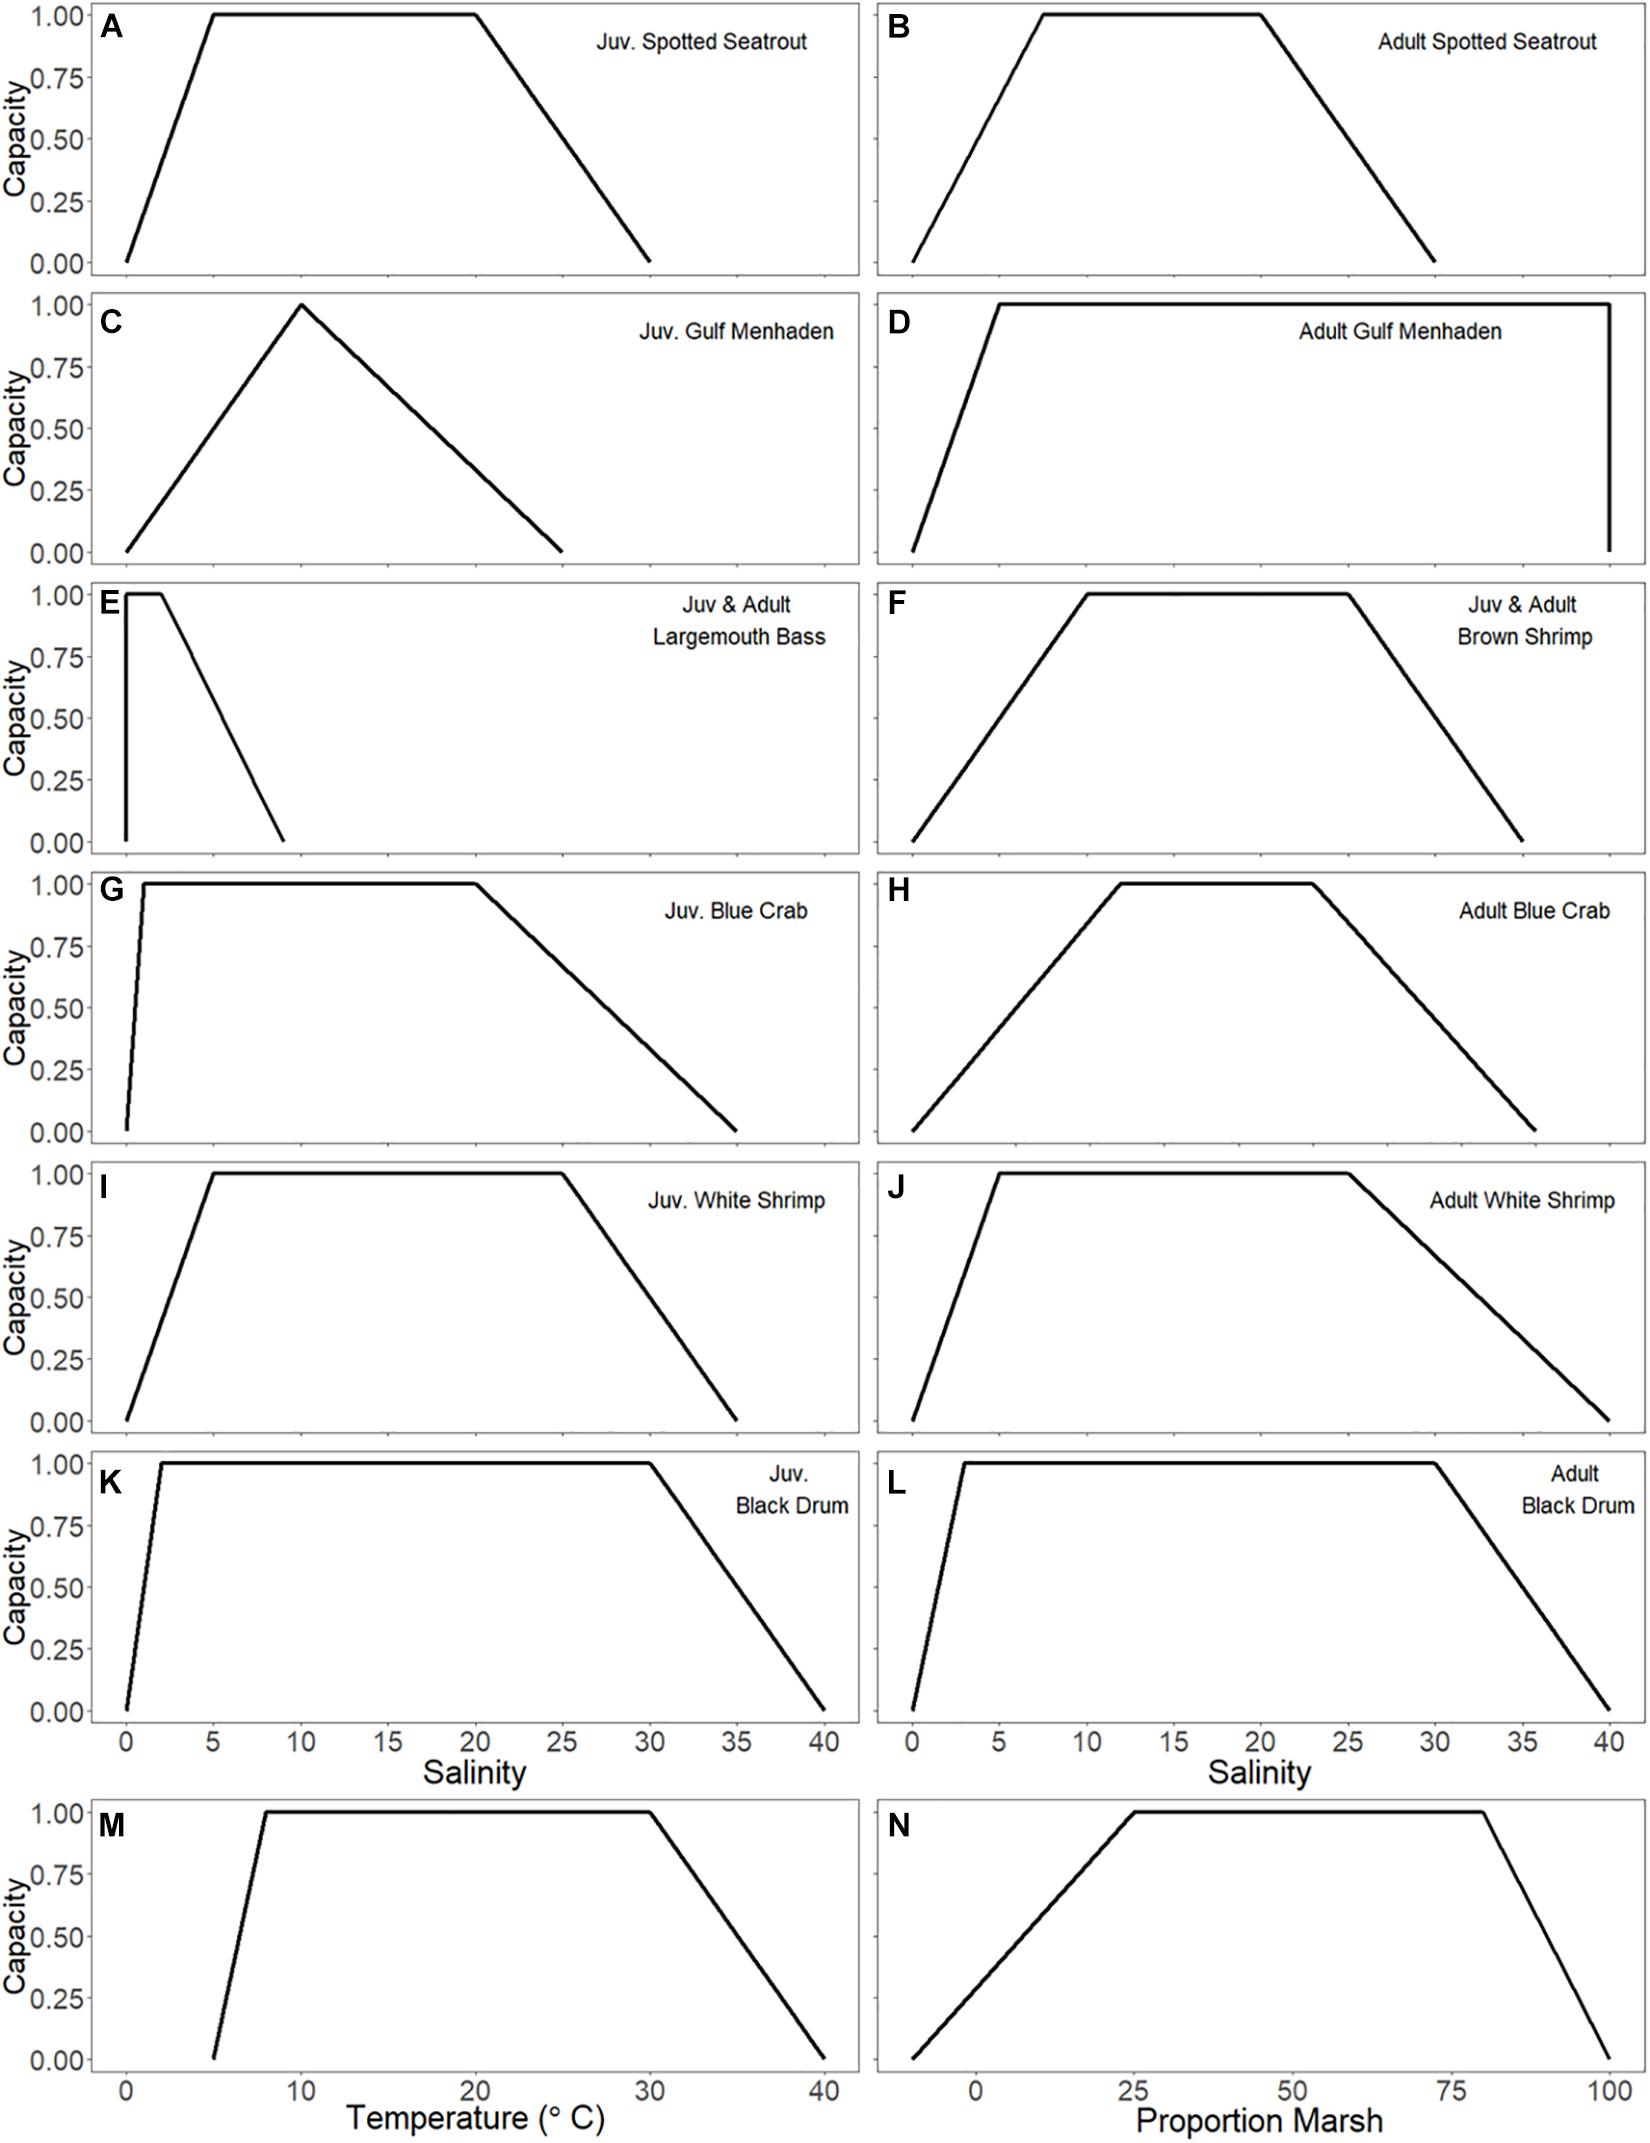
Figure 3. (A–L) Habitat capacity (y-axis) in response to salinity (x-axis) makes up the salinity response curves for the juvenile and adult life stages of model groups. Seven species of interest are shown. (M) Temperature response curve applied to all species in the model. (N) Marsh response curve (derived from Minello and Rozas, 2002) applied to all juvenile life stages of nekton species in the model.
Model Coupling
The ICM provides an overarching framework to link specialized models with varying input and output formats into a single modeling suite. For a model to be included in the ICM suite, it must be configurable and run via an automated interface, without human intervention. The EwE Scientific Interface requires an operator to load, configure, and run an Ecosim and Ecospace scenario. To include Ecospace within the ICM modeling framework, we developed a new Ecospace console application that can be configured via a text file supplied to the command line of the console application. The EwE software uses a modular design, with each model component contained in a set of dynamic linked libraries (.dll’s). This architecture allows the new command line version of Ecospace to use the same code libraries and plugins as the EwE Scientific Interface. This customized version of Ecospace is different from the free open-access EwE software and can be attained through collaboration with the Ecopath International Initiative.
The ICM could then include Ecospace within its modeling suite. For each Ecospace input variable of interest (i.e., salinity, temperature), the ICM created input grid files in ESRI’s non-proprietary ASCII format from the output of other models in the ICM chain. The EwE Spatial Temporal Framework could then be configured to read these .asc grid files as inputs to drive the Ecospace habitat capacity model (see Supplementary Figure S1 for a diagram of the coupling framework).
Coastal Master Plan Environment
The ICM was used to simulate, across a variety of environmental scenarios, two potential futures: FWOA and CMP. Both simulations were initialized with data that represented the 2014 landscape configuration and included any additional restoration projects that were currently under construction or permitted (CPRA, 2017). The FWOA simulations did not have any additional restoration or risk reduction projects added to the landscapes during the simulations, whereas the CMP simulations included a portfolio of habitat restoration and hurricane and storm surge risk reduction projects implemented sequentially throughout the 50-year simulations. The projects were implemented in phases and were placed throughout the entire Louisiana coastal zone. Project types that were included in the plan were: marsh creation, sediment diversion, ridge restoration, shoreline protection, hydrologic restoration, and structural hurricane protection (e.g., levees, floodwalls, and floodgates). Of the 121 projects implemented in the CMP simulations (see Supplementary Table S1 for all projects), 54 were located east of Bayou Lafourche and would likely have some impact on the fisheries model output in the Pontchartrain, Breton, and Barataria regions, which is the focus of this analysis (Figure 4).
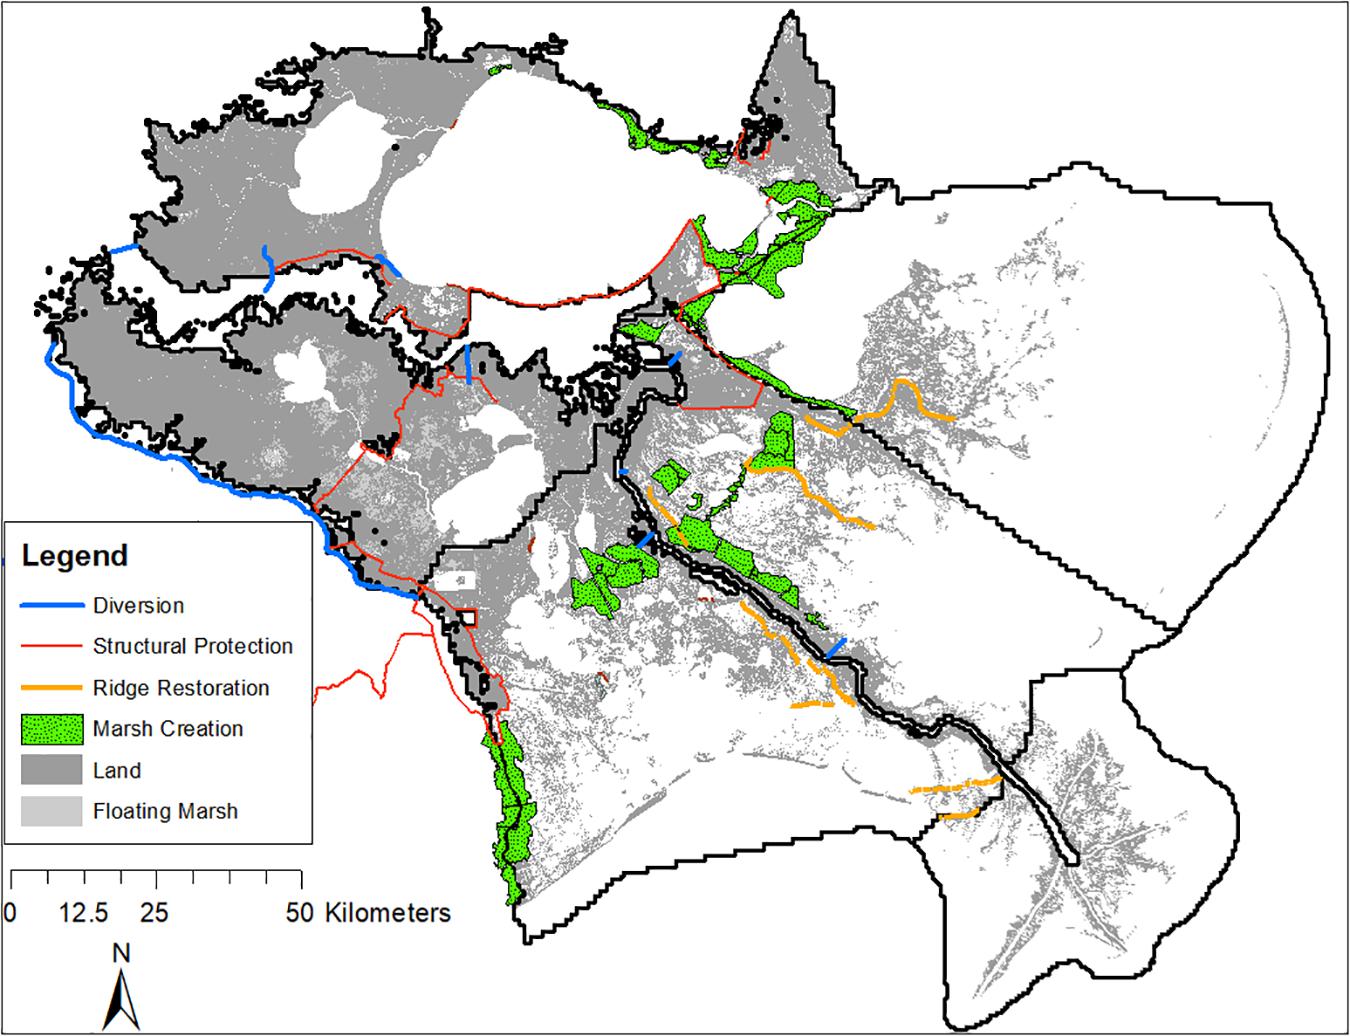
Figure 4. Restoration projects included in the approved 2017 Louisiana Coastal Master Plan specific to our focal area of the Pontchartrain, Breton, Birdfoot, and Barataria regions.
Marsh creation projects are placed on the landscape and immediately result in an increase of functional marsh habitat within the project footprint; they also impact the flow pathways within the region and therefore may have secondary impacts upon water levels, salinities, sediment dynamics, and other hydrodynamic variables. The first two marsh creation projects within the Pontchartrain, Breton, and Barataria regions of the model domain were implemented in year 4 and year 5, 14 marsh creation projects were implemented between years 15 and 19, and three additional marsh creation projects were implemented in years 34, 37, and 39. Ridge restoration projects are implemented in a similar manner; however, the feature alignments are more linear in nature, follow historic ridges, and have design elevations considerably higher than the marsh creation projects. Five ridge restoration projects were implemented in year 5 in the eastern portion of the domain, and three additional ridges were restored in year 15.
Hurricane protection projects consist of levees, floodwalls, and floodgates at strategic locations surrounding some of the more populous regions of the model domain. Floodgates are included in the model with an operational logic that will shut the floodgates if downstream water surface elevations are above a specified elevation threshold. These elevation thresholds do not change through time (as mean sea levels are higher) and there is no logic in place to operate them solely during hurricane conditions. Therefore, during later decades under the higher SLR scenarios, the operation of the floodgates is more frequent. Most of the hurricane protection projects within the Pontchartrain, Breton, and Barataria regions are on the periphery of wetland and estuary habitats. However, two projects in these regions, the Lake Pontchartrain Barrier and the Upper Barataria Risk Reduction projects, do bisect large portions of potential non-urban habitat. These projects are implemented in the CMP in years 7 and 11, respectively.
In addition to the project types listed above, there are also several sediment and freshwater diversion projects implemented in the Pontchartrain, Breton, and Barataria regions. These projects aim to re-connect historic flow pathways (hydrologic restoration) or to re-introduce sediment-laden, nutrient-rich, and low-salinity Mississippi River water to the estuary and wetland systems surrounding the Mississippi River Delta. The magnitude of the re-introduced flow in these projects varies; however, they are located along the Mississippi River from upstream of Blind River (Union diversion) to several miles downstream of the termination of the east-bank river levee in Bohemia (the lower Breton diversion). One diversion (the Ama diversion) is implemented in year 19; the remaining eight diversions are implemented in either year 7 or year 9.
The remainder of the CMP projects implemented in the Pontchartrain, Breton, and Barataria regions consist of one hydrologic restoration project and seven shoreline protection projects. These projects are generally smaller in scale and are anticipated to have limited impact upon modeled fishery response.
Simulation Scenarios
We compared the effects on fish and shellfish biomass of having the CMP in effect over 50 years with those of an FWOA using a Wilcoxon rank test. We evaluated the differences in biomass and distribution of the species in our model by comparing these two future approaches. We focused on the results of eight economically important fisheries species, namely, spotted seatrout (Cynoscion nebulosus), largemouth bass (Micropterus salmoides), Gulf menhaden (Brevoortia patronus), blue crab (Callinectes sapidus), brown shrimp (Farfantepenaeus aztecus), white shrimp (Litopenaeus setiferus), eastern oyster (Crassostrea virginica), and black drum (Pogonias cromis). Both scenarios were run under two different future scenarios: one representing low levels of SLR projections (0.43 m/50 years) and one representing high levels of SLR projections (0.83 m/50 years; see Supplementary Table S6 for full climate scenario descriptions). The SLR scenarios were used to provide an estimate of uncertainty around the year 50 predictions. Results were analyzed per basin for four basins of interest as indicated in Figure 1: Lower Barataria, Breton Sound, Lower Pontchartrain, and the Birdsfoot Delta. Spatial distribution maps of model output were created using a GIS to visualize the differences between year 0 and year 50, under two different SLR scenarios, and with and without plan implementation. Two months are displayed: June and October. These two months are chosen as representative months where the largest difference in plan implementation response can be expected. A significant component of the CMP in the Mississippi River Delta is the implementation of large sediment diversions, which have a proposed and simulated flow regime that varies throughout the year as a function of flows in the Mississippi River (see De Mutsert et al., 2017 for a related diagram). The biggest diversion effects within EwE are expected to be found in early summer (e.g., June) when water diverted during the spring-time river flood has resulted in the lowest salinity and longest sustained sediment loading. There is an expected reversal in environmental conditions during the fall (e.g., October) when the river flows are traditionally at a minimum and the diversions are no longer operated due to the operational rules applied. Finally, the difference between the two future SLR scenarios was compared delta-wide by pooling the basins using a Wilcoxon rank test.
Results
The changes resulting from plan implementation are species-specific and basin-specific (Figure 5). In general, the eight species of interest we focus on had more biomass at the end of the 50-year simulation when the Coastal Master Plan was implemented as compared to an FWOA. We focused our comparisons on the juvenile life stages with two exceptions, because the species highlighted make most use of the estuaries of the Mississippi River Delta during that stage in their life. The exceptions were eastern oyster, for which we chose to display the sack oysters (adults) that occur within the model area, and spotted seatrout, another species that occurs in the estuaries during their adult life stage.
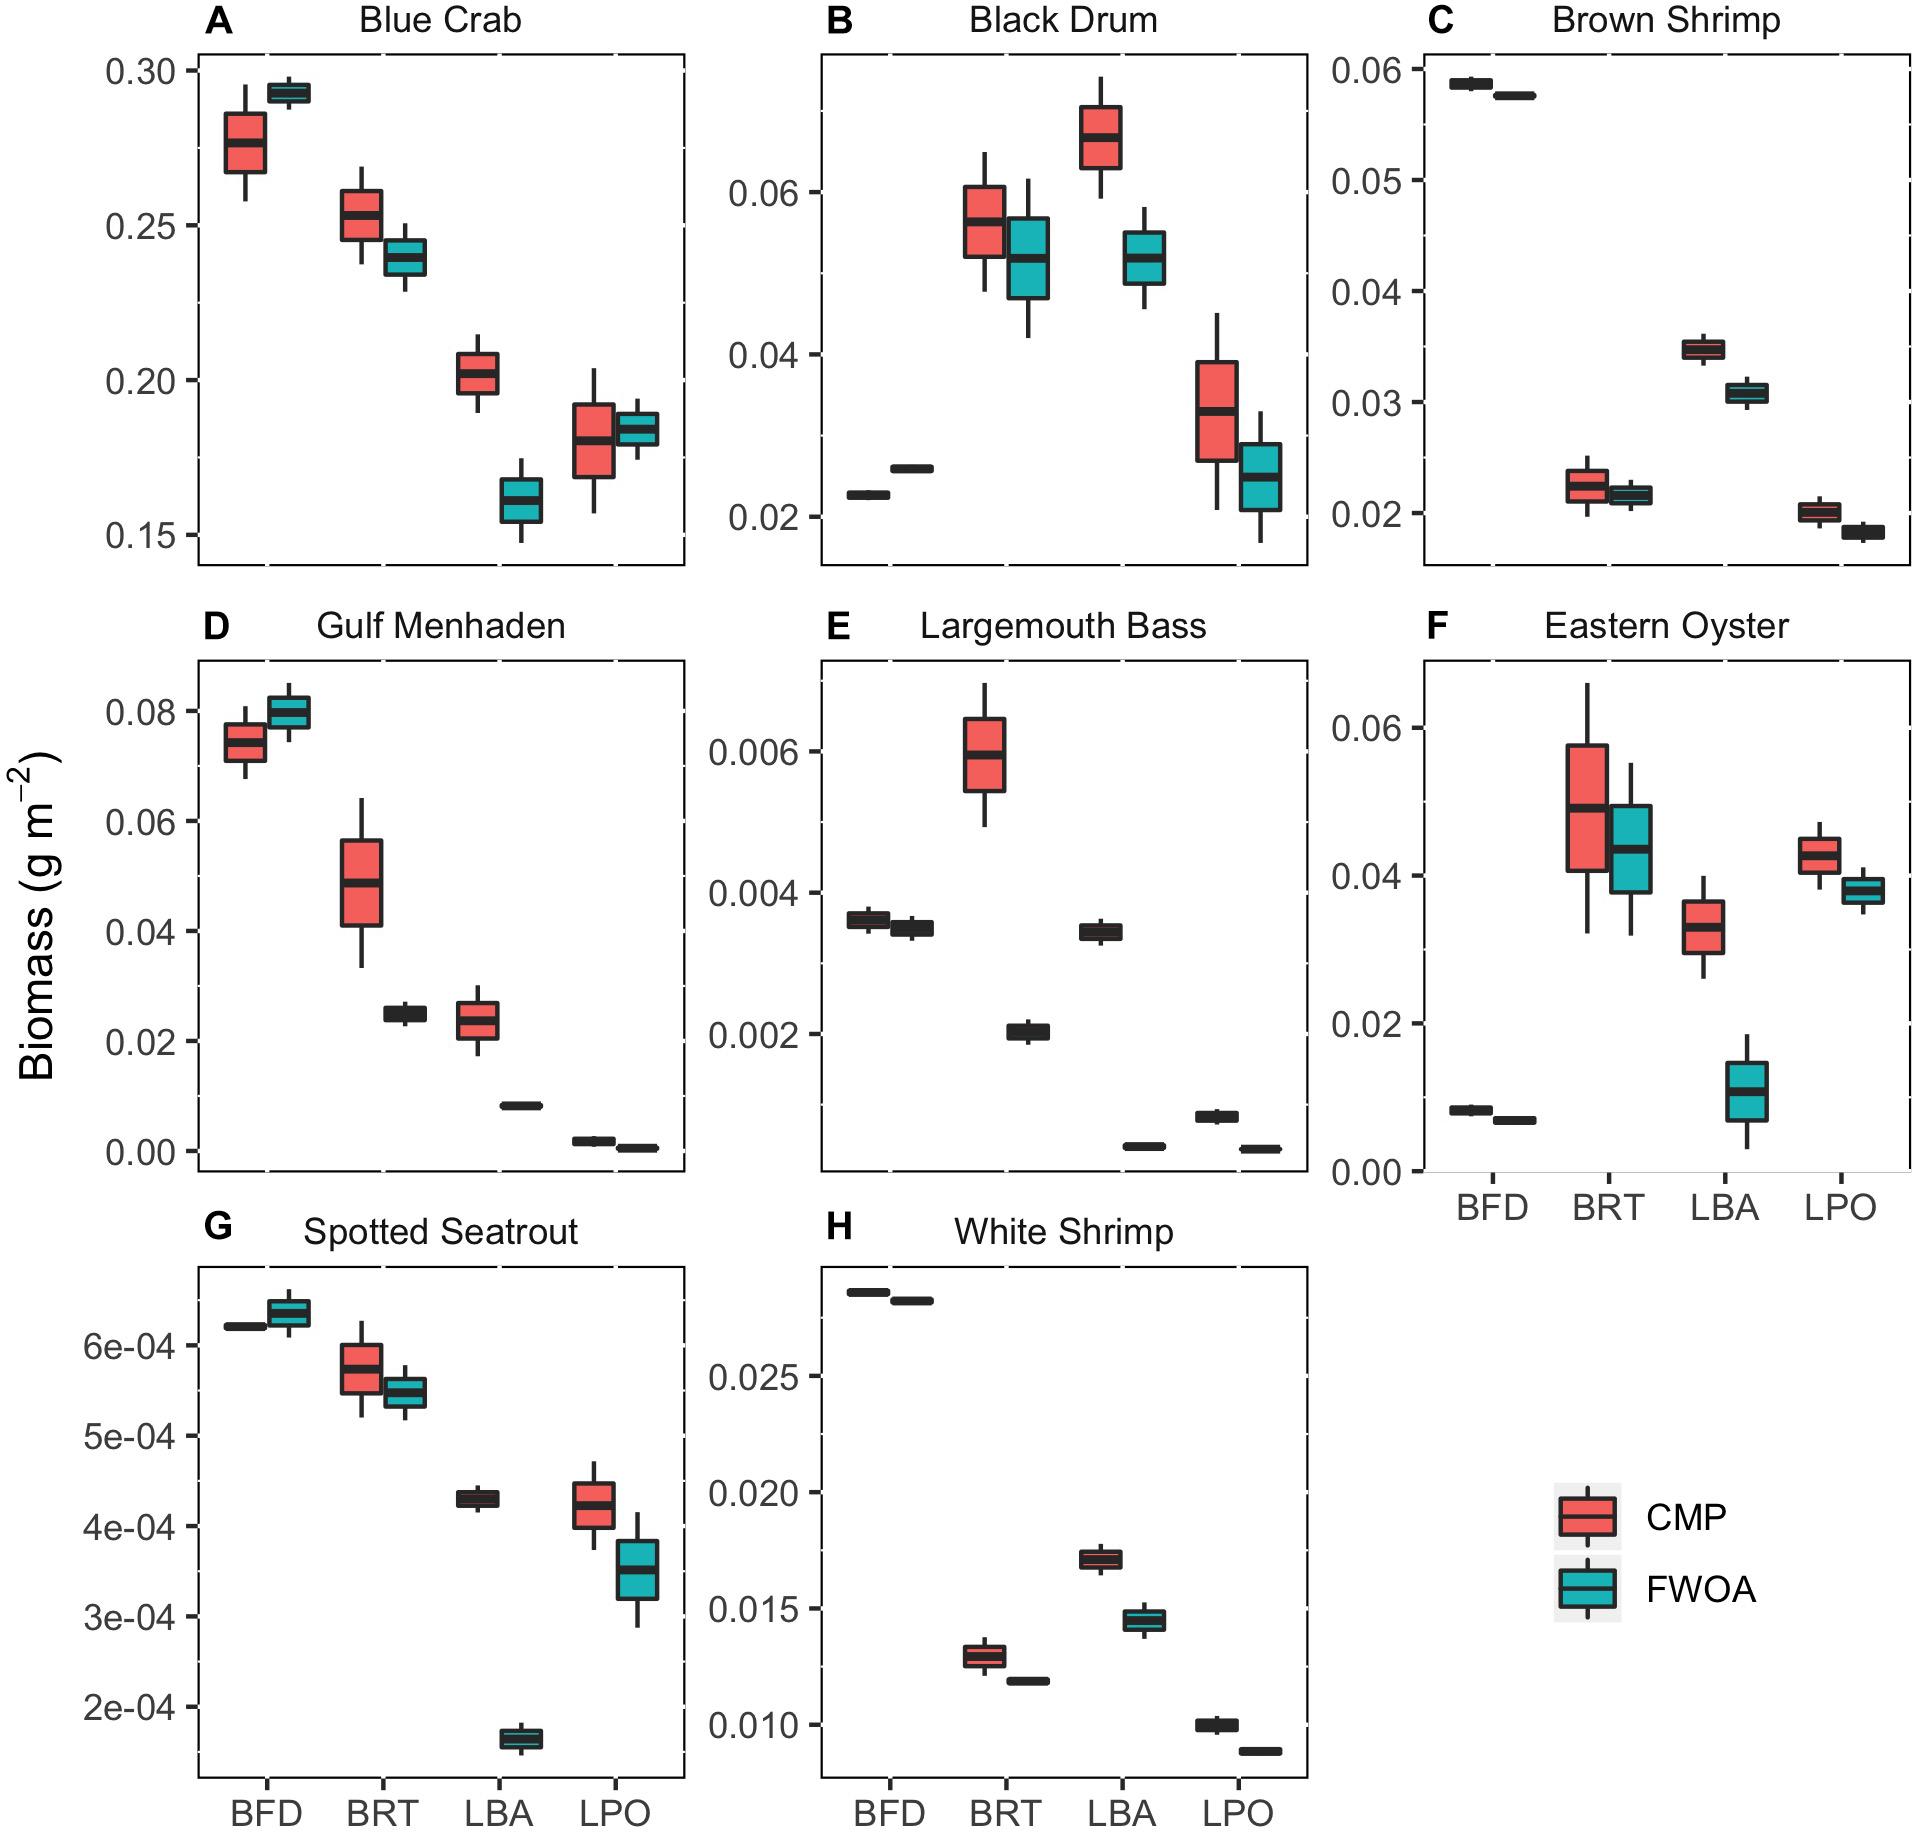
Figure 5. The biomass in simulation year 50 of eight species of economic interest in four different basins (BFD, Birdsfoot Delta; BRT, Breton Sound; LBA, Lower Barataria; LPO, Lower Pontchartrain) in coastal Louisiana after 50 years of Coastal Master Plan (CMP) implementation compared to a future without action (FWOA). The boxes in the box plots reflect the model output of two different SLR scenario simulations. (A) Blue Crab, (B) Black Drum, (C) Brown Shrimp, (D) Gulf Menhaden, (E) Largemouth Bass, (F) Eastern Oyster, (G) Spotted Seatrout, (H) White Shrimp.
Since we are comparing model output with the two SLR scenarios as “samples” (see Supplementary Table S6 for description of SLR scenarios), sample size for the Wilcoxon rank test was small and did not provide enough power to return significant differences. Rather, the SLR scenarios should be viewed as a visualization of the level of uncertainty in the response of living resources to CMP implementation in the face of uncertain future climate. The difference between biomass under the low and high SLR scenarios visualized with spatial distribution maps reveals the large effect the SLR scenario chosen has on the outcome (Figures 6–14). We will point out the difference in model output with and without plan implementation, but since we lack sufficient model output samples, we are unable to determine whether these differences are significant.
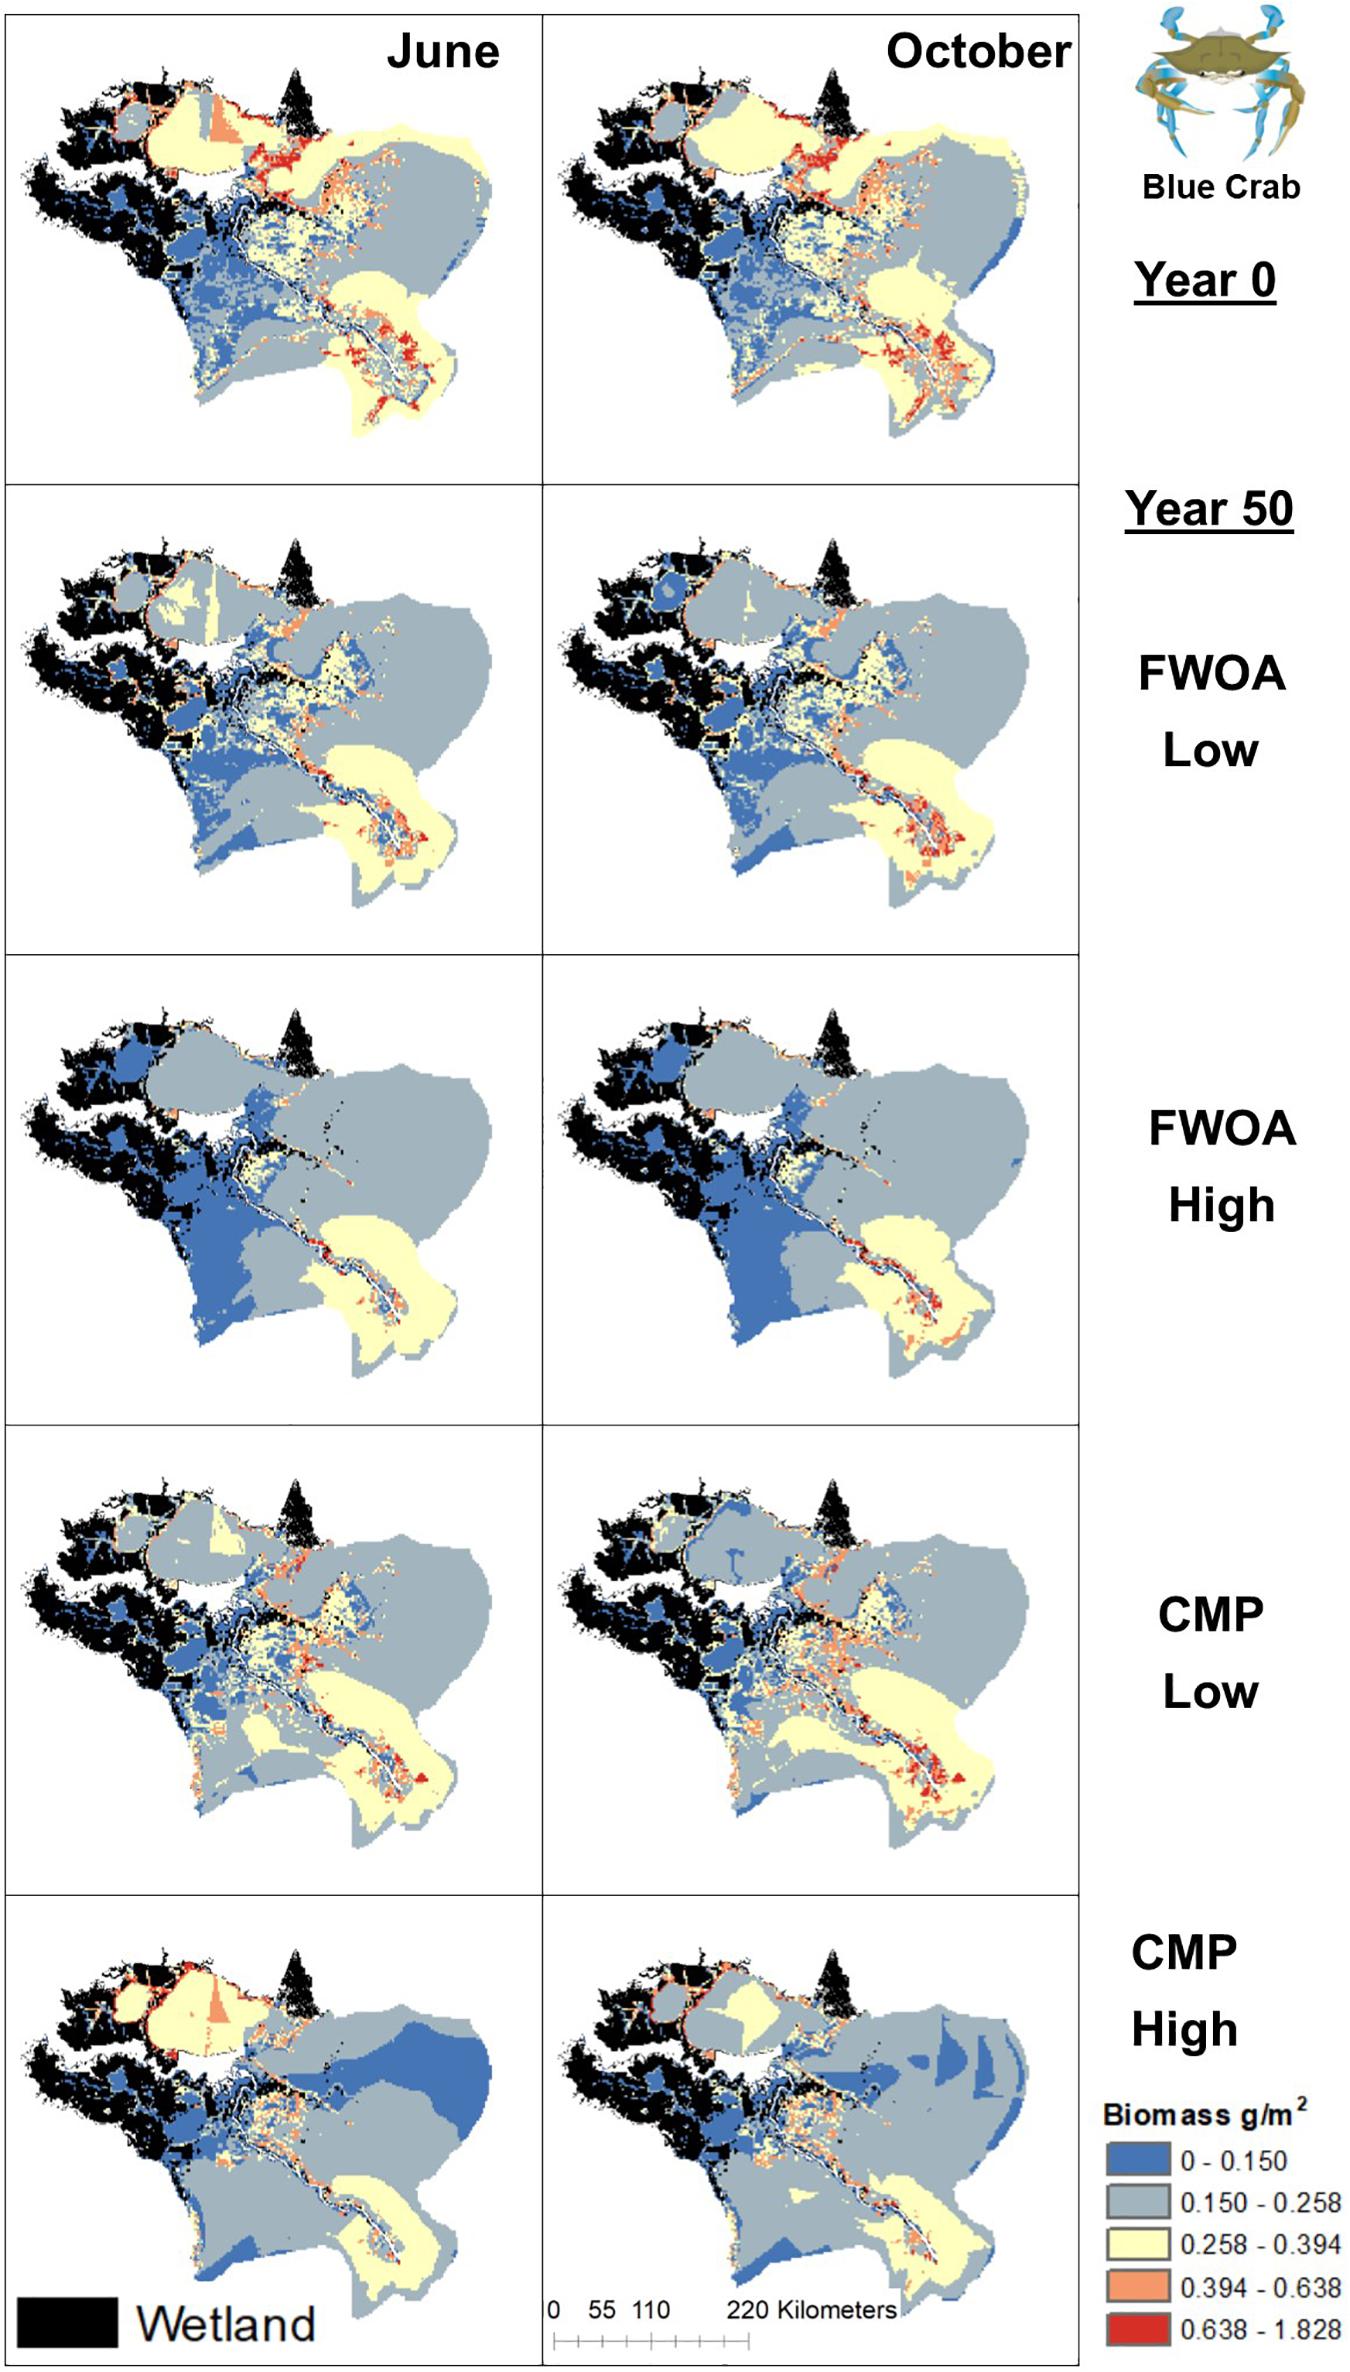
Figure 6. Spatial distribution of juvenile Blue Crab in different simulations. Output is shown from June and October in Year 0 and Year 50, under “Low” and “High” relative sea level rise (see Supplementary Table S6 for scenarios), and with Coastal Master Plan (CMP) implementation and without (FWOA).
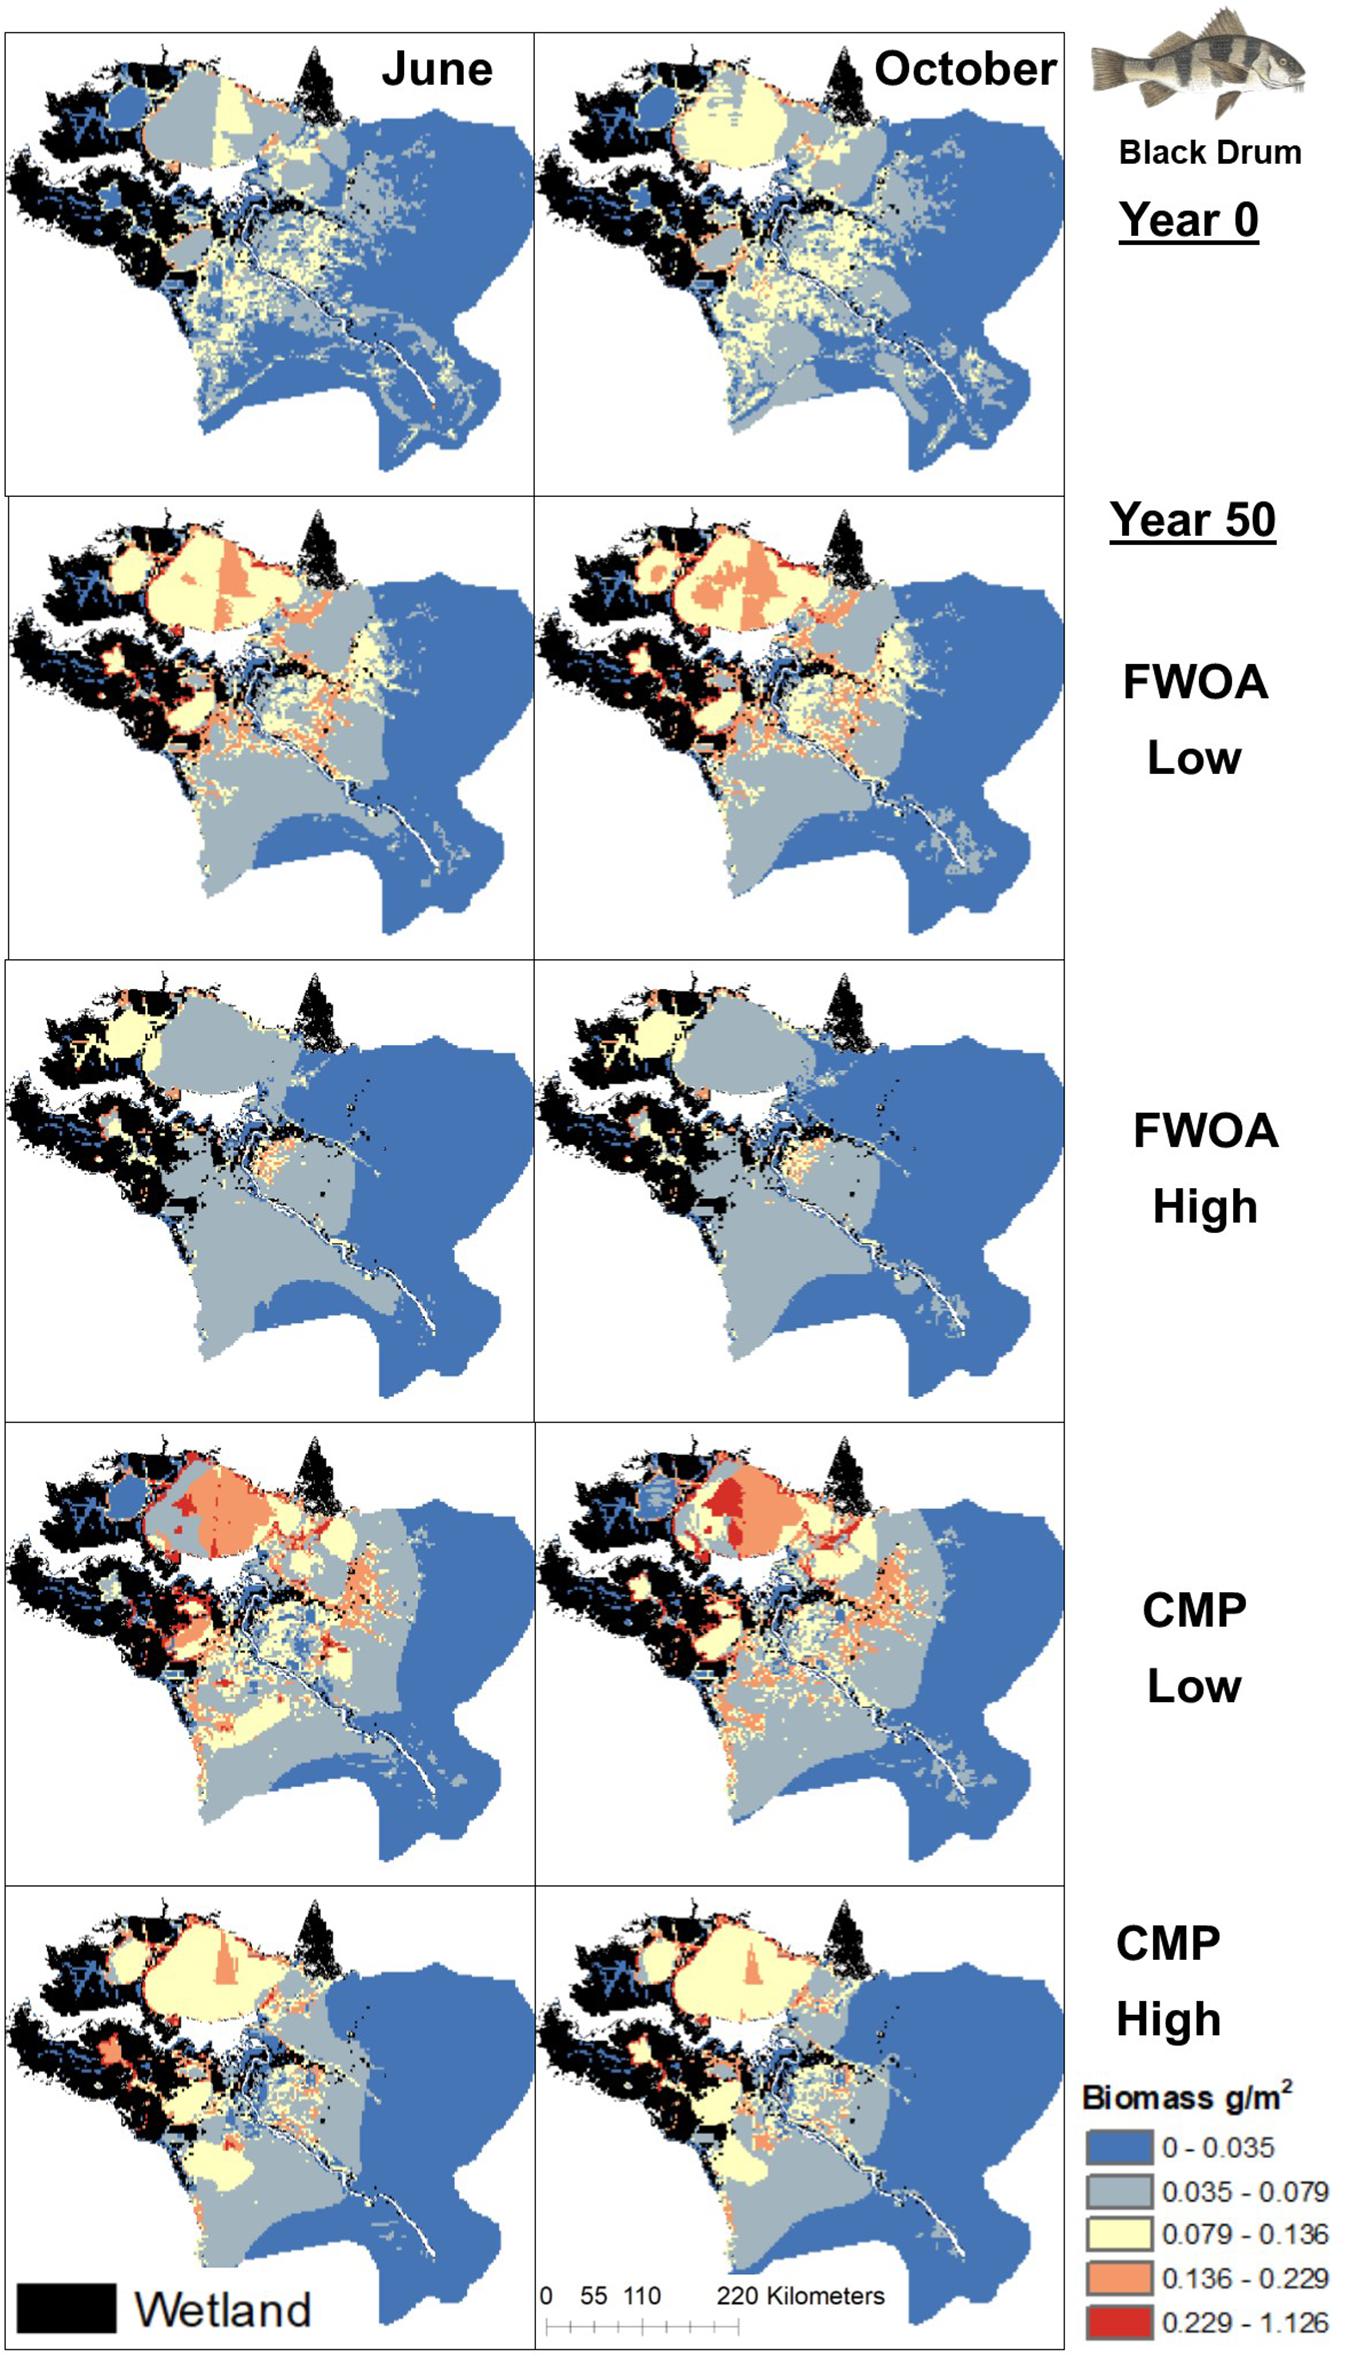
Figure 7. Spatial distribution of juvenile Black Drum in different simulations. Output is shown from June and October in Year 0 and Year 50, under “Low” and “High” relative sea level rise (see Supplementary Table S6 for scenarios), and with Coastal Master Plan (CMP) implementation and without (FWOA).
Figure 8. Spatial distribution of juvenile Brown Shrimp in different simulations. Output is shown from June and October in Year 0 and Year 50, under “Low” and “High” relative sea level rise (see Supplementary Table S6 for scenarios), and with Coastal Master Plan (CMP) implementation and without (FWOA).
Figure 9. Spatial distribution of juvenile Gulf Menhaden in different simulations. Output is shown from June and October in Year 0 and Year 50, under “Low” and “High” relative sea level rise (see Supplementary Table S6 for scenarios), and with Coastal Master Plan (CMP) implementation and without (FWOA).
Figure 10. Spatial distribution of juvenile Largemouth Bass in different simulations. Output is shown from June and October in Year 0 and Year 50, under “Low” and “High” relative sea level rise (see Supplementary Table S6 for scenarios), and with Coastal Master Plan (CMP) implementation and without (FWOA).
Figure 11. Spatial distribution of adult Eastern Oyster in different simulations. Output is shown from June and October in Year 0 and Year 50, under “Low” and “High” relative sea level rise (see Supplementary Table S6 for scenarios), and with Coastal Master Plan (CMP) implementation and without (FWOA).
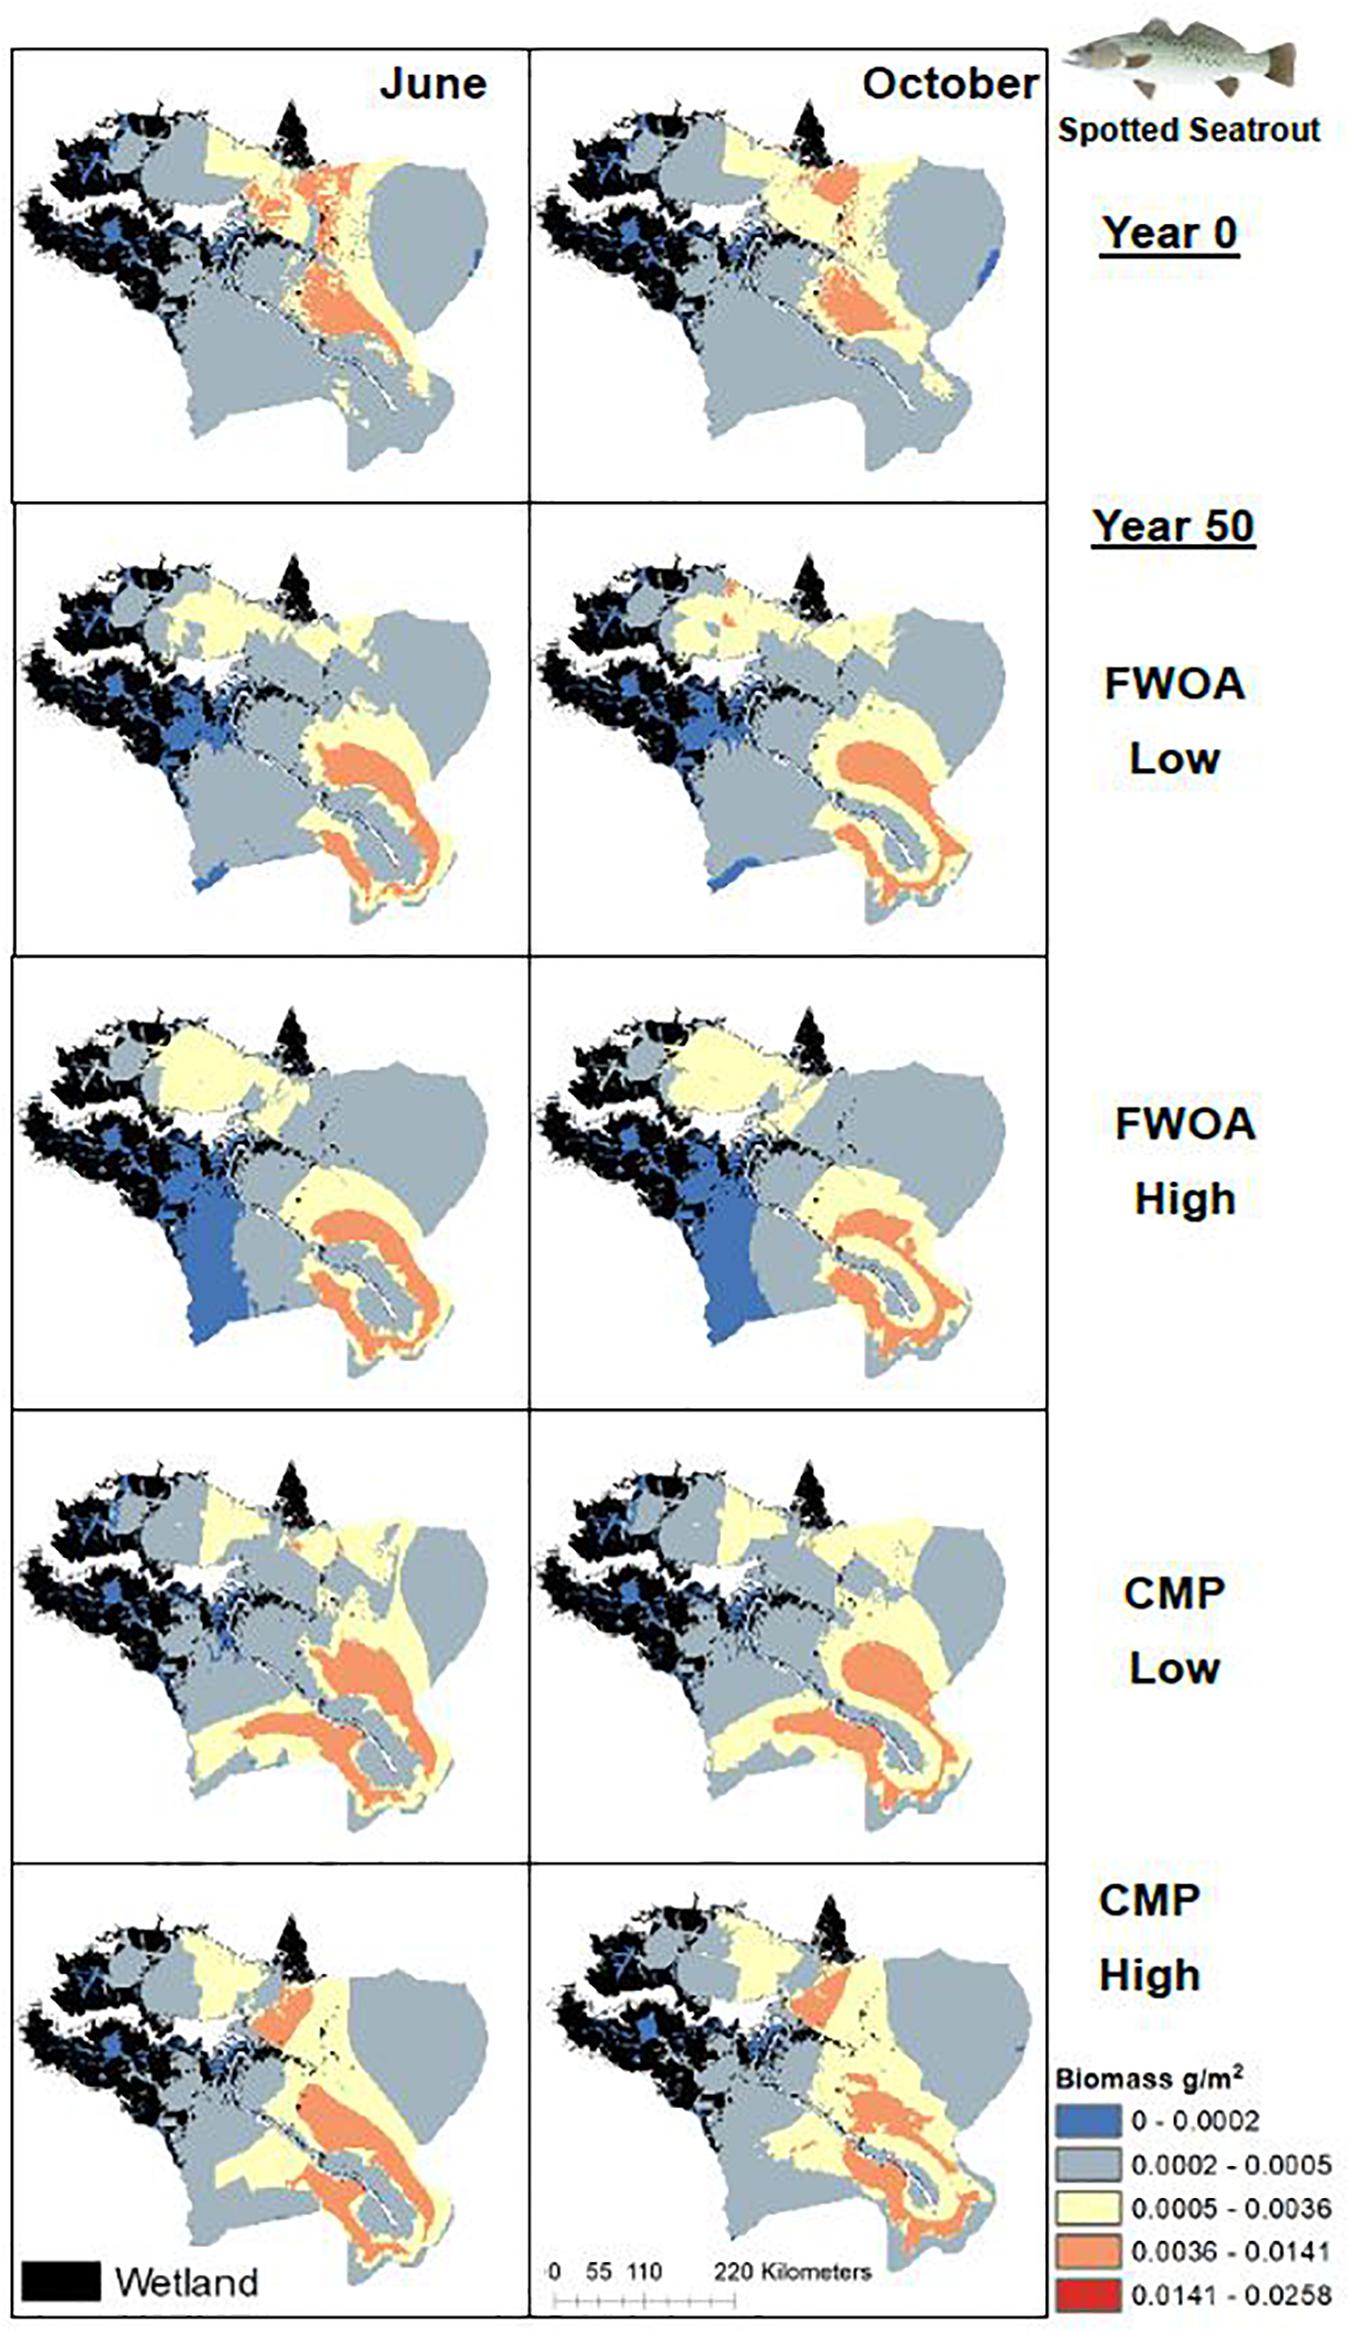
Figure 12. Spatial distribution of adult Spotted Seatrout in different simulations. Output is shown from June and October in Year 0 and Year 50, under “Low” and “High” relative sea level rise (see Supplementary Table S6 for scenarios), and with Coastal Master Plan (CMP) implementation and without (FWOA).
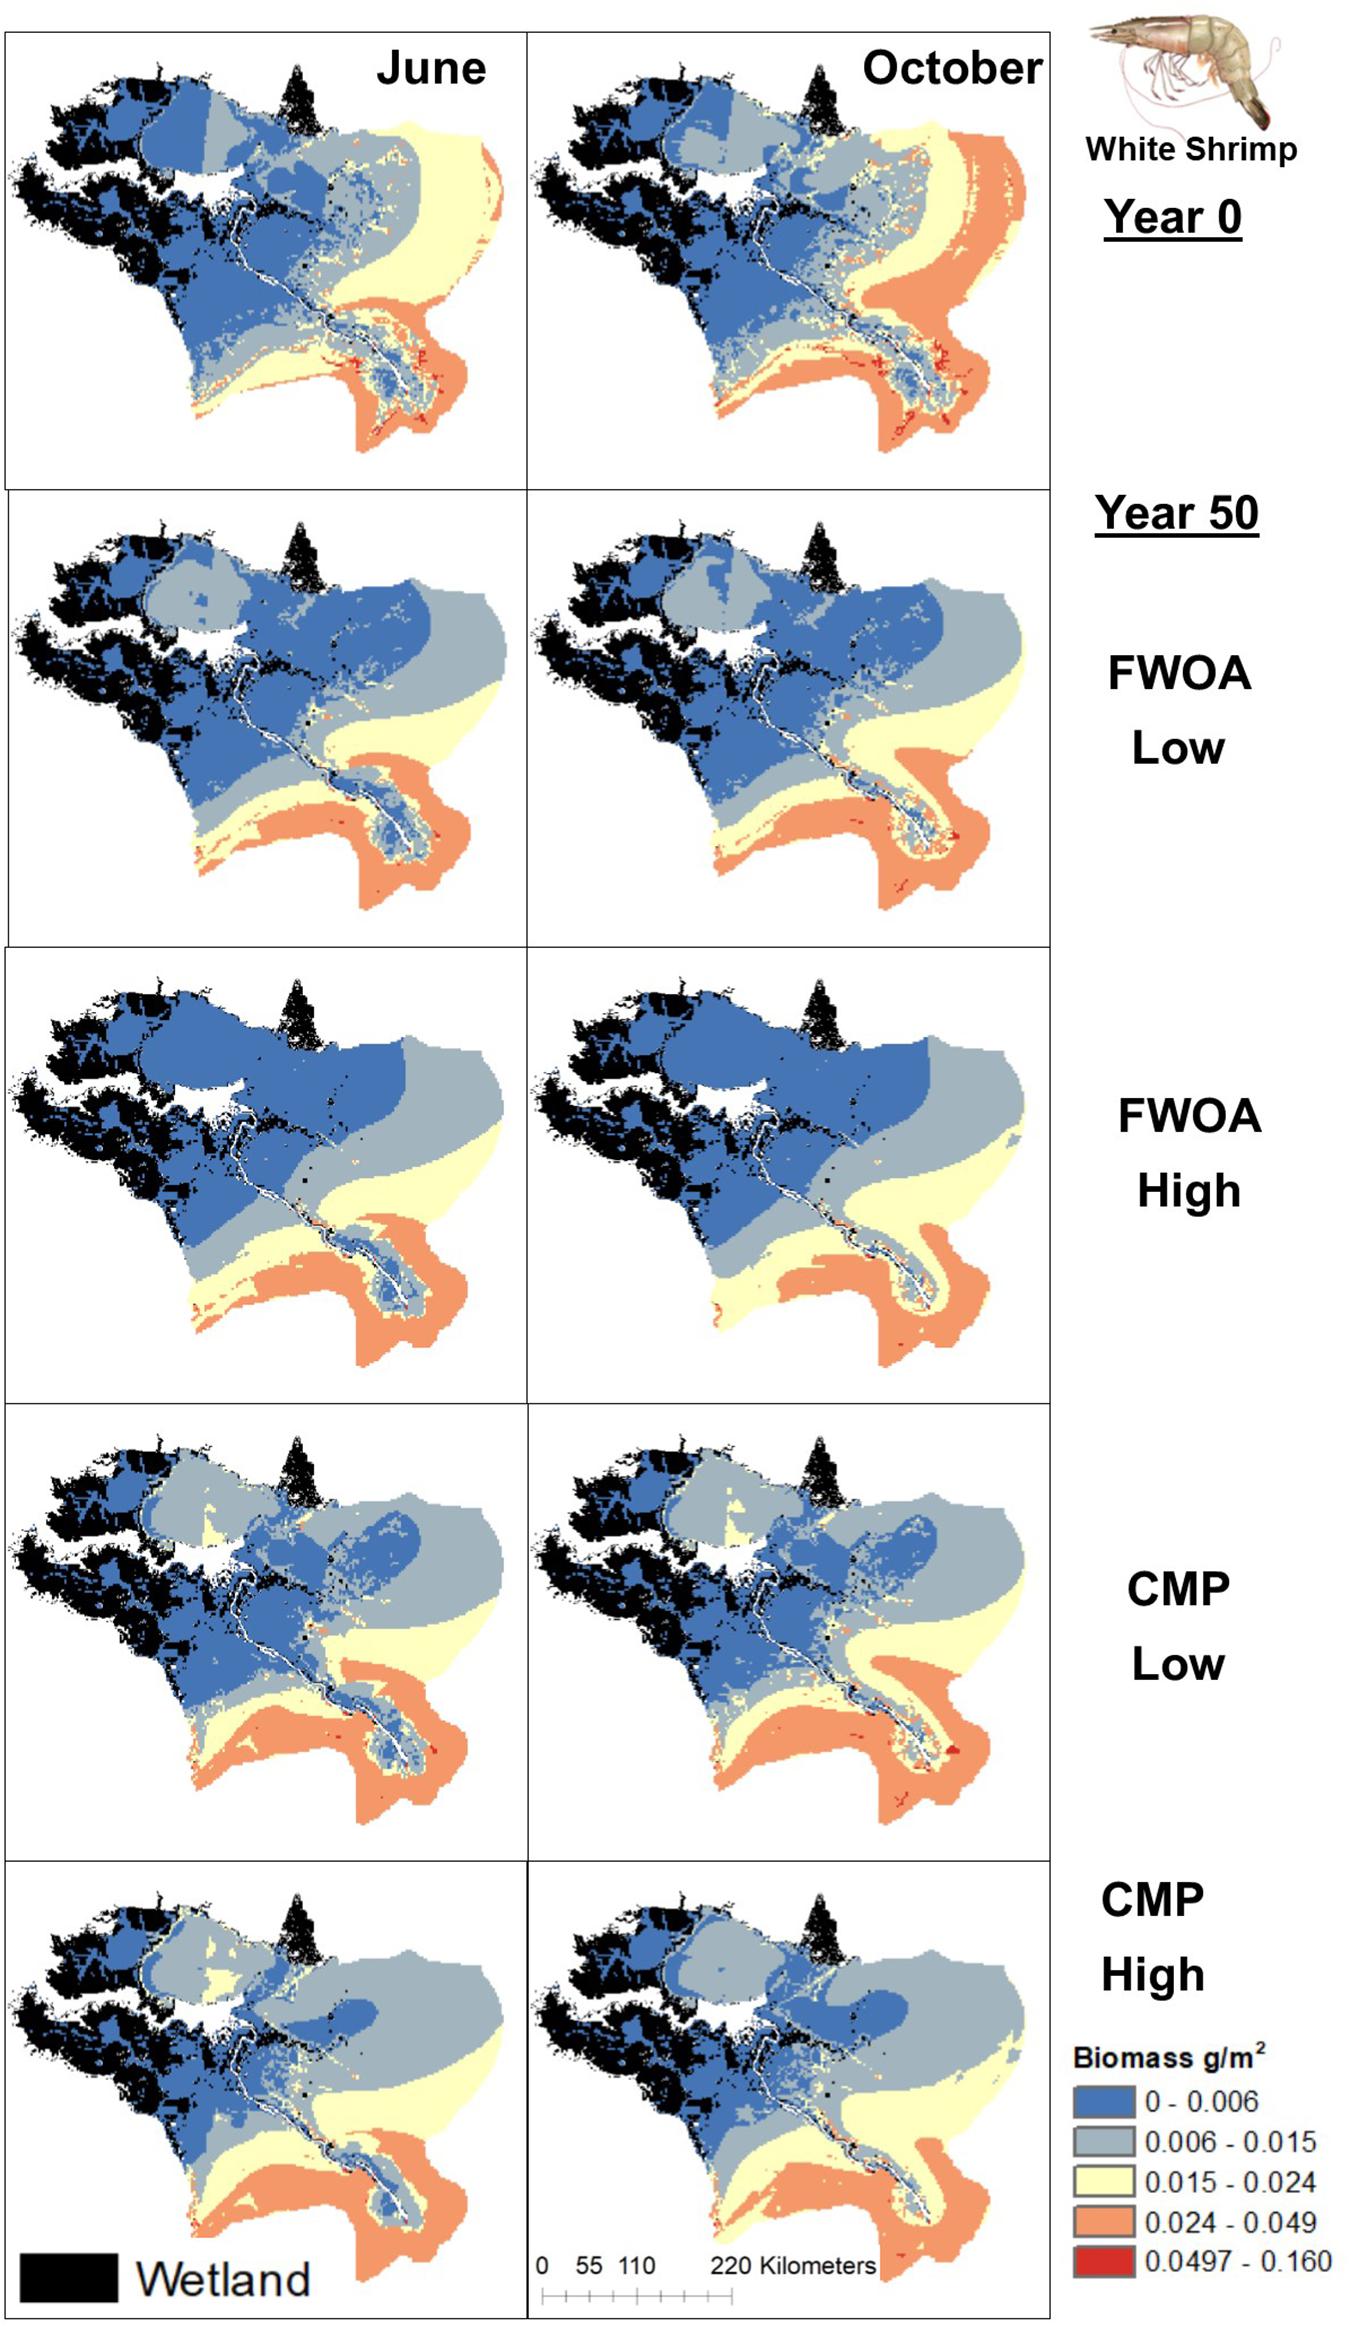
Figure 13. Spatial distribution of juvenile White Shrimp in different simulations. Output is shown from June and October in Year 0 and Year 50, under “Low” and “High” relative sea level rise (see Supplementary Table S6 for scenarios), and with Coastal Master Plan (CMP) implementation and without (FWOA).
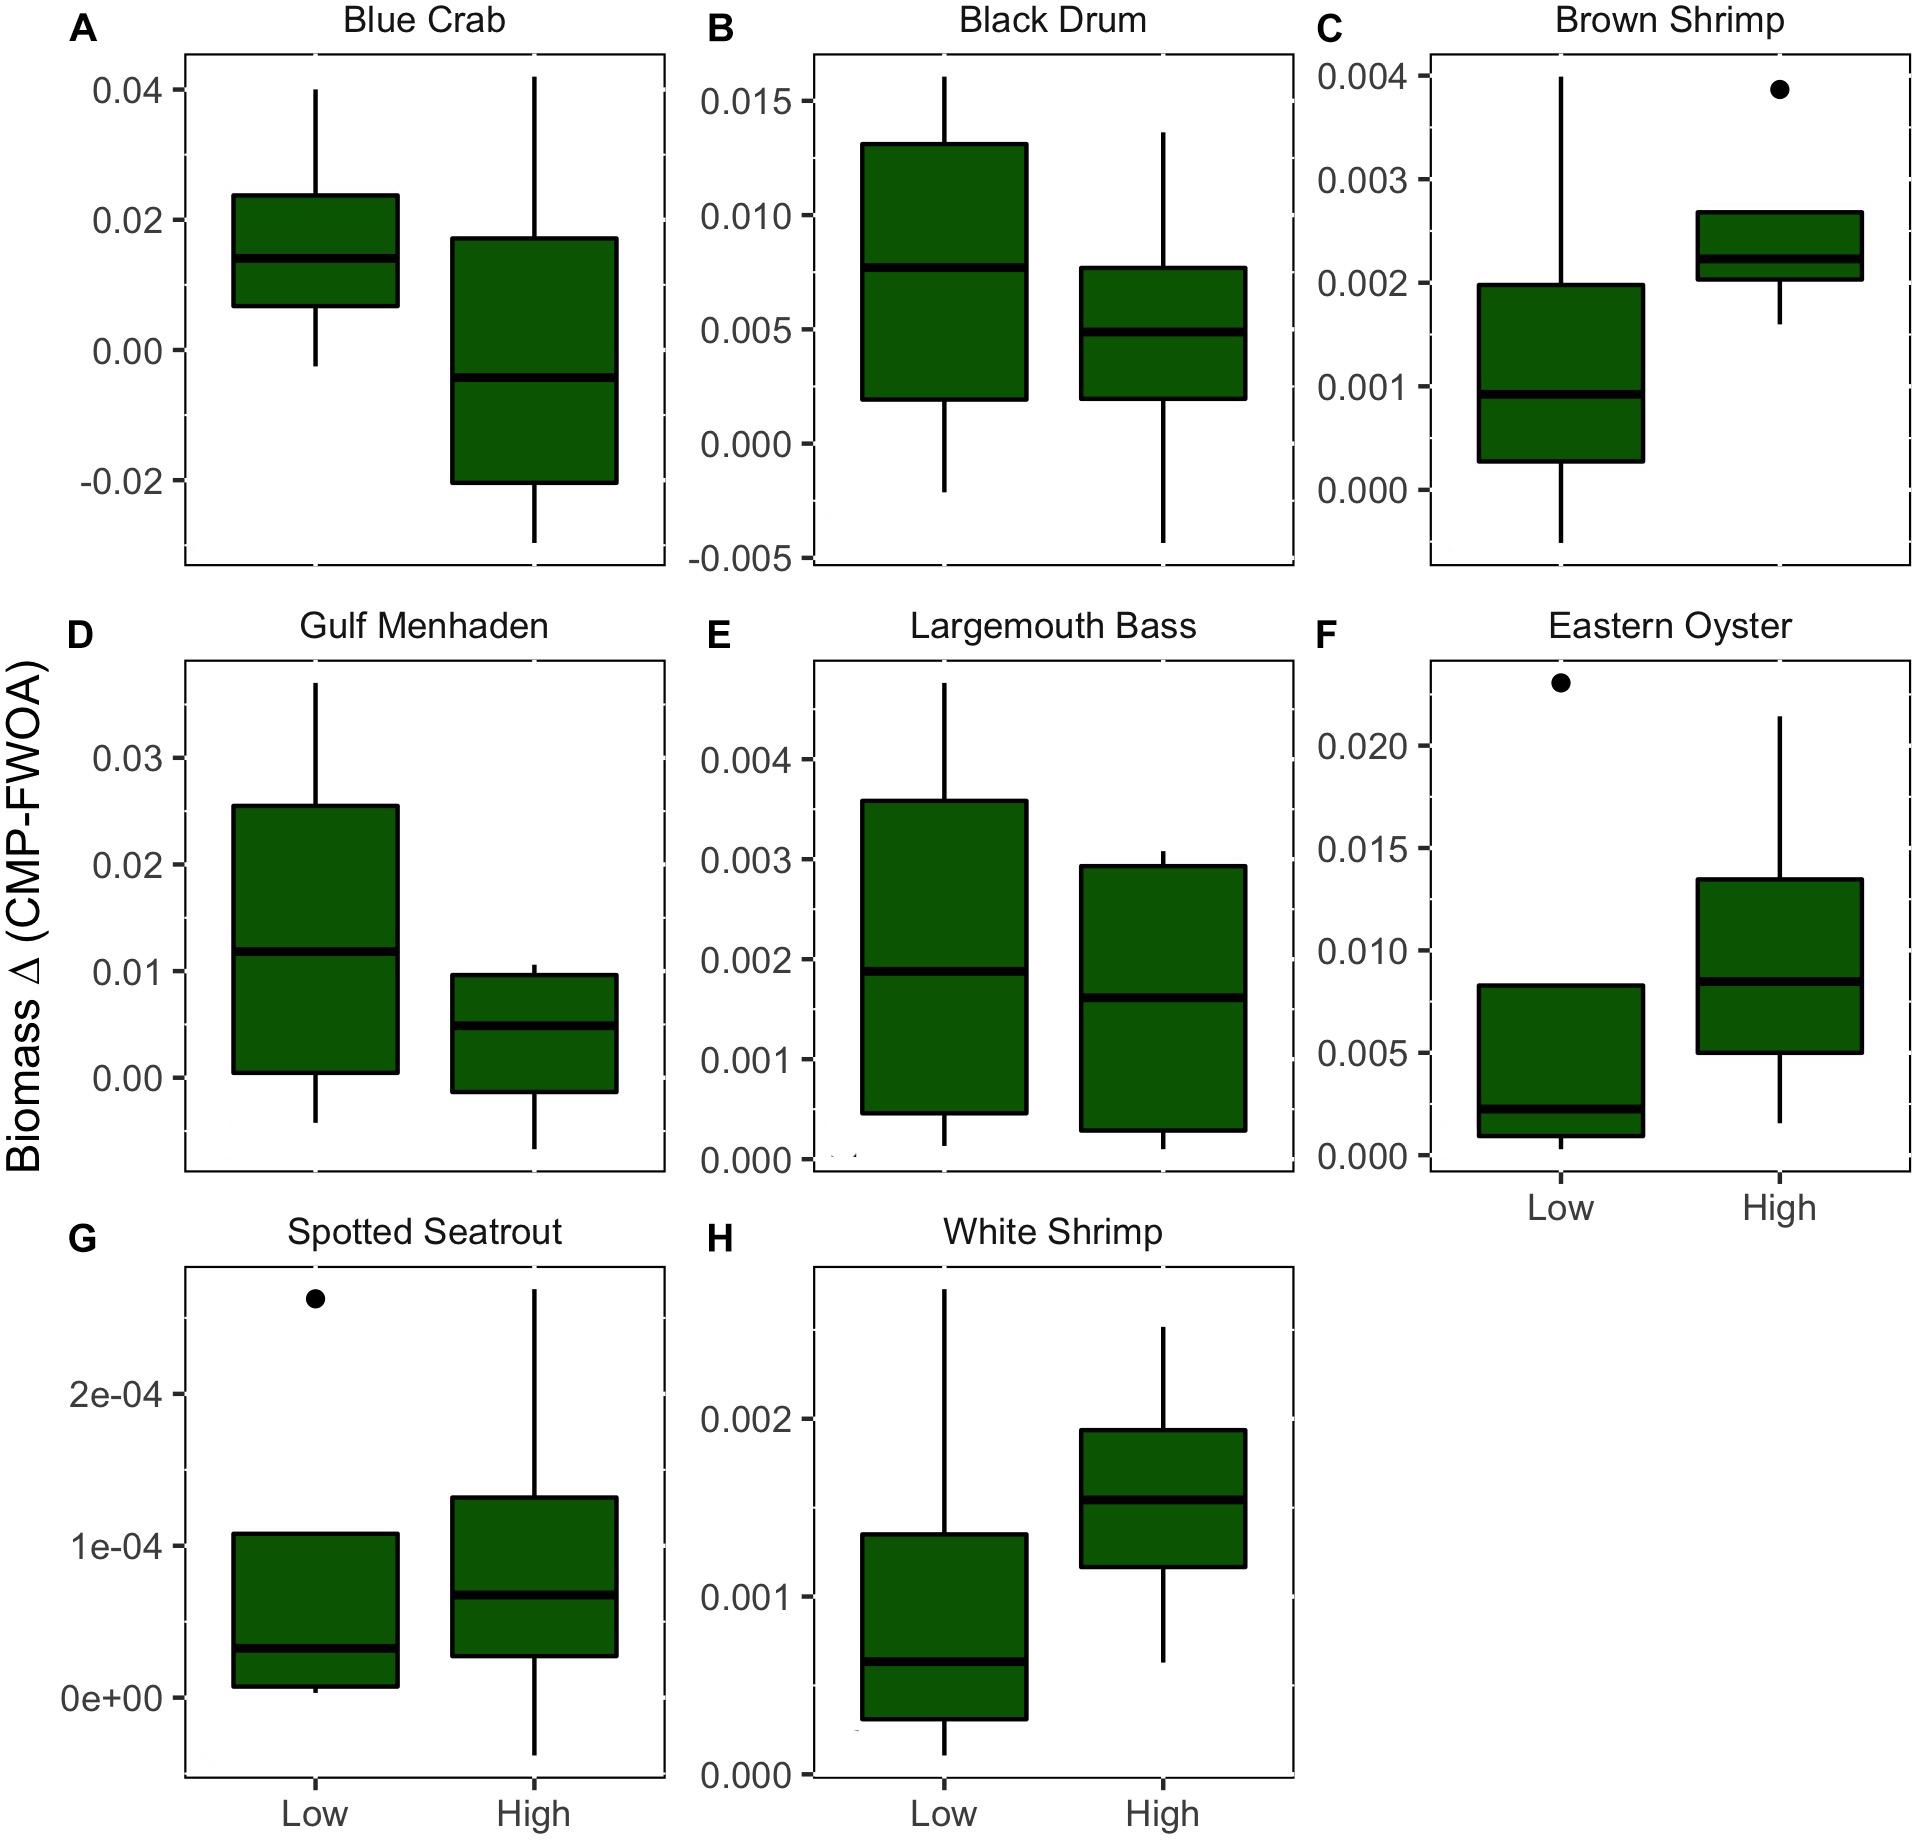
Figure 14. The average difference in biomass over all basins of eight species of economic interest between Coastal Master Plan (CMP) implementation and a future without action (FWOA). This difference under a low and high sea level rise scenarios is compared. Values indicate how much more biomass in g m–2 is retained at year 50 with plan implementation as compared to a future without action. (A) Blue Crab, (B) Black Drum, (C) Brown Shrimp, (D) Gulf Menhaden, (E) Largemouth Bass, (F) Eastern Oyster, (G) Spotted Seatrout, (H) White Shrimp.
Effects of SLR Scenario
Future rates of SLR appear to impact plan implementation effects on biomass and distribution of fisheries species (Figures 6–13). In other words, SLR adds uncertainty in the predictions of CMP effects. The SLR scenario simulated also has an influence on fish biomass and distribution in an FWOA. To evaluate what effect plan implementation has under different rates of SLR, the biomass difference in year 50 between CMP and FWOA over all basins under the two SLR scenarios was compared (Figure 14). With positive values indicating that more biomass is present in year 50 under plan implementation that in an FWOA, only blue crab under the high SLR scenario shows an average lower biomass with plan implementation than in an FWOA. All other species responded positively to plan implementation. For blue crab, black drum, Gulf menhaden, and largemouth bass, the effect of plan implementation is larger under the low SLR scenario than under the high SLR scenario. For brown shrimp, eastern oyster, spotted seatrout, and white shrimp, the effect of plan implementation is larger under the high SLR scenario than under the low SLR scenario.
Species-Specific Responses
Blue crab biomass was lower with plan implementation in the Birdsfoot Delta than without, higher in Breton Sound and Lower Barataria, and showed no difference in the Lower Pontchartrain basin (Figure 5A). Figure 6 shows loss of blue crab habitat (marsh edge) and thereby biomass under FWOA, which is mitigated by plan implementation under CMP. This outcome is evident in Breton Sound and Lower Barataria, which are the receiving basins of Mississippi River sediment and nutrients through large sediment diversions as part of the CMP (see Supplementary Table S1 for all projects included in the CMP). Black drum biomass was lower with plan implementation in the Birdsfoot Delta than without, and higher in Breton Sound, Lower Barataria, and the Lower Pontchartrain basin (Figure 5B). Black drum shows a strong increase in biomass over the model simulation time with plan implementation and a low SLR scenario, moderate increase in biomass with plan implementation under a high SLR scenario as well as in an FWOA under a low SLR scenario, but a decrease in biomass in an FWOA under a high SLR scenario (Figure 7). Brown shrimp biomass was higher with plan implementation in the Birdsfoot Delta, lower Barataria, and the Lower Pontchartrain basin than without, and showed no difference in Breton Sound (Figure 5C). The differences between CMP and FWOA and between low and high SLR scenarios (the latter is evident by the small size of the boxes in the box plot) were small. An effect of habitat loss can be seen when comparing the start (year 0) with the end of the simulation (year 50) especially at the marine end of the Lower Pontchartrain and Breton Sound basins, resulting in a shift of biomass toward the offshore area of the Lower Barataria basin (Figure 8). This effect is strongest without plan implementation (FWOA) and under high rates of SLR. Gulf menhaden shows a positive response to plan implementation in all basins except for the Birdsfoot Delta (Figure 5D). The distribution maps indicate that in an FWOA suitable habitat seems to disappear elsewhere, concentrating Gulf menhaden juveniles around the Birdsfoot (Figure 9). Under the CMP, suitable areas for Gulf menhaden juveniles expand in the wetlands of Barataria Bay and Breton Sound. Largemouth bass shows much higher biomass under CMP than in an FWOA in Breton Sound and Lower Barataria (Figure 5E). The differences in the Birdsfoot Delta and Lower Pontchartrain basin are small but positive for CMP as compared to FWOA. The distribution of this low salinity species spreads to the wetlands of Barataria Bay and Breton Sound with plan implementation over the 50-year model simulation, even under the high SLR scenario (Figure 10). Eastern oyster experienced higher biomass in all basins under plan implementation than in an FWOA in year 50 of the simulation (Figure 5F). The spatial distribution maps show that highest biomass occurs under plan implementation with high SLR projection (Figure 11). Averaged over SLR scenarios, the effect on oysters of plan implementation is still positive (Figure 5F). The spatial distribution is in this case also heavily determined by substrate, with percent cultch as a main factor in oyster establishment. Spotted seatrout shows higher biomass in Lower Barataria with plan implementation as compared to an FWOA (Figure 5G), which is due to an increase in biomass with CMP implementation (Figure 12), especially under the low SLR scenario, and a decrease in biomass in an FWOA. Differences are smaller in the other basins, with slightly lower biomass with plan implementation than in an FWOA in the Birsdsfoot Delta, and slightly higher in Breton Sound and Lower Pontchartrain (Figure 5G). White shrimp showed very little difference in all basins between plan implementation and an FWOA, but in all cases, the biomass was slightly higher with plan implementation (Figure 5H). From the spatial distribution maps, it becomes clear that the largest change occurs through time (year 0 versus year 50, Figure 13), with biomass reductions mostly in the lower Breton Sound and Pontchartrain Basins.
Discussion
The Louisiana CMP is designed to mitigate coastal wetland losses and habitat changes that are expected due to both anthropogenic and natural causes (CPRA, 2017; White et al., 2017), which in turn affects the biomass of living marine resources. This reduction of habitat loss due to plan implementation is more successful under low SLR scenarios, but still noticeable under high rates of SLR (White et al., 2019). How much the climate will change is unknown; therefore simulations of two scenarios have been compared here, one considered on the low end of change in SLR and subsidence and one considered on the high end. The complications of SLR rate scenarios, and how they will be impacted by new knowledge (e.g., of ice sheet melt dynamics), and by climate change mitigation and emission reduction efforts at the global scale, are a continuously evolving and advancing area of scientific study1. Research conducted since the development of these scenarios is exploring the relative likelihoods of these (and others) SLR scenarios (Kopp et al., 2014; Sweet et al., 2017); however, it still remains difficult to project, with any level of confidence, exactly which SLR scenario will be the closest to future sea level trends in coastal Louisiana; a factor that is further compounded by subsidence rates. What is clear is that future sea levels in coastal Louisiana will result in changed conditions that will only be partially mitigated by an extensive restoration plan. Restoration and mitigation alone will not prevent the loss of coastal habitat for living marine resources. Climate change is a global process and should therefore be considered when developing ecosystem restoration plans. In fact, Busch et al. (2016) outlines a Climate Science Strategy for the US National Marine Fisheries Service (NMFS) and directly calls for “robust projections of future ocean conditions and the likely responses of ecosystems, LMRs, and human communities on appropriate temporal and spatial scales.” The work herein is an exciting step to aligning with the plan put forth by the NMFS.
Planned restoration projects that will have the most effect on the fish and shellfish in the Mississippi River Delta (our focus area) are large sediment diversions and marsh creation projects. These projects are expected to increase habitat as compared to an FWOA by mitigating wetland loss, increasing sediment and nutrient loads by diverting Mississippi River water into the estuaries, and reducing salinity for the same reason. While the land-building capacity of river diversions has been shown in various projects (Day et al., 2018), stakeholders are concerned about potential negative impacts to fish and fisheries (Barra, 2020), mostly due to salinity reductions (Das et al., 2012). Explicitly simulating effects of planned restoration projects on living resources in the estuaries as was done in our study provides an estimate of the effects and impacts of these projects on living resources. One species of concern is eastern oyster, which will be affected by lowered salinities (Soniat et al., 2013). We have put much care into the simulation of oyster response to environmental changes by including OECLs (De Mutsert et al., 2017); a different habitat suitability subroutine than the habitat capacity model available in Ecospace that reflect effects of environmental change on daily rather than monthly time steps. We found similarities in our oyster distributions to Soniat et al. (2013); suitable locations for eastern oyster are at the marine end of the lower estuaries and depend on the presence of hard substrate. Perhaps surprisingly, we found that eastern oyster experienced higher biomass under plan implementation than in an FWOA in year 50 of the simulation. This does not mean oyster biomass increased over the 50-year simulation with plan implementation; oyster biomass in both the FWOA and CMP scenarios decreased over the course of the simulation under the low SLR scenario. The distribution maps show that higher rates of SLR might actually befits oysters; plan implementation under high SLR resulted in highest biomass, which is due to a combination of increased nutrients and increased salinity.
Our results indicate that the effects of the combined projects in the 2017 Coastal Master Plan in the Mississippi River Delta are species-specific and basin-specific. However, the general trend is that the differences in species’ biomasses are small, with mostly slightly higher biomass with plan implementation versus an FWOA. The fact that an FWOA does not result in more biomass of living resources in a 50-year simulation indicates that the need for estuarine habitat at some stage of each of these species life histories outweighs the costs of lowered salinities. In addition, these species are all estuarine species with a salinity optimum below full seawater (35); the saltwater intrusion as result of relative SLR may increase the salinity too much for these species in this area. Results from White et al. (2018), for example, indicate that the existing freshwater diversion in Barataria Basin may be inadequate in maintaining present-day salinity dynamics under the same high SLR scenario as we used in this study. One example of this in our results is the decline in brown and white shrimp biomass over time, with biomass reduced in the Chandeleur Sound (at the marine end of Breton Sound and lower Pontchartrain Basin). This may be a result of saltwater intrusion due to SLR, and outside of the effect area of restoration plans.
The positive effects on the biomass of living resources with plan implementation are encouraging since the plan is focused on mitigating land loss and is not explicitly designed to benefit fisheries species. In addition to mitigating the loss of fish habitat, this effect can be explained by the increased nutrients as a result of diverting Mississippi River water into the estuaries as part of the restoration efforts, represented in the model as TKN driving primary productivity (Supplementary Figure S2). Fish and fisheries generally show strong responses to changes in nutrient loads (Breitburg et al., 2009). Our results show that especially for Gulf menhaden, which has biomass concentrated around nutrient-rich areas because their phytoplankton-centric diet links them closely to nutrients. This concentrates Gulf menhaden juveniles around the Birdsfoot Delta in an FWOA, since that is the main source of nutrients in that scenario, and suitable habitat seems to disappear elsewhere. Under plan implementation, suitable areas for Gulf menhaden juveniles expand into the wetlands of Barataria Bay and Breton Sound because of increased nutrient levels in response to large river diversions. Since nutrient changes elicit such a strong response, a useful addition to a suite of models such as the ICMs would be a biological model that explicitly simulates phytoplankton growth in response to all physical and biogeochemical changes occurring in the model scenarios, such as presented in Baustian et al. (2018), and potential formation of hypoxia with high nutrient loads, such as presented in Fennel et al. (2011). While the current drivers of change in the model are salinity, nutrients, and habitat, future improvements to the Ecospace model should include accounting for effects of increased sediments loads on phytoplankton, fish, and shellfish, effects of flow increase on these organisms during diversion openings, and effects of hypoxia.
A previous study in the Mississippi River Delta with a similar scope and objective found that the negative effects of the salinity reductions as a result of large sediment diversions outweighed the positive effects of reduced marsh loss on estuarine fish and shellfish species (De Mutsert et al., 2017). The results showed a redistribution of species to more favorable areas rather than overall biomass loss. The current study found that for most species, the biomass was higher with implementation of restoration projects, of which some reduce salinity, than in an FWOA. De Mutsert et al. (2017) and the current study were linked to different models delivering the environmental driver data, and used different Ecospace models to simulate the effects on living resources. The current study uses ICM projections with future scenarios that include SLR at two different rates, while the model used to drive the De Mutsert et al.’s (2017) study did not include environmental changes through subsidence and/or SLR (Baustian et al., 2018). Without the inclusion of SLR, the amount of marsh loss and saltwater intrusion under an FWOA is likely underestimated. Because of that fact, the difference in available juvenile habitat between an FWOA and coastal restoration is smaller, and the salinity reduction through river diversions is stronger. A second reason for the difference is that phytoplankton was explicitly modeled in Baustian et al. (2018), while this was not the case in the ICM (White et al., 2019). De Mutsert et al. (2017) reported a reduction in secondary biomass close to diversion outfalls because high sediment load reduced phytoplankton growth, even at high nutrient levels. Without phytoplankton explicitly modeled in the ICM, nutrients are used in the current study to drive primary production in Ecospace, which does not account for changes in light availability to phytoplankton. Therefore, the primary production and secondary production near the outfall of large sediment diversions or the Mississippi river mouth are likely overestimated in the current study. Despite the differences in the use of models and results, neither study found strong negative impacts on living resources of coastal restoration projects designed to mitigate wetland loss. Both studies found small effects on biomass that were species-specific and basin-specific. These basin-level differences could help inform localized management responses to the changes estimated by the models. By providing spatial outputs (maps) with these studies rather than line graphs, estimates of spatial redistribution could provide resource managers with basin specific knowledge to implement the most appropriate restoration strategy in that area.
By comparing June and October, we compared a month after a period of high diversion flow (June) and a month after a period of diversion closure (October) under the simulated diversions operation plan. By considering these results, recovery of high salinity species from a period of low salinity can be evaluated. We found that the biomasses observed in both June and October were similar between a number of the target species (e.g., brown shrimp, blue crab, spotted seatrout, and black drum). This outcome may mean that the magnitude of the diversions maintains a new status quo of an estuarine nekton community structure and distribution that is tolerant of lowered salinities. However, our simulations do not explicitly address the effect of salinity changes on spawning success or larval recruitment to the estuaries of fish and shellfish, which could be affected by spring and summer diversion opening (Peyronnin et al., 2017). The operation schedule and thereby flow regime are not finalized yet, and discussions have pointed to winter openings being potentially more optimal (Peyronnin et al., 2017). The June output can be more broadly interpreted as conditions when the large sediment diversions are open, and October as conditions when the large sediment diversions are closed.
The simulations show species-specific and location-specific effects which are a result of local biological factors. For example, the spatial distribution maps of brown and white shrimp show that most of the shrimp biomass is at the marine end of the lower estuaries, which may be why plan implementation or SLR effects such as wetland loss have less impact than on other species. Das et al. (2012) in their study in the same area concluded that river diversions strongly affect salinities only in the middle section of the estuary, so spatial distribution of organisms and their overlap with environmental change on small scales affect the species-specific outcomes. While diversions do not affect salinities much in the upper estuary (since it is already fresh; Das et al., 2012), they can affect the biomass of upper estuary low-salinity species. Salinity is likely the main driver for higher largemouth bass biomass with plan implementation as compared to an FWOA, due to expansion into the mid-estuary with the opening of the large sediment diversions under CMP. Busch et al. (2016) explicitly states that climate projections need regional and local down-scaling to adjust for the relevant and local biological factors that drive smaller-scale systems. EwE software provides a user-friendly interface to do just that, which facilitates the transfer and applicability of the approach described here to other areas and issues.
This work fills an important gap in the literature by evaluating landscape-scale impacts on estuarine food webs and changes in species biomass and distributions in response to environmental changes. Small-scale, site-specific studies that evaluate impacts of restoration on nekton species are widely available in the literature. However, landscape-scale impacts of marsh restoration on fish and fisheries have been less studied. This type of study would not be possible without the availability of long-term monitoring data from stations covering the coastal area provided by the Louisiana Department of Wildlife and Fisheries. Using available monitoring data over larger regions in combination with known restoration projects could elucidate broad-scale patterns of nekton response over time and space. Recent large-scale studies evaluate impacts of the Deepwater Horizon Oil Spill on fisheries using data from the same monitoring program (Van der Ham and De Mutsert, 2014; Ward et al., 2018). Monitoring data provide an avenue for managers to implement adaptive management strategies in a system laden with much uncertainty, and allow for the development and validation of large ecosystem models as presented in this study that are increasingly needed to addressed ecosystem-based management questions.
Conclusion
Coastal areas need to prepare for a changing environment, which includes wetland loss. Coastal restoration and risk reduction projects are part of the mitigation strategy. While these activities will undoubtedly affect the living resources in these areas, simulations such as the ones conducted in this study provide insights into what responses can be expected. Current simulations do not show large negative impacts on living resources of implementing restoration projects designed to mitigate wetland loss. A main reason for this outcome is that an FWOA is a changing environment as well, undergoing habitat loss and saltwater intrusion, represented here by including two SLR scenarios in the model projections. Simulations such as these can provide information to help managers prioritize restoration strategies and anticipate localized response needs to changes in living resource biomass. The simulations show species-specific and location-specific effects that emphasize that species-specific relationships to environmental and location-specific drivers will need to be included in a model when applying this methodology to other locations globally. Resource managers can use the resulting information to implement precautionary measures of ecosystem management and adaptation.
Data Availability Statement
The data used to for the development of the model can be received upon request to the Louisiana Department of Wildlife and Fisheries. Input and output data from the Louisiana Coastal Master Plan simulations used in this study are free and available upon request; email data requests to masterplan@LA.gov or the corresponding author. ICM validation statistics, data, and figures are available online at https://coastal.la.gov/our-plan/2017-coastal-master-plan/. Model source code for EwE is free and available upon request at http://sources.ecopath.org/trac/Ecopath. Model source code for the other ICM components are open source and available online at https://github.com/CPRA-MP.
Author Contributions
KM and KL developed the model. JB helped troubleshoot software issues. EW and JB coupled the Ecospace model to the ICM. KM, KL, JB, and EW wrote the manuscript. All authors contributed to the article and approved the submitted version.
Funding
This effort was funded by the Coastal Protection and Restoration Authority of Louisiana under Cooperative Endeavor Agreement Number 2503-12-58, Task Order No. 03. The Integrated Compartment Model development was initially funded by the Louisiana Coastal Protection and Restoration Authority.
Conflict of Interest
The authors declare that the research was conducted in the absence of any commercial or financial relationships that could be construed as a potential conflict of interest.
Acknowledgments
We would like to acknowledge the Water Institute of the Gulf for tasking us with the fish and shellfish model development in support of the Coastal Master Plan, and Jeroen Steenbeek and Scott Milroy for their work on the model. KM would like to thank Tiffany Pasco for providing diet data collected within the model area. Feedback from the Water Institute of the Gulf, CPRA, and the predictive models technical advisory committee has improved the model. The authors are indebted to the many researchers and engineers who participated in the 2017 Coastal Master Plan analyses and assisted in those efforts. We thank two reviewers whose thoughtful comments have improved the manuscript.
Supplementary Material
The Supplementary Material for this article can be found online at: https://www.frontiersin.org/articles/10.3389/fmars.2021.624532/full#supplementary-material
Footnotes
References
Althauser, L. L. (2003). An Ecopath/ecosim Analysis of an Estuarine Food Web: Seasonal Energy Flow and Response to River-flow Related Perturbations. Master’s of Science thesis, Louisiana State University and Agricultural and Mechanical College: Baton Rouge, LA
Barra, M. P. (2020). Good sediment: race and restoration in coastal Louisiana. Ann. Am. Assoc. Geographers 111, 266–282. doi: 10.1080/24694452.2020.1766411
Baustian, M. M., Meselhe, E., Jung, H., Sadid, K., Duke-Sylvester, S. M., Visser, J. M., et al. (2018). Development of an integrated biophysical model to represent morphological and ecological processes in a changing deltaic and coastal ecosystem. Environ. Modell. Software 109, 402–419. doi: 10.1016/j.envsoft.2018.05.019
Beckman, D., Stanley, A., Render, J., and Wilson, C. (1991). Age and growth-rate estimation of sheepshead Archosargus probatocephalus in Louisiana waters using otoliths. Fish. Bull. 89, 1–8.
Benson, N. (1982). Life History Requirements of Selected Finfish and Shellfish in Mississippi Sound and Adjacent Areas. Washington, DC: U.S. Fish and Wildlife Service, Office of Biological Services, 97.
Boudreaux, A. (2013). Assessment of Largemouth Bass Micropterus salmoides Age, Growth, Gonad Development and Diet in the Upper Barataria Estuary. Master of Science thesis, Nicholls State University: Thibodaux, LA.
Breitburg, D. L., Craig, J. K., Fulford, R. S., Rose, K. A., Boynton, W. R., Brady, D. C., et al. (2009). Nutrient enrichment and fisheries exploitation: interactive effects on estuarine living resources and their management. Hydrobiologia 629, 31–47. doi: 10.1007/s10750-009-9762-4
Busch, D. S., Griffis, R., Link, J., Abrams, K., Baker, J., Brainard, R. E., et al. (2016). Climate science strategy of the US National Marine Fisheries Service. Mar. Pol. 74, 58–67.
Christensen, V., Coll, M., Steenbeek, J., Buszowski, J., Chagaris, D., and Walters, C. J. (2014). Representing variable habitat quality in a spatial food web model. Ecosystems 17, 1397–1412. doi: 10.1007/s10021-014-9803-3
Christensen, V., and Walters, C. J. (2004). Ecopath with ecosim: methods, capabilities and limitations. Ecol. Modell. 172, 109–139. doi: 10.1016/j.ecolmodel.2003.09.003
Christensen, V., Walters, C. J., and Pauly, D. (2008). Ecopath with Ecosim: a user’s Guide. Vancouver, Van: Fisheries Centre, University of British Columbia, 154.
Coll, M., Steenbeek, J., Sole, J., Palomera, I., and Christensen, V. (2016). Modelling the cumulative spatial–temporal effects of environmental drivers and fishing in a NW Mediterranean marine ecosystem. Ecol. Modell. 331, 100–114. doi: 10.1016/j.ecolmodel.2016.03.020
Collins, M. R. (1985). Species Profiles: Life Histories and Environmental Requirements of Coastal Fishes and Invertebrates (South Florida). - White Mullet. U.S. Fish Wildl. Serv. Biol. Rep. 82(11.34). Washington, D.C: U.S. Army Corps of Engineers.
Couvillion, B. R., and Beck, H. (2013). Marsh collapse thresholds for coastal Louisiana estimated using elevation and vegetation index data. J. Coastal Res. 63, 58–67. doi: 10.2112/si63-006.1
Couvillion, B. R., Beck, H., Schoolmaster, D., and Fischer, M. (2017). Land Area Change in Coastal Louisiana (1932 to 2016). Reston, VA: US Geological Survey.
CPRA (2017). Louisiana’s Comprehensive Master Plan for a Sustainable Coast. Baton Rouge, LA: Coastal Protection and Restoration Authority of Louisiana.
Dahood, A., de Mutsert, K., and Watters, G. M. (2020). Evaluating Antarctic marine protected area scenarios using a dynamic food web model. Biol. Conserv. 251:108766. doi: 10.1016/j.biocon.2020.108766
Das, A., Justic, D., Inoue, M., Hoda, A., Huang, H., and Park, D. (2012). Impacts of Mississippi River diversions on salinity gradients in a deltaic Louisiana estuary: ecological and management implications. Estuarine Coastal Shelf Sci. 111, 17–26. doi: 10.1016/j.ecss.2012.06.005
Day, J. W., Lane, R. R., D’Elia, C. F., Wiegman, A. R., Rutherford, J. S., Shaffer, G. P., et al. (2018). Large Infrequently Operated River Diversions for Mississippi Delta Restoration. Berlin: Springer.
De Mutsert, K. (2010). The effects of a Freshwater Diversion on Nekton Species Biomass Distributions, Food Web Pathways, and Community Structure in a Louisiana Estuary. Ph.D. Dissertation thesis, Louisiana State University: Baton Rouge, LA.
De Mutsert, K., Cowan, J. H. Jr., and Walters, C. J. (2012). Using Ecopath with Ecosim to explore nekton community response to freshwater diversion into a Louisiana estuary. Mar. Coastal Fish. 4, 104–116. doi: 10.1080/19425120.2012.672366
De Mutsert, K., Lewis, K., Milroy, S., Buszowski, J., and Steenbeek, J. (2017). Using ecosystem modeling to evaluate trade-offs in coastal management: effects of large-scale river diversions on fish and fisheries. Ecol. Modell. 360, 14–26. doi: 10.1016/j.ecolmodel.2017.06.029
De Mutsert, K., Lewis, K. A., Steenbeek, J., Buszowski, J., and Cowan, J. H. Jr. (2014). 2017 Coastal Master Plan: Ecosystem Outcomes, Community Modeling Justification (4.5). Baton Rouge, LA: Coastal Protection and Restoration Authority.
De Mutsert, K., Steenbeek, J., Lewis, K., Buszowski, J., Cowan, J. H., and Christensen, V. (2016). Exploring effects of hypoxia on fish and fisheries in the northern Gulf of Mexico using a dynamic spatially explicit ecosystem model. Ecol. Modell. 331, 142–150. doi: 10.1016/j.ecolmodel.2015.10.013
Fennel, K., Hetland, R., Feng, Y., and DiMarco, S. (2011). A coupled physical-biological model of the Northern Gulf of Mexico shelf: model description, validation and analysis of phytoplankton variability. Biogeosci. Discuss. 8, 121–156.
FWRI (2010). Fisheries-Independent Monitoring Program 2009 Annual Data Summary Report Florida Fish and Wildlife Conservation Commission (FWC), Fish and Wildlife Research Institute (FWRI). Petersburg, FL: FWRI.
Geers, T. (2013). Developing an ecosystem-based approach to management of the Gulf menhaden fishery using Ecopath with Ecosim. Master of Science thesis, Stony Brook University: New York, NY.
Graham, K. (1999). “A review of the biology and management of blue catfish in Catfish 2000,” in Proceedings of the International Ictalurid Symposium, (Bethesda, MD: American Fisheries Society).
Guillory, V., Perry, H. M., and VanderKooy, S. (2001). The Blue Crab Fishery of the Gulf of Mexico, United States: A Regional Management Plan. Gulf States Marine Fisheries Commission: Ocean Springs, MS.
Hernvann, P.-Y., Gascuel, D., Grüss, A., Druon, J.-N., Kopp, D., Perez, I., et al. (2020). The celtic sea through time and space: ecosystem modeling to unravel fishing and climate change impacts on food-web structure and dynamics. Front. Mar. Sci. 7:1018. doi: 10.3389/fmars.2020.578717
Huff, J. A. (1975). Life history of Gulf of Mexico sturgeon, Acipenser oxyrhynchus desotoi, in Suwannee River, Florida. Florida Department of Natural Resources Marine Research Laboratory Contribution No. 261. Florida: St. Petersburg.
IPCC (2014). “Climate change 2014: synthesis report,” in Contribution of Working Groups I, II and III to the Fifth Assessment Report of the Intergovernmental Panel on Climate Change, eds R. K. Pachauri and L. A. Meyer (Geneva: IPCC), 151.
Keithly, W. R., and Roberts, K. J. (2017). “Commercial and recreational fisheries of the Gulf of Mexico,” in Habitats and Biota of the Gulf of Mexico: Before the Deepwater Horizon Oil Spill, ed. C. Ward (New York, NY: Springer).
Kirk, J. P. (2008). Gulf Sturgeon Movements in and Near the Mississippi River Gulf Outlet. Vicksburg, MS: Engineer Research and Development Center Vicksburg.
Kopp, R. E., Horton, R. M., Little, C. M., Mitrovica, J. X., Oppenheimer, M., Rasmussen, D., et al. (2014). Probabilistic 21st and 22nd century sea-level projections at a global network of tide-gauge sites. Earth’s future 2, 383–406. doi: 10.1002/2014ef000239
LDWF. (2002). Louisiana Department of Wildlife and Fisheries: Marine Fisheries Division Field Procedures Manual. Louisiana, LA: LDWF.
Meselhe, E., McCorquodale, J. A., Shelden, J., Dortch, M., Brown, T. S., Elkan, P., et al. (2013). Ecohydrology component of Louisiana’s 2012 Coastal Master Plan: mass-balance compartment model. J. Coastal Res. 67, 16–28. doi: 10.2112/si_67_2.1
Meselhe, E., White, E. D., and Reed, D. J. (2017). “Coastal master plan: appendix c: modeling chapter 2—future scenarios,” in Louisiana’s Comprehensive Master Plan for a Sustainable Coast; Final Version, (Baton Rouge, LA: Coastal Protection and Restoration Authority).
Minello, T. J., and Rozas, L. P. (2002). Nekton in Gulf Coast wetlands: fine-scale distributions, landscape patterns, and restoration implications. Ecol. Appl. 12, 441–455. doi: 10.1890/1051-0761(2002)012[0441:nigcwf]2.0.co;2
Murphy, M., and Taylor, R. G. (1989). Reproduction and growth of black drum, Pogonias cromis, in Northest Florida. Northeast Gulf Sci. 10, 127–137.
Nieland, D. L., Thomas, R. G., and Wilson, C. A. (2002). Age, growth, and reproduction of spotted seatrout in Barataria Bay, Louisiana. Trans. Am. Fish. Soc. 131, 245–259. doi: 10.1577/1548-8659(2002)131<0245:agaros>2.0.co;2
Peyronnin, N. S., Caffey, R. H., Cowan, J. H., Justic, D., Kolker, A. S., Laska, S. B., et al. (2017). Optimizing sediment diversion operations: working group recommendations for integrating complex ecological and social landscape interactions. Water 9:368. doi: 10.3390/w9060368
Polovina, J. J. (1984). Model of a coral reef ecosystem. Coral Reefs 3, 1–11. doi: 10.1007/bf00306135
Raoux, A., Dambacher, J. M., Pezy, J.-P., Mazé, C., Dauvin, J.-C., and Niquil, N. (2018). Assessing cumulative socio-ecological impacts of offshore wind farm development in the Bay of Seine (English Channel). Mar. Pol. 89, 11–20. doi: 10.1016/j.marpol.2017.12.007
Reagan, J., Re, and Wingo, W. (1985). Species Profiles: Life Histories and Environmental Requirements of Coastal Fishes and Invertebrates (Gulf of Mexico) - Southern Flounder, Paralichtys Lethostigma. USFWS Biol Rep. (82.30). Washington, D.C: U.S. Army Corps of Engineers.
Rozas, L. P., and Minello, T. J. (2011). Variation in penaeid shrimp growth rates along an estuarine salinity gradient: implications for managing river diversions. J. Exp. Mar. Biol. Ecol. 397, 196–207. doi: 10.1016/j.jembe.2010.12.003
SEAMAP (2014). The Southeast Area Monitoring and Assessment Program. Florida, FL: Fisheries Independent Monitoring Program.
Soniat, T. M., Conzelmann, C. P., Byrd, J. D., Roszell, D. P., Bridevaux, J. L., Suir, K. J., et al. (2013). Predicting the effects of proposed mississippi river diversions on oyster habitat quality; application of an oyster habitat suitability index model. J. Shellfish Res. 32, 29–638. doi: 10.2983/035.032.0302
Sweet, W. V., Kopp, R., Weaver, C. P., Obeysekera, J., Horton, R. M., Thieler, E. R., et al. (2017). Global and regional sea level rise scenarios for the United States. Tech. Rep. NOS CO-OPS 083). Silver Spring, MD: National Oceanic and Atmospheric Administration.
Van der Ham, J. L., and De Mutsert, K. (2014). Abundance and size of gulf shrimp in louisiana’s coastal estuaries following the deepwater horizon oil spill. PLoS One 9:e108884. doi: 10.1371/journal.pone.0108884
Visser, J. M., and Duke-Sylvester, S. M. (2017). Lavegmod v2: modeling coastal vegetation dynamics in response to proposed coastal restoration and protection projects in Louisiana, USA. Sustainability 9:1625. doi: 10.3390/su9091625
von Bertalanffy, L. (1933). Modern Theories of Development: An Introduction to Theoretical Biology. New York, NY: Oxford University Press.
Walters, C., Christensen, V., and Pauly, D. (1997). Structuring dynamic models of exploited ecosystems from trophic mass-balance assessments. Rev. Fish Biol. Fish. 7, 139–172.
Walters, C., Martell, S. J., Christensen, V., and Mahmoudi, B. (2008). An Ecosim model for exploring Gulf of Mexico ecosystem management options: implications of including multistanza life-history models for policy predictions. Bull. Mar. Sci. 83, 251–271.
Walters, C., Pauly, D., and Christensen, V. (1999). Ecospace: prediction of mesoscale spatial patterns in trophic relationships of exploited ecosystems, with emphasis on the impacts of marine protected areas. Ecosystems 2, 539–554. doi: 10.1007/s100219900101
Walters, C., Pauly, D., Christensen, V., and Kitchell, J. F. (2000). Representing density dependent consequences of life history strategies in aquatic ecosystems: EcoSim II. Ecosystems 3, 70–83. doi: 10.1007/s100210000011
Ward, E. J., Oken, K. L., Rose, K. A., Sable, S., Watkins, K., Holmes, E. E., et al. (2018). Applying spatiotemporal models to monitoring data to quantify fish population responses to the Deepwater Horizon oil spill in the Gulf of Mexico. Environ. Monit. Assess 190:530.
Waring, G. T., Josephson, E., Maze-Foley, K., and Rosel, P. E. (2012). US Atlantic and Gulf of Mexico marine mammal stock assessments 2011. Woods Hole, MA: U.S. Department of Commerce
White, E. D., McCorquodale, M. E., Couvillion, A., Dong, B., Duke-Sylvester, Z., and Wang, S. M. (2017). 2017 Coastal Master Plan: Attachment C3–22: Integrated Compartment Model (ICM) Development. Version Final. Baton Rouge, LA: Coastal Protection and Restoration Authority.
White, E. D., Messina, F., Moss, L., and Meselhe, E. (2018). Salinity and marine mammal dynamics in Barataria Basin: historic patterns and modeled diversion scenarios. Water 10:1015. doi: 10.3390/w10081015
Keywords: ecosystem modeling, wetland loss, Ecospace, Louisiana Coastal Master Plan, large sediment diversions, sea level rise, fisheries species, food web
Citation: de Mutsert K, Lewis KA, White ED and Buszowski J (2021) End-to-End Modeling Reveals Species-Specific Effects of Large-Scale Coastal Restoration on Living Resources Facing Climate Change. Front. Mar. Sci. 8:624532. doi: 10.3389/fmars.2021.624532
Received: 31 October 2020; Accepted: 26 January 2021;
Published: 22 February 2021.
Edited by:
Marilaure Gregoire, University of Liège, BelgiumReviewed by:
Ekin Akoglu, Middle East Technical University, TurkeyPierre-Yves Hernvann, INRA UMR 0985 Écologie et Santé des Écosystèmes (ESE), France
Copyright © 2021 de Mutsert, Lewis, White and Buszowski. This is an open-access article distributed under the terms of the Creative Commons Attribution License (CC BY). The use, distribution or reproduction in other forums is permitted, provided the original author(s) and the copyright owner(s) are credited and that the original publication in this journal is cited, in accordance with accepted academic practice. No use, distribution or reproduction is permitted which does not comply with these terms.
*Correspondence: Kim de Mutsert, Kim.deMutsert@usm.edu; kdemutse@gmu.edu
†Present address: Kim de Mutsert, Division of Coastal Sciences, School of Ocean Science and Engineering, University of Southern Mississippi, Ocean Springs, MS, United States