- The S&P 500 (SP500) (NYSEARCA:SPY) closed just below 4,480 yesterday, a little more than double its pandemic intraday low of 2,237.40 hit March 23, 2020.
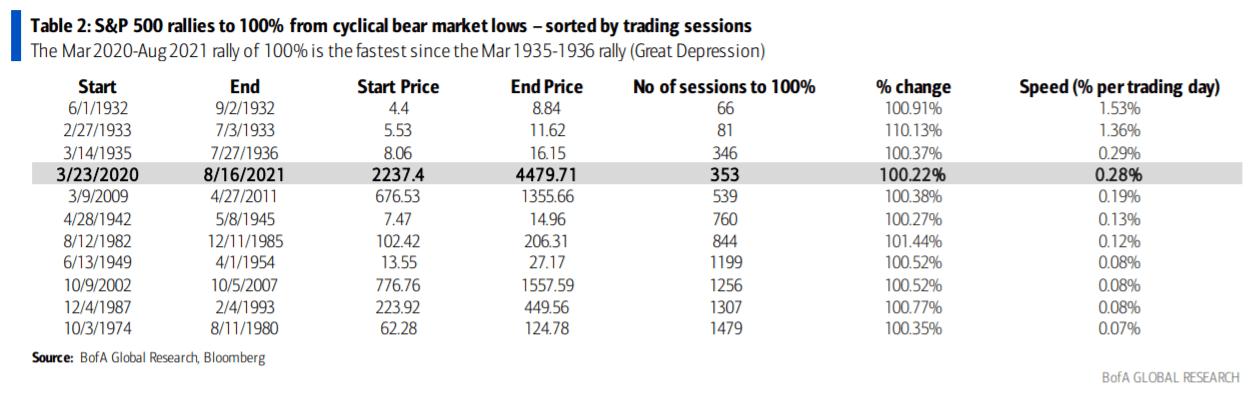
- The benchmark index rose 100.22% in 353 trading days.
- "The SPX rally from the March 2020 low has outpaced the rallies from the 1942, 1974 and 2009 generational lows as well as the rallies from the 1987 crash and 1982 lows," BofA Technical Research Strategist Stephen Suttmeier says. "In terms of speed, the SPX rally from the 2020 low is the fastest since the Great Depression."
- Only 1932 (66 days), 1933 (81 days) and 1935-36 (346 days), saw a faster recovery in levels.
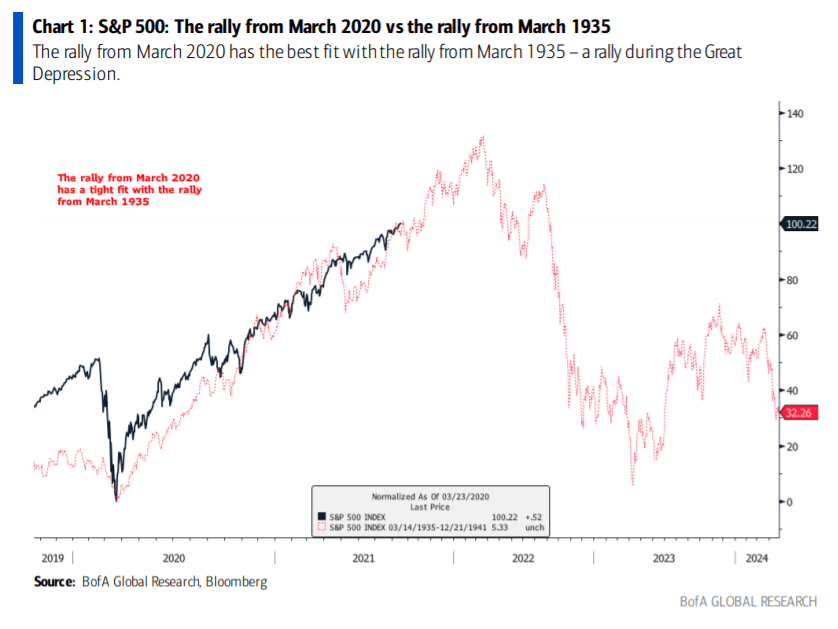
- The rally in 1935 is the best chart fit for the current rally (see BofA chart below), Suttmeier says, adding that "the pace of this rally is not sustainable, and a pause would be healthier for U.S. equities longer term."
- Weaker breadth: The record-high close for the S&P (SP500) yesterday came in narrow NYSE breadth, Suttmeier says.
- "Only 32% of NYSE stocks were up on 29% advancing volume, which points to internal weakness."
- The current bull market ranks 11 out of 26 rallies (with a rise of more than 20% without a 20% correction) going back to 1929, according to BofA.
- "This is above the median bull market of 76.7% (SPX 3950) with room to run to the average bull market of 113.9% (SPX 4785)," Suttmeier adds.
- "At 353 trading days, the SPX rally from March 2020 is the 14th longest rally in terms of time, which exceeds the median length of 311 trading days (June 2021) for these bull markets, but there is room to run to the average length of 690 sessions (December 2022)."
- The key S&P (SP500) levels start with first support of 4430-4422, Suttmeier writes.
- "If this holds, a bull flag would suggest a melt-up to 4560-4600. The 4381-4369 upside gap from 7/23 survived two downside tests (7/27 and 8/3) and remains an important tactical support."
- Oppenheimer took a historical look at the S&P's streak without a 5% correction yesterday.