| Vol/Iss | Pub. Date | Publication Action | Reason |
|---|---|---|---|
| 29/26 | 09/07/2015 | Applications OPI | |
| 29/25 | 02/07/2015 | Complete Applications Filed |
Last Updated: 30/07/2016
Claims
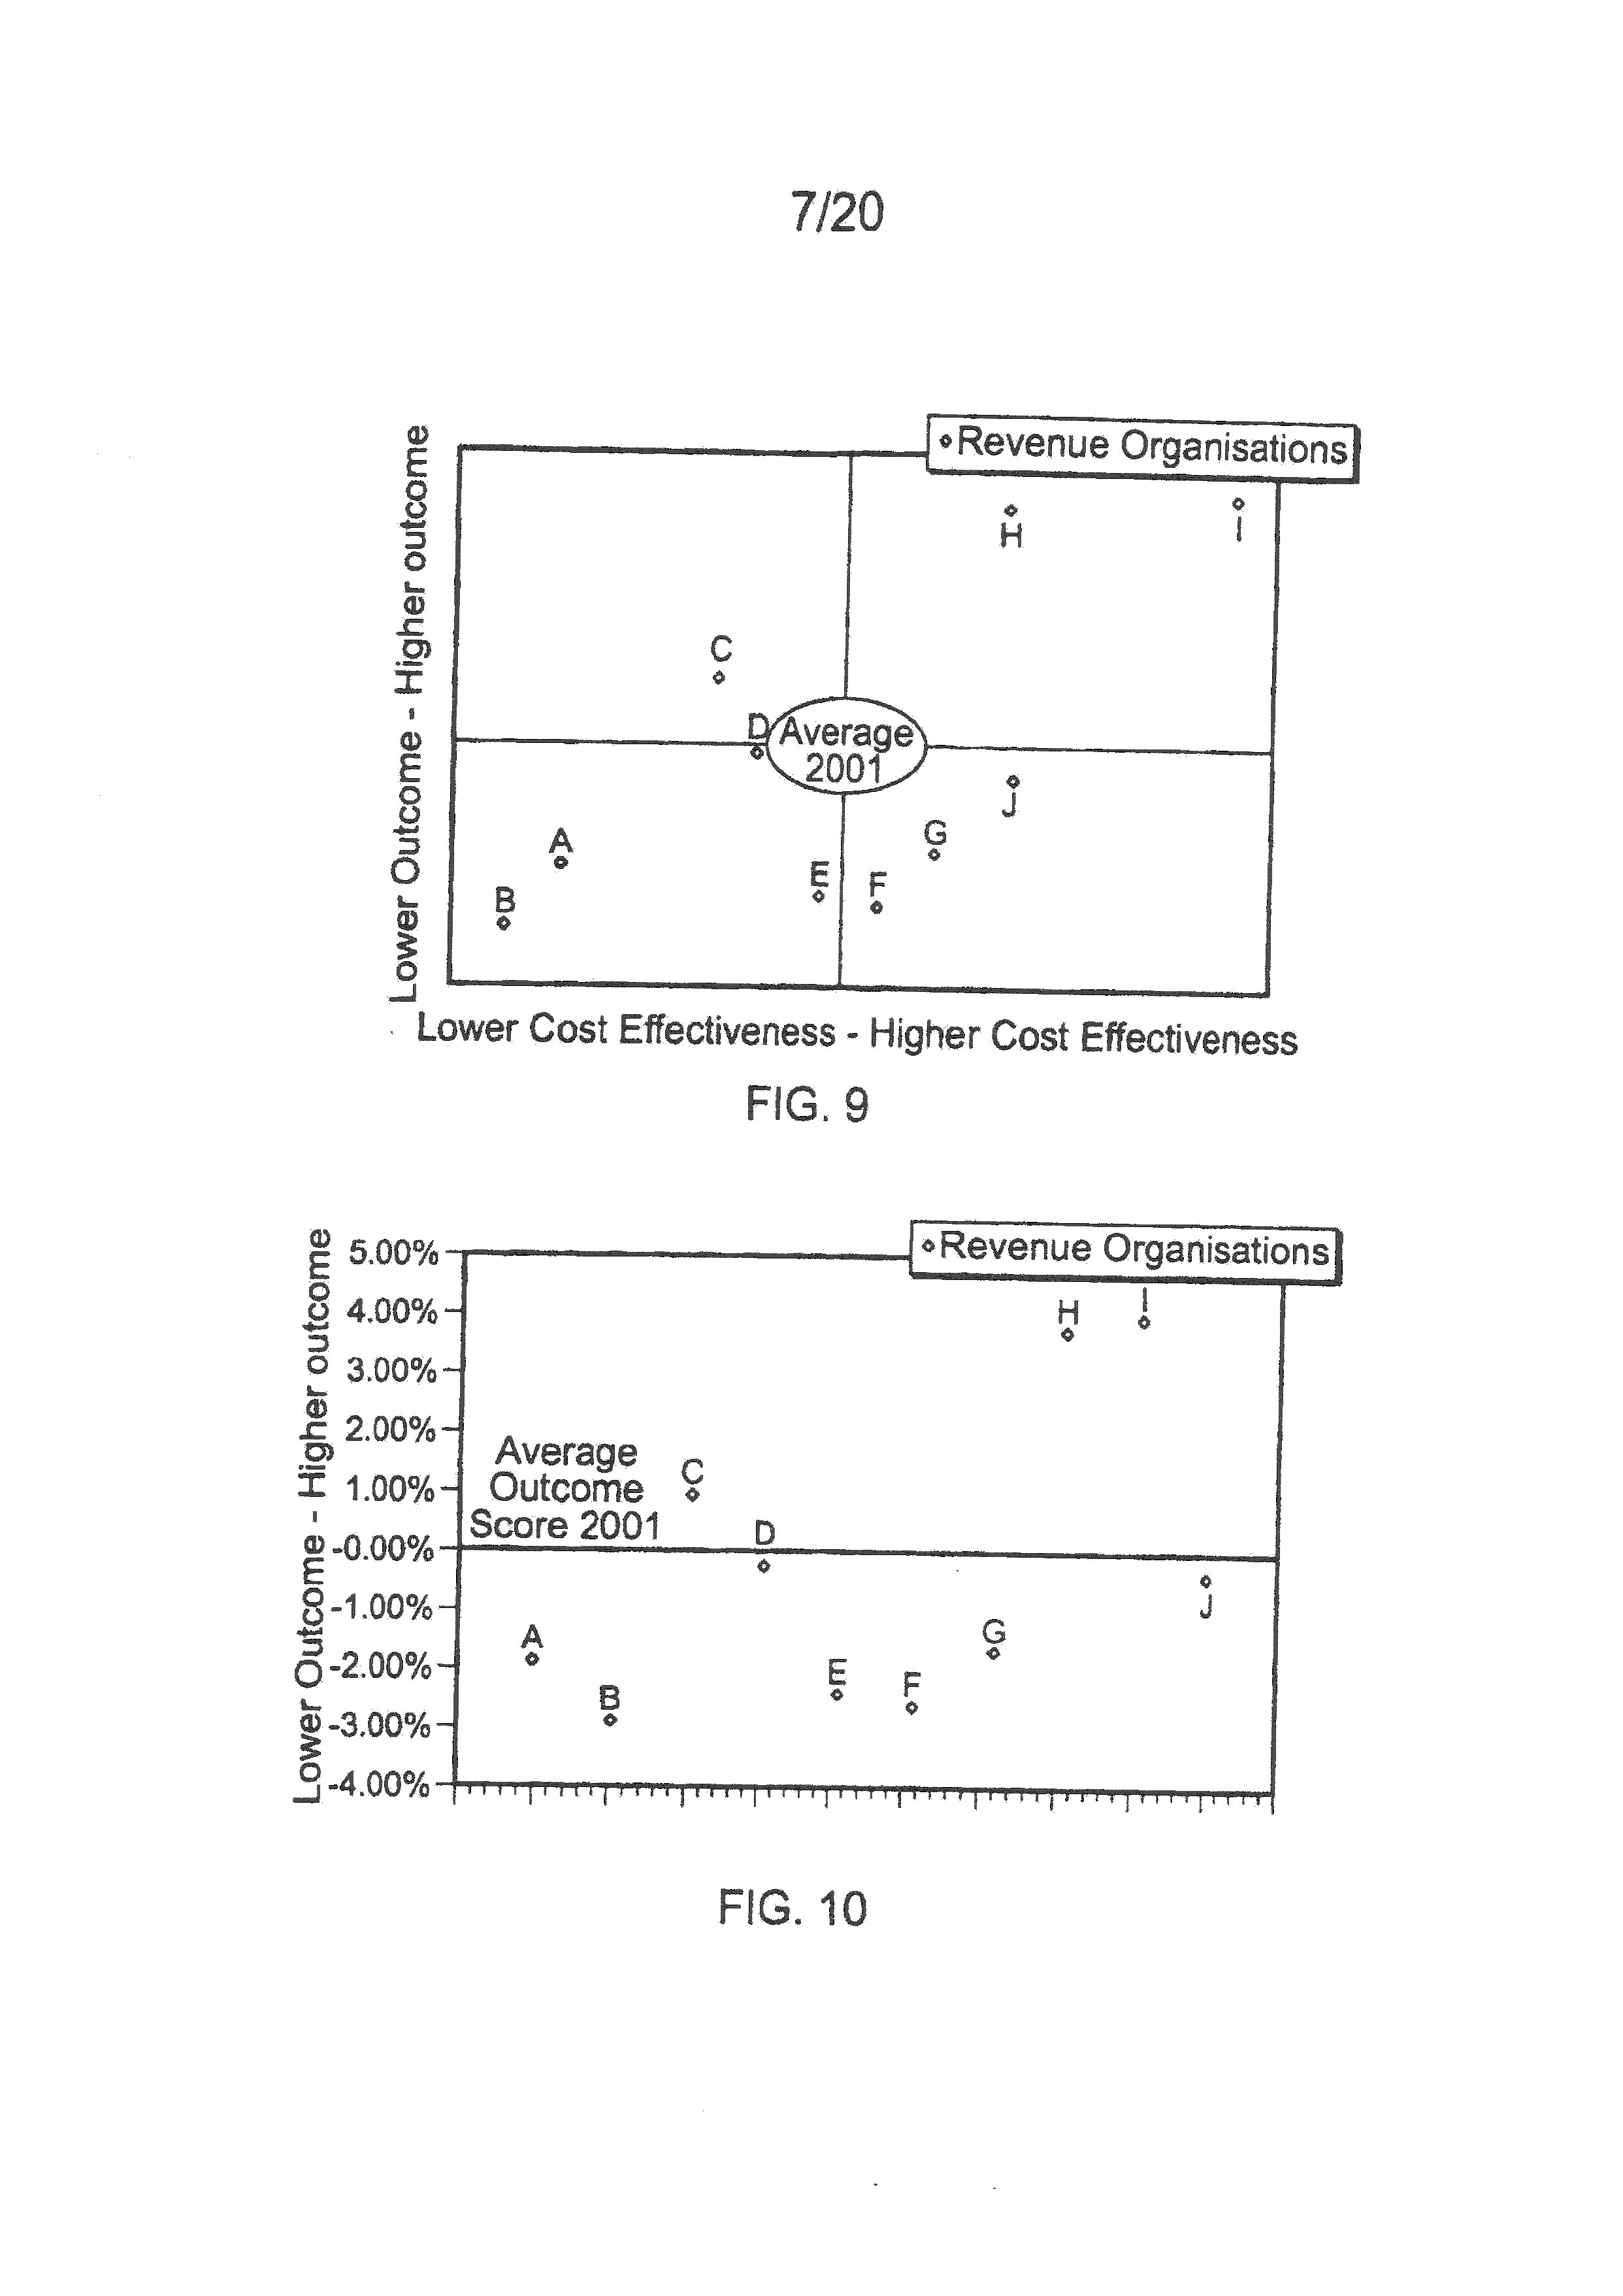
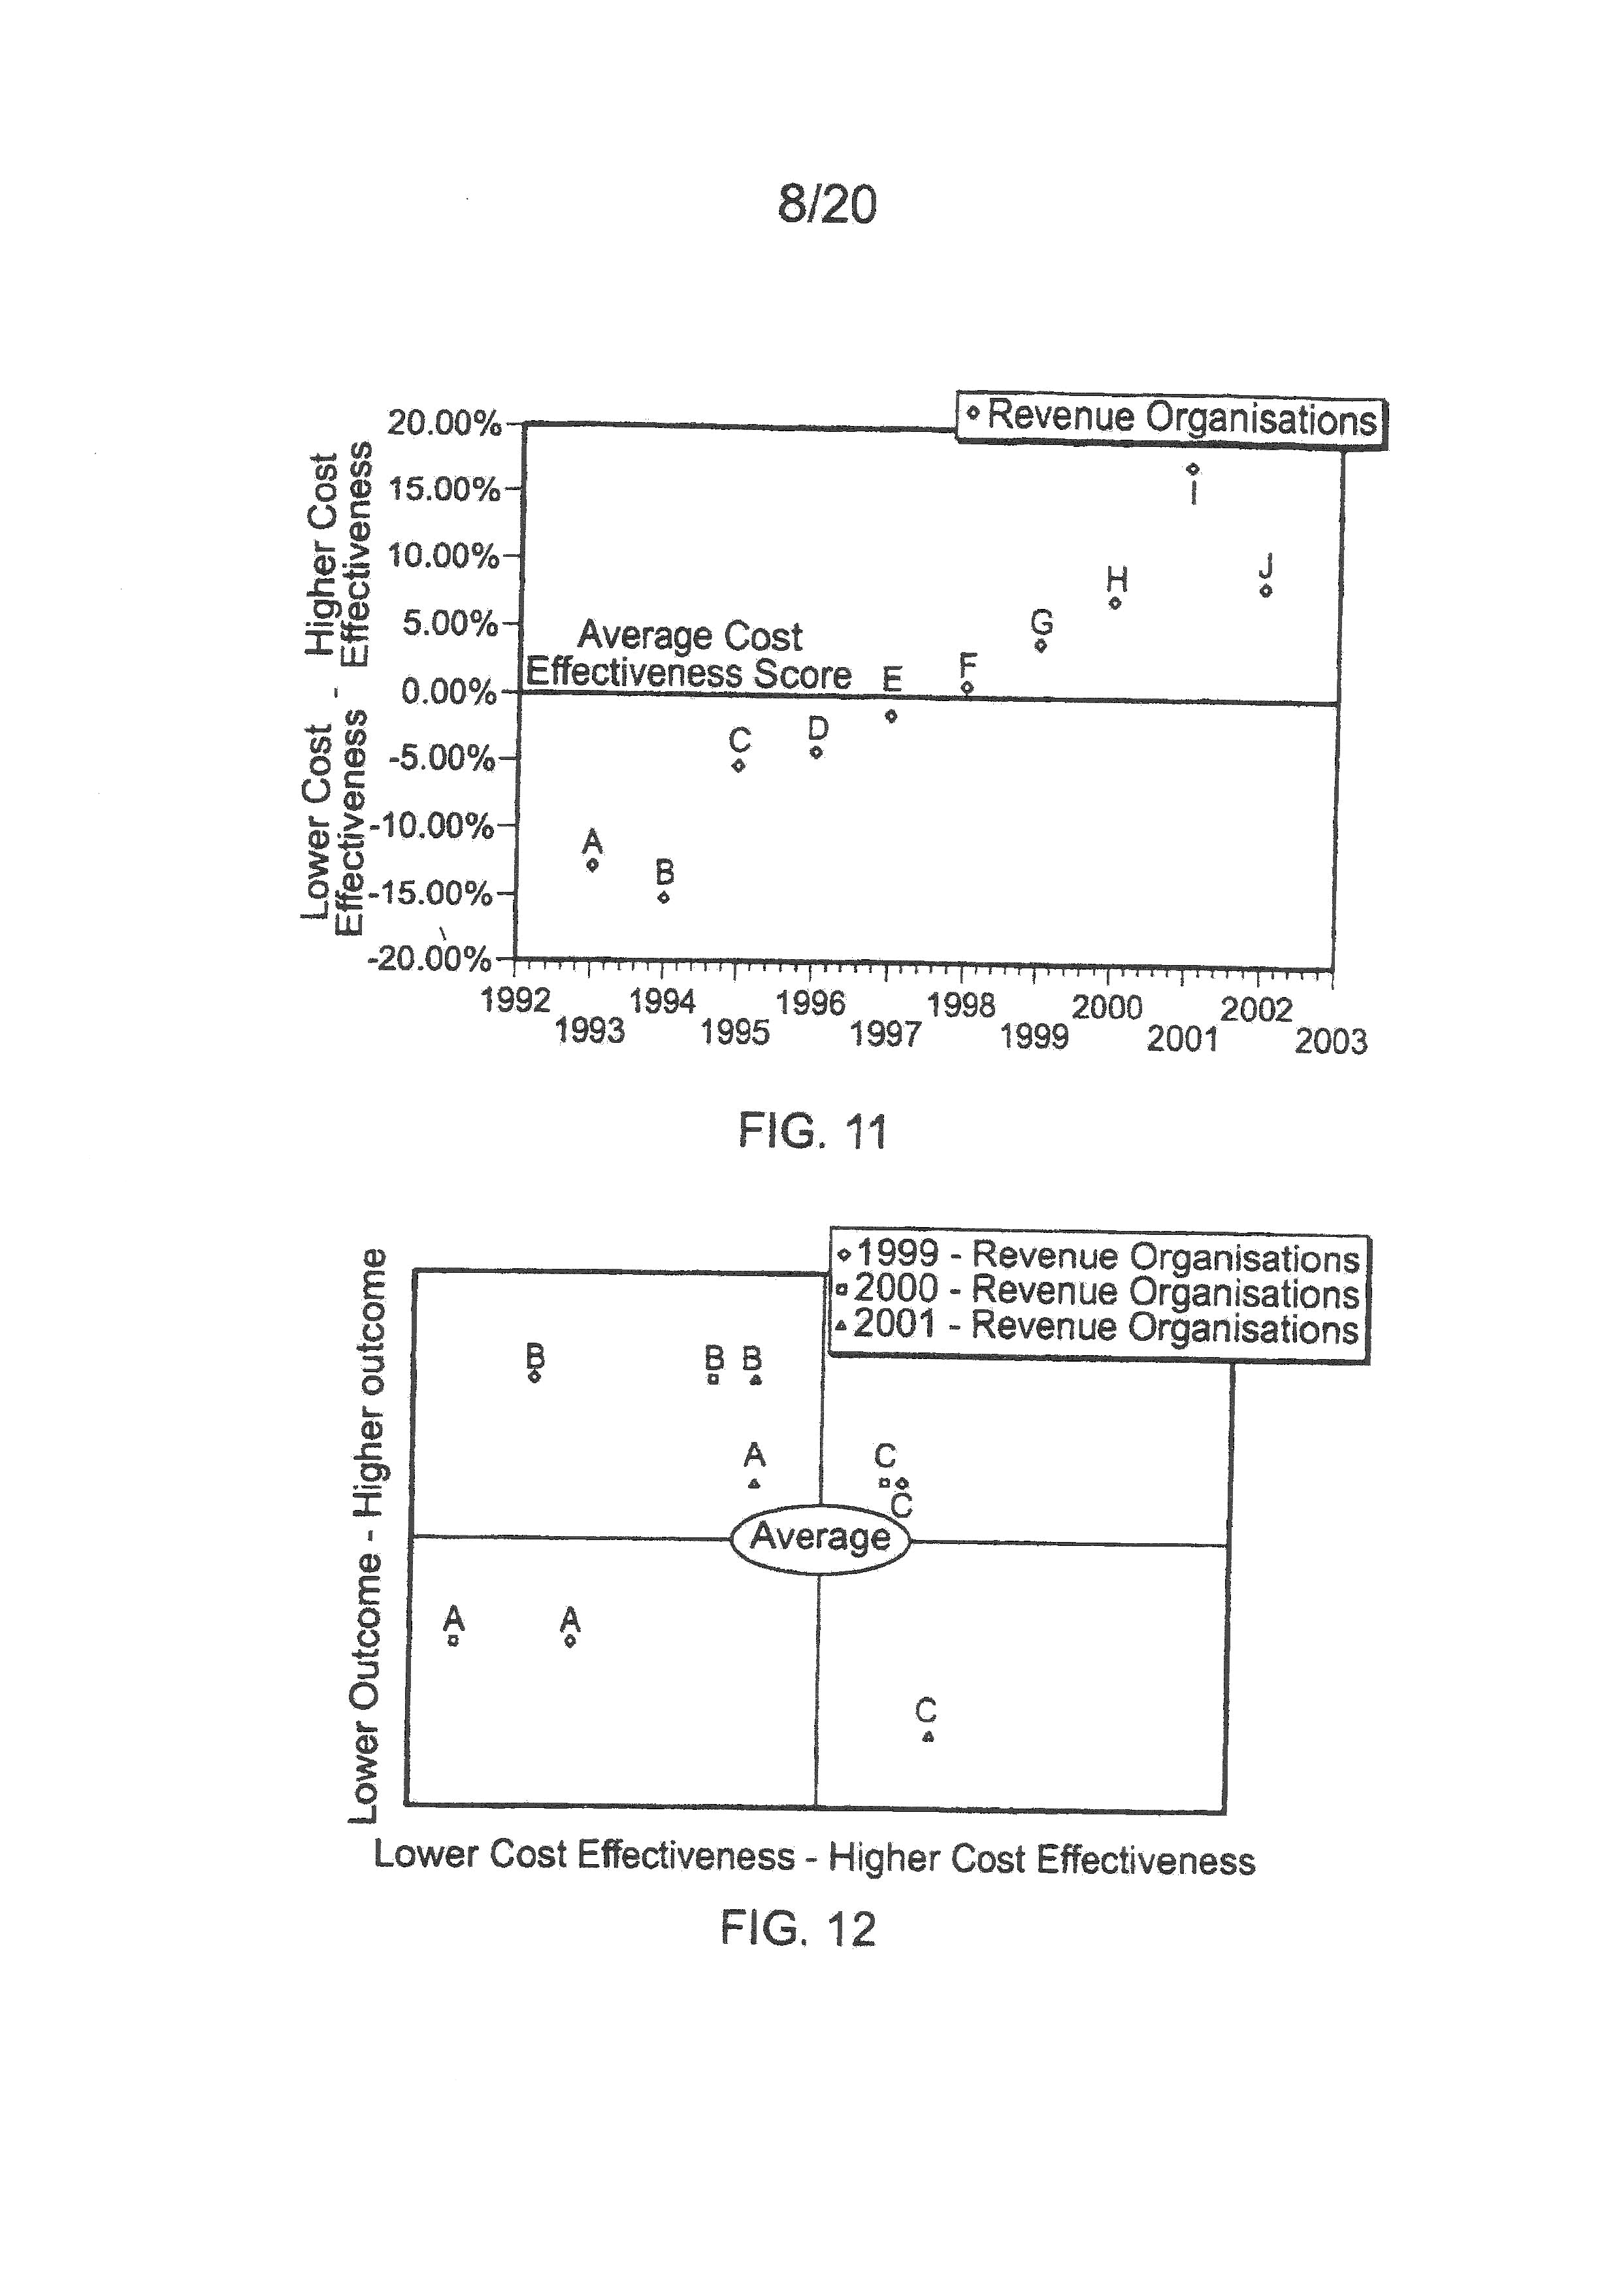
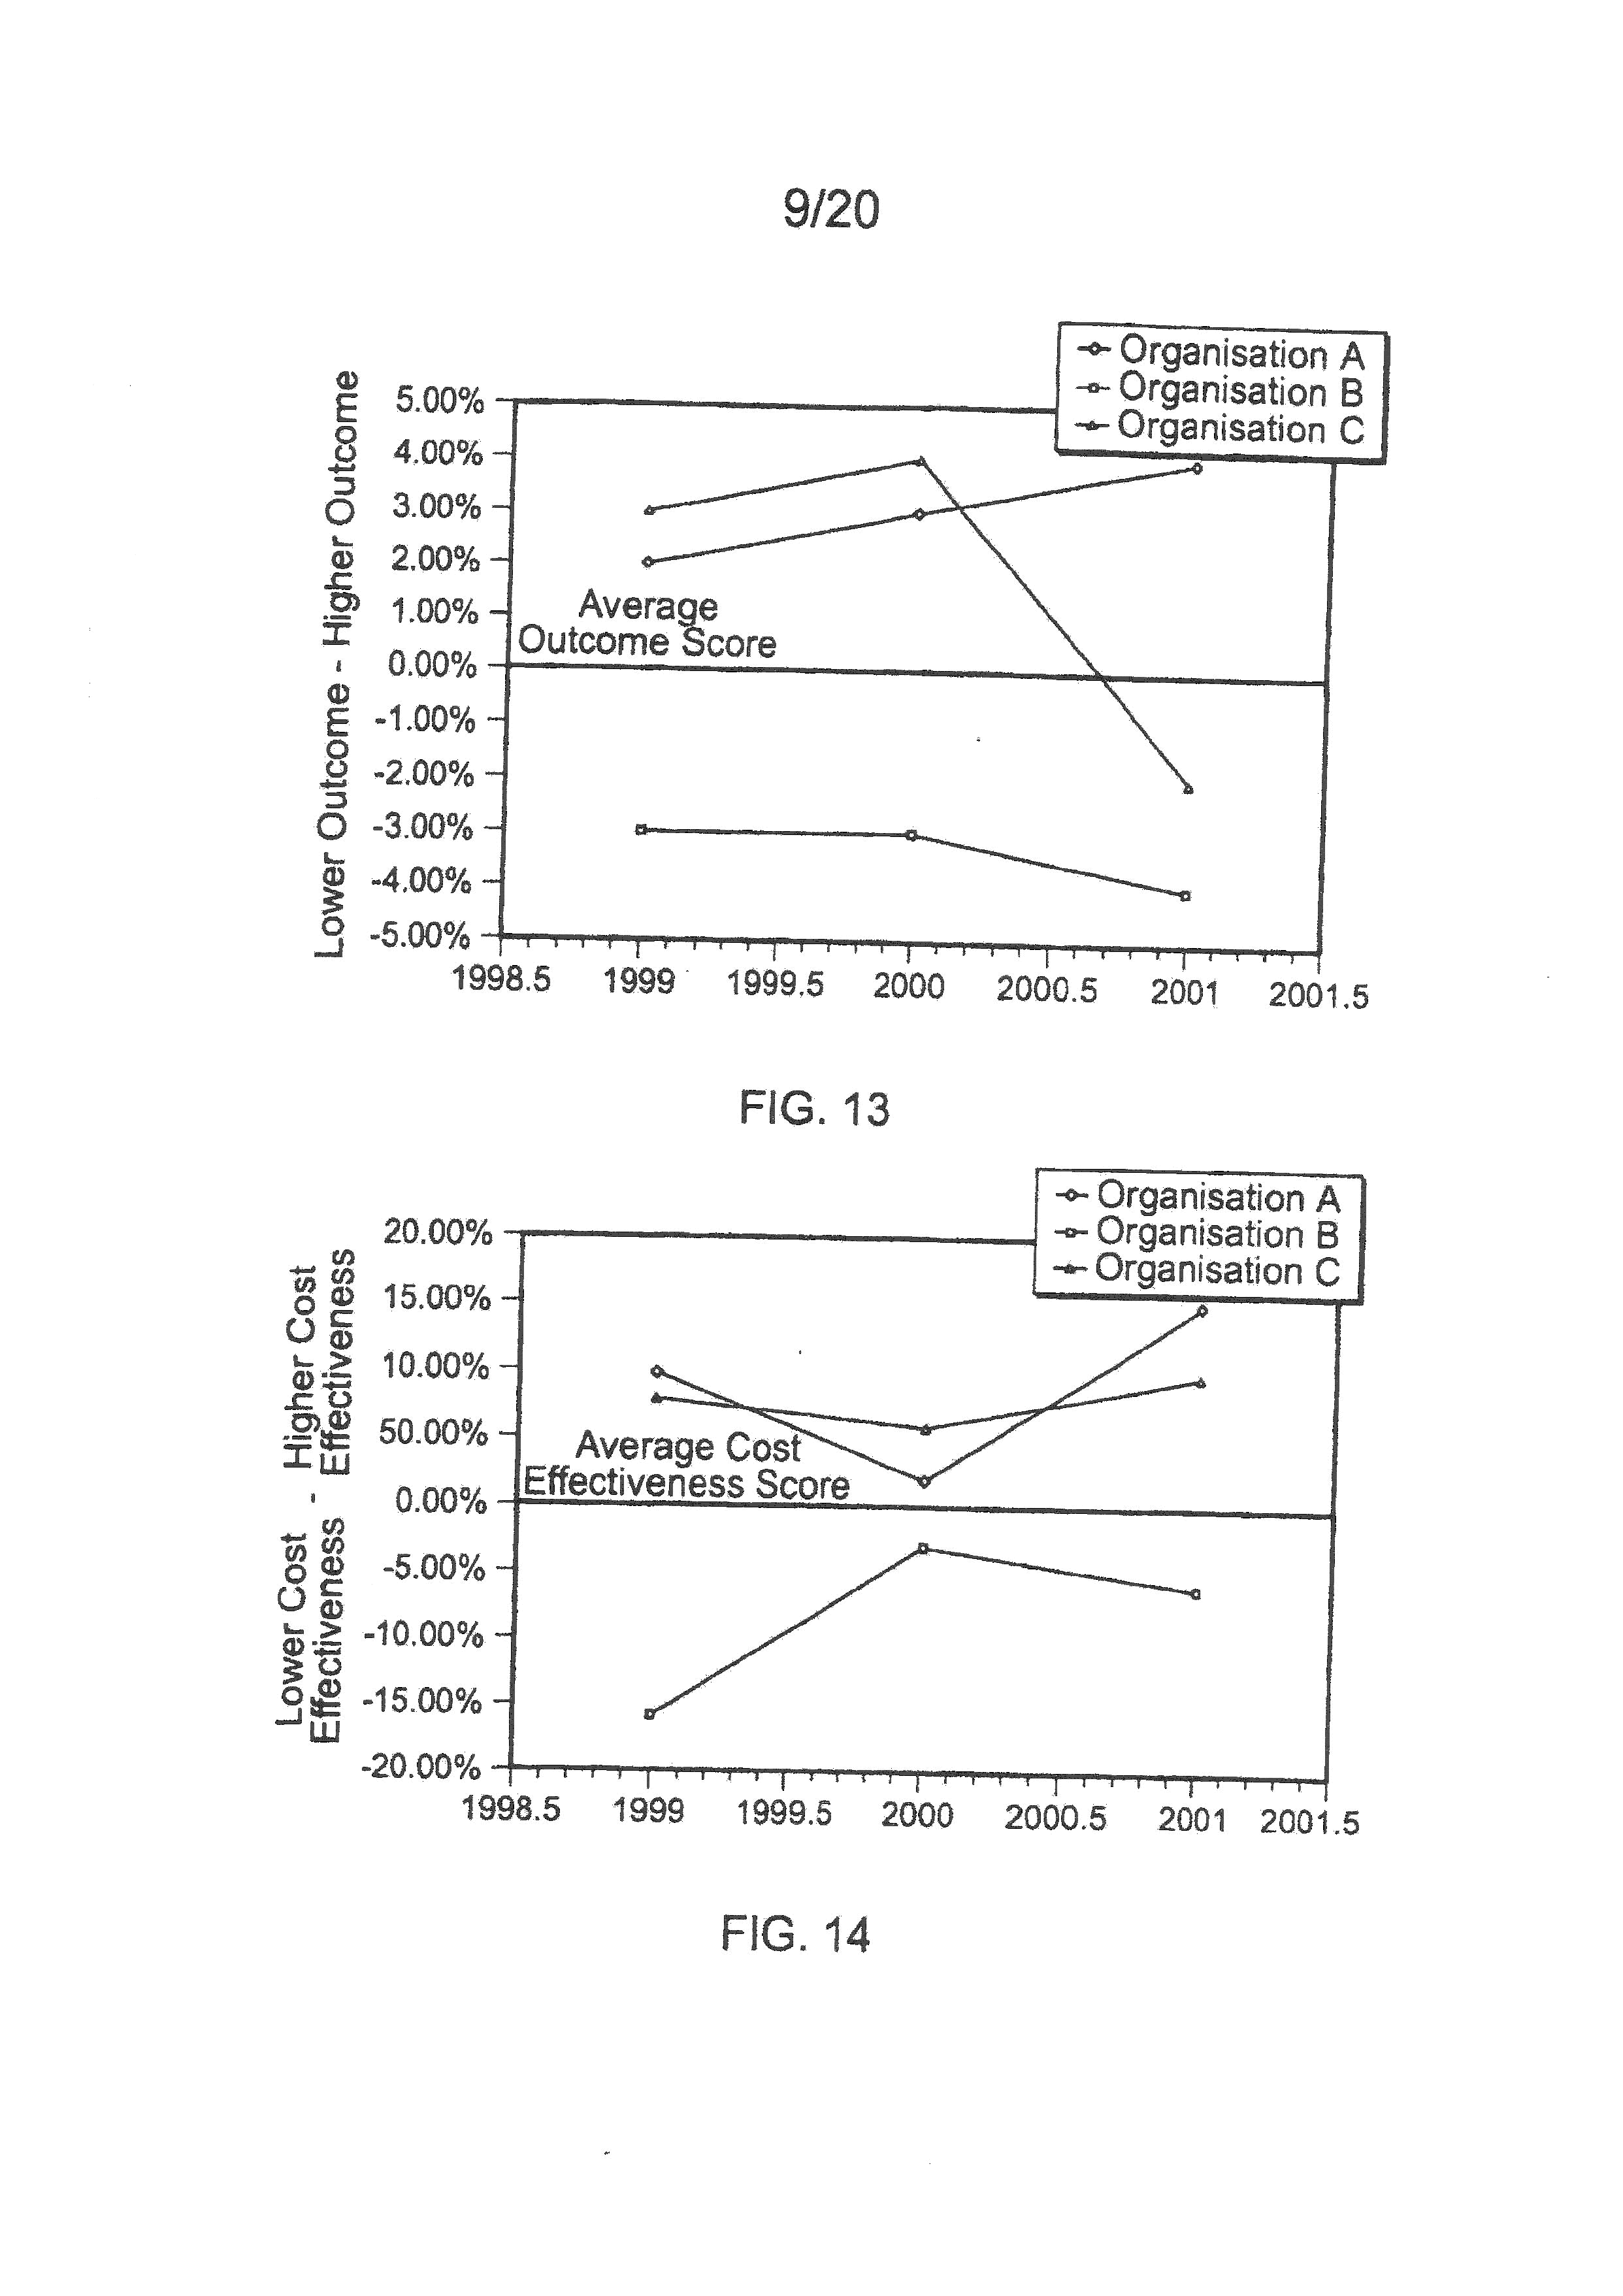
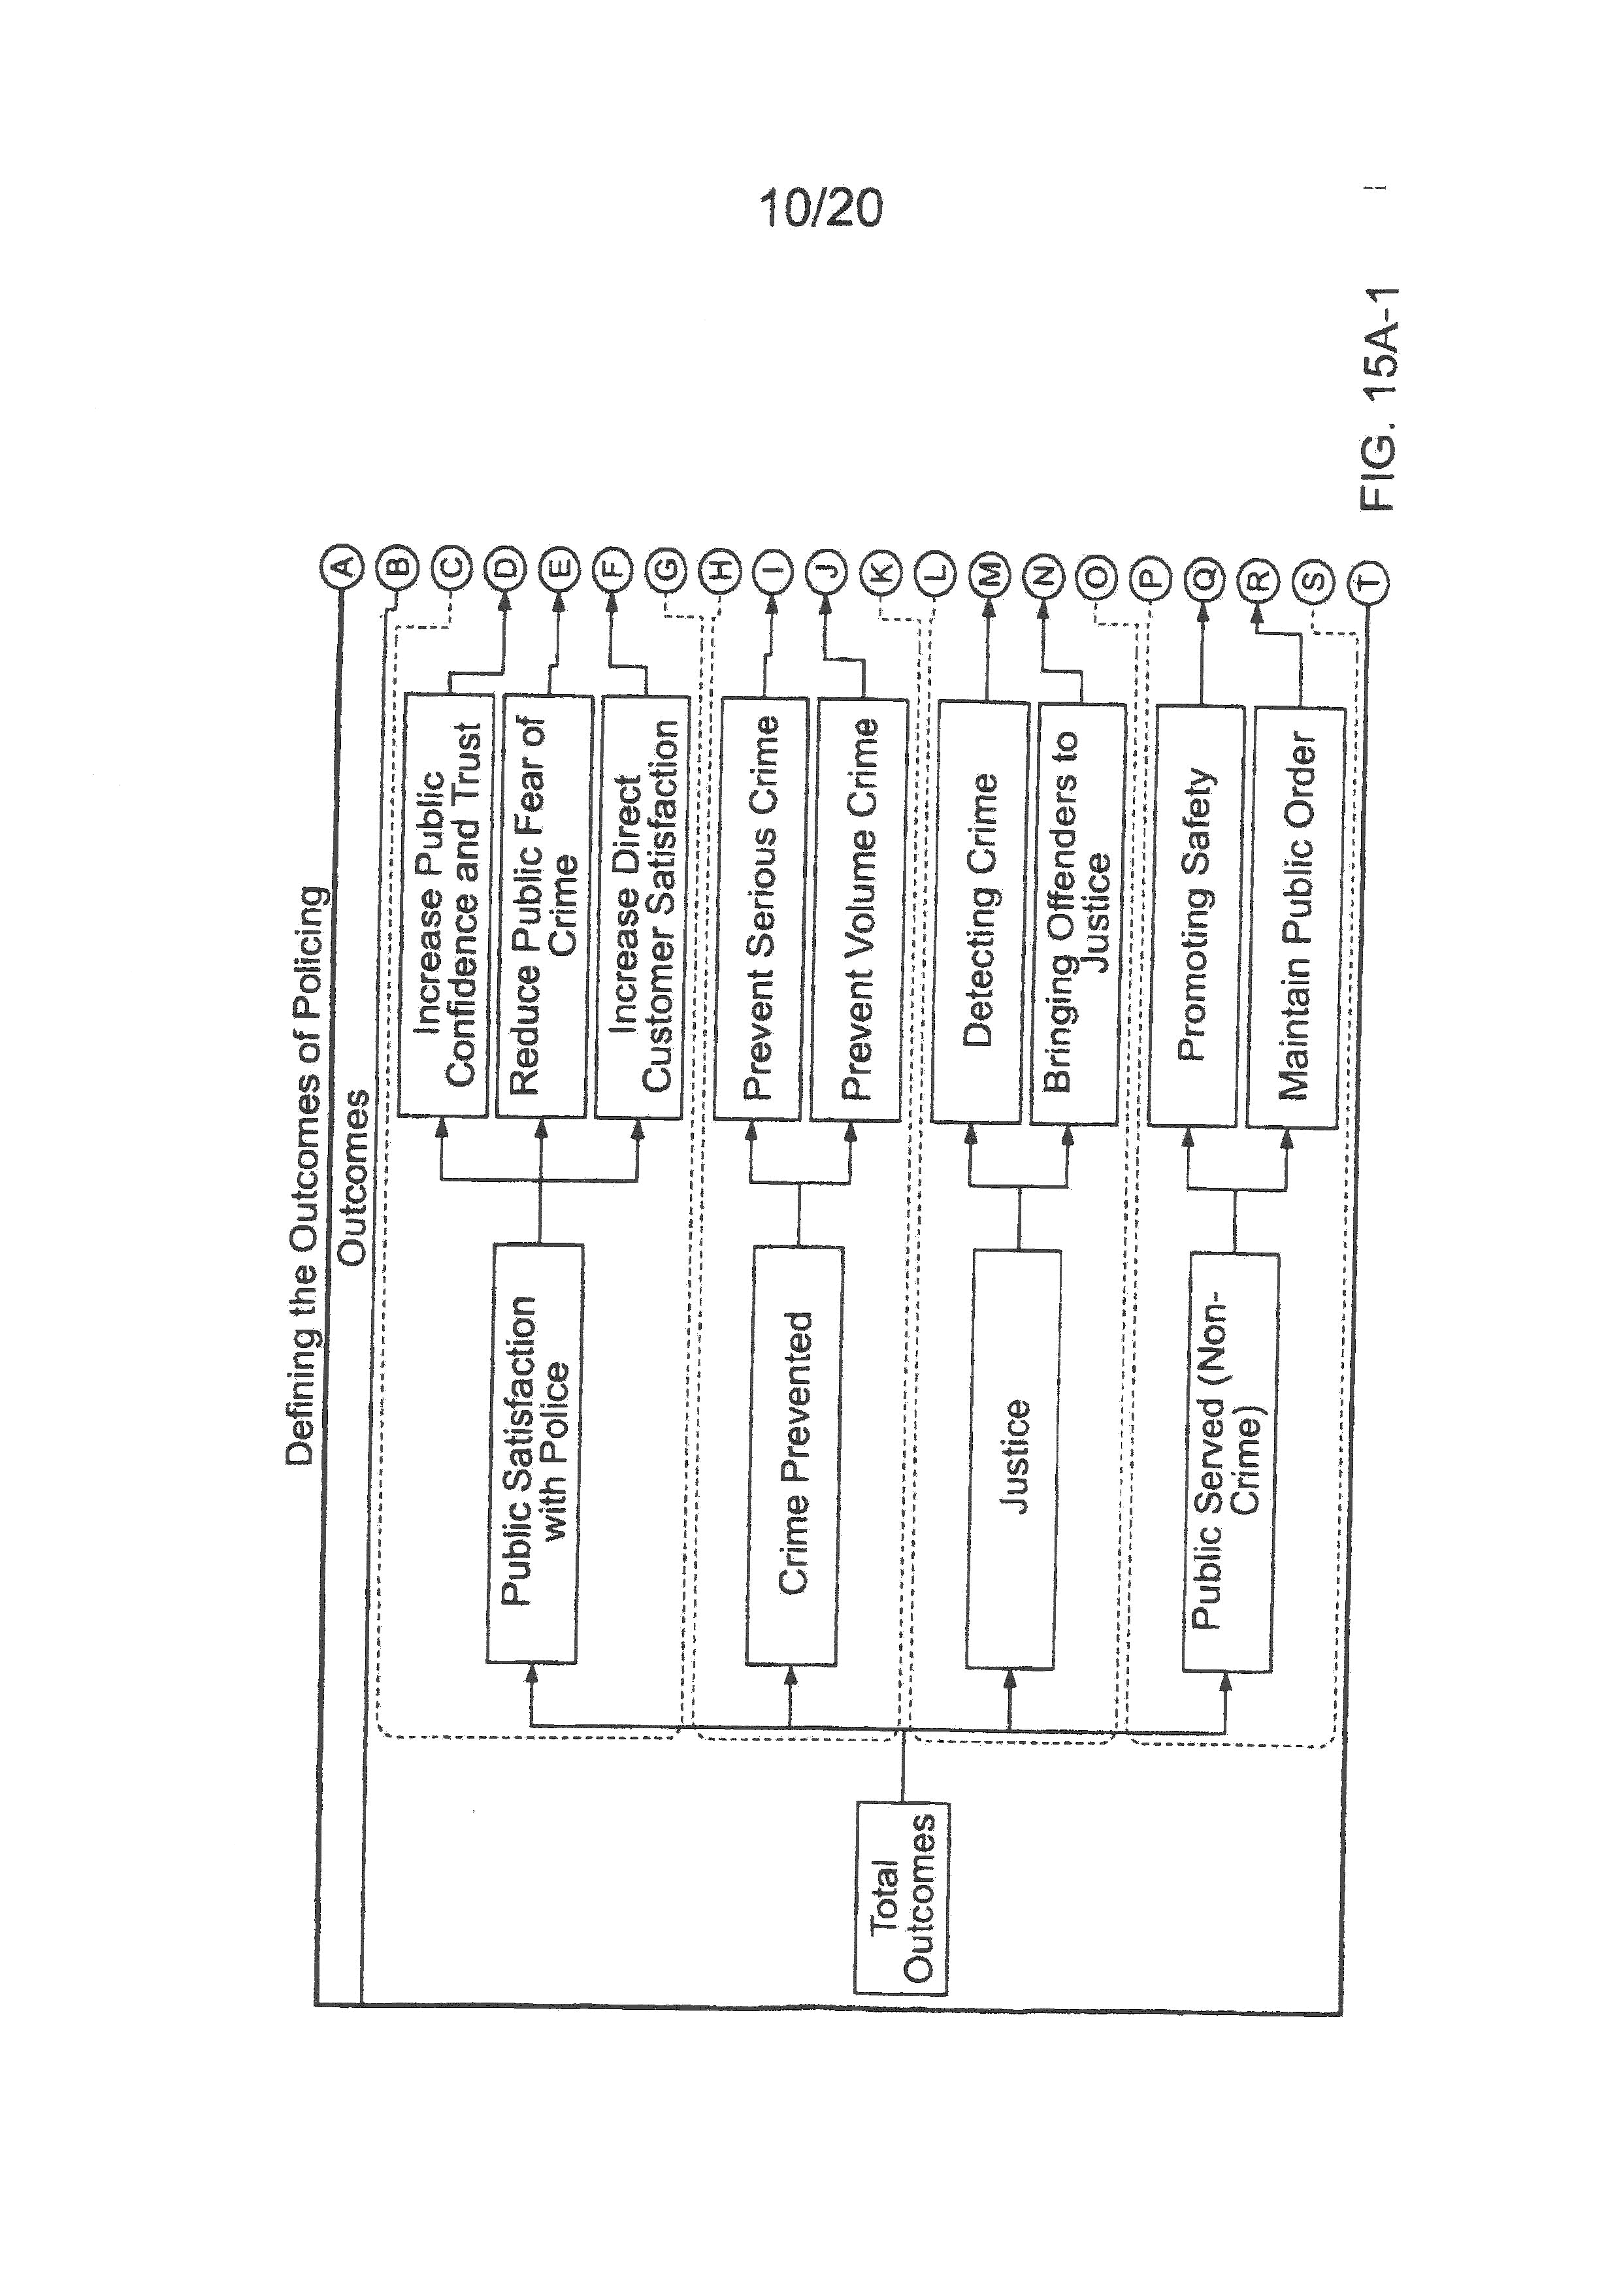
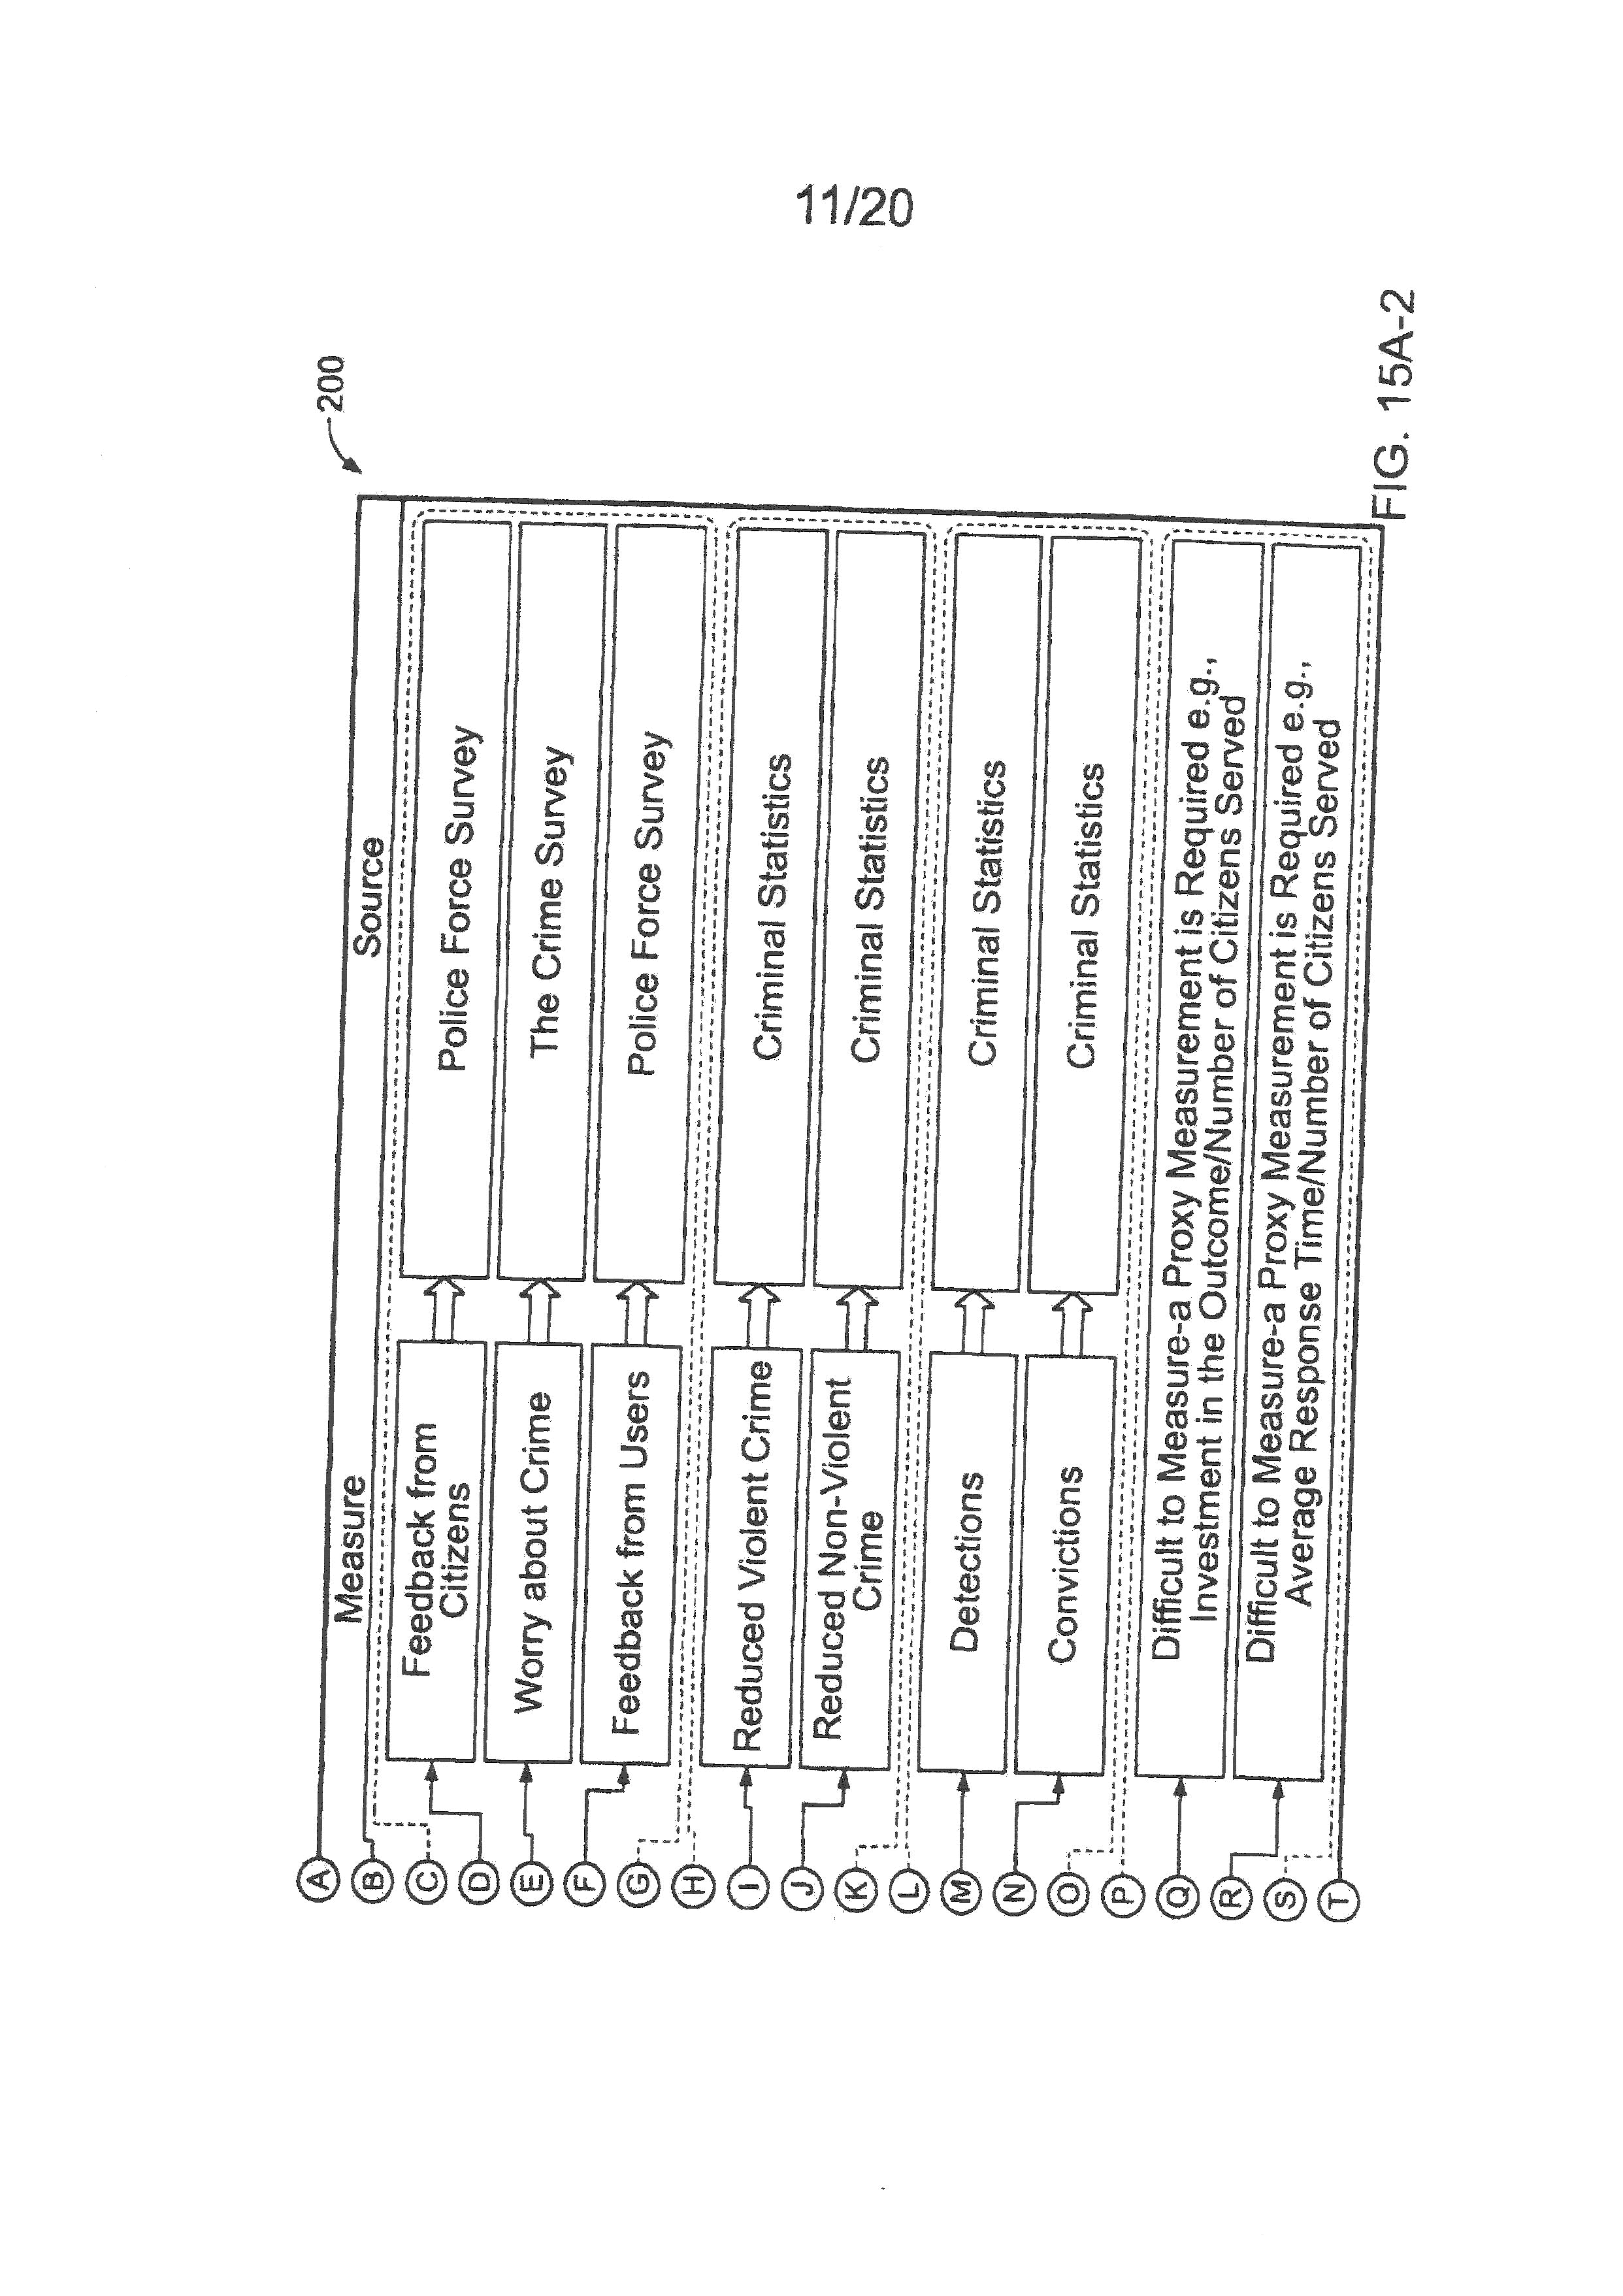
and fomm the claims. BRIEF DESCRIPTION OF I NE DA NGS FIG is a diagram of a shareholder model for a private sector rganizatio FK. 2 is a diagrai of a public sector value model according to an nipiementation of 20 the invenion. FIG. 3 lustratesa methodkgy for developing an outcome model. HIG. 4 is graph showing an organization performance over time in comparison to an overall average performance, FIG. 5 is compass representation illustrating various outcomes and cosT effectiveness 25 vectors. FIG. 6 is graph showing both outcome and cost effectiveness for a time series/single organization matrix FG. 7 is a graph showing the outcome performance alone, of the organization, over a period of time relative to its average score, 30 FIG. 8 is a graph showing an organization's cost effectiveness performance over a period of time relative to its average score. PIG. 9 is a graph showing an organization's outcomes and the cost effectiveness score relative to the average organizations performance within a particular year. 35-7d FIG. 10 is a graph showing the outcome performance for a number of organizations relative to the average organizations performance within a particular year. FIG. 1 I is a graph showing, the cost effectiveness performance for a number of organizations relative to the average organizations performance within a particular year. 5 FIG, 12 is a graph showing the outcome and cost effectiveness performance for a number of organizations relative to the average organizations performance over multiple years, here three years. FIG, 13 is a graph showing the outcome perforTmance fbr a number of organizations relative to the average organizations over a period of time relative to the average score. 10 FIG, 14 is a graph showing the cost effectiveness performance for a number of organizations relative to the average organizations over a period of time relative to the average score. FIGS. I5A-5 are diagrams of publ sector value model of puic sector organizations according to an implementation of the invention. 15 FIG 16 is a graph of a plot of an industry analysis according to an implemnentation of the invention. FIG, 17 is a block diagram ofia computer system for implementing a model of producing a public sector value according to an implementation of the invention, FiG. I8 illustrates a methodology of developing a public sector value model. 20 Like reference Symbols in the various drawings indicate like elements.DETAILED DESCRIPTION Referring to FIGS. I and 2, diagrams of a shareholder model for a private sector organization and for a public sector organization are shown The shareholder value model 50 represents a means of approximating the true value of commercial 5 organizations. Commercial organizations exist in order to create value for their shareholders. This is the basis for the shareholder value model 50. It should be noted that although the true value of a commercial organization may have a strong bearing on its actual value (i.e. share price), it does not necessarily follow, since a variety of factors might affect a commercial organization's share price in a manner which may 10 cause a deviation from true value (such as overly optimistic or pessimistic expectations of future performance). As a context for developing a public sector value (PSV) model 60, a commercial sector organization has some distinct advantages over that of the public sector which make valuation easier to apply. 15 First, value is a readily identifiable starting point for commercial considerations. The commercial model can start from a consideration of what factors affect the basic measure of value - share price. The fact that a measure of value already exists for shareholders suggests that private sector value can be both understood and ultimately tested. The axes of the private sector model are the two 20 key levers of shareholder value - the ability of the organization to generate a return over and above that required by its shareholders and the extent to which the organization can grow the absolute size of the investment. It should be noted that the value provided to other private sector stakeholder groups (such as employees) is actually more difficult to measure and in fact far more akin to the public sector in 25 terms of a poorly defined understanding of value. Second, the shareholder value model 50 may provide an advantage over any public sector equivalent because its core currency of value is in the form of money. The commercial sector can specify inputs and outputs all in terms of monetary value and consequently the issues of comparability which plague any public sector model 8are avoided, Examples include public sector outcomes such as improved health or reduced levels of crime, which do not have inherent and obvious fmancial values. However, despite these differences, the shareholder value model 50 represents a useful starting position for developing a PSV model 60, The shareholder value 5 model 50 suggests that anything that affects the true value of an organization to its owners will be reflected on one of the axes. Therefore, it must be the case that the axes in the PSV model 60 reflect all public sector value. It may not be possible to suggest an organization that is delivering value to the public in a way that is not reflected within the model. 10 The shareholder value model 50 measures the value of commercial organizations in terms of value to owners. This is not the only way of understanding value. Value, even in a commercial context, can be measured from the point of view of other stakeholders, such as employees, suppliers, customers or communities in which organizations are based. 15 Outcome vs. Outputs The achievements of public sector organizations may be understood in terms of outcomes of social benefit. That the end result of the activity of a public sector organization is beneficial to some group of society who deserve that outcome is a 20 justification for that public sector organization. Thus, socially beneficial outcomes can be used as measure of the value of public sector organizations. There is a distinction between outcomes and outputs - a distinction familiar within the realm of performance measurement. Outcomes in this context are the achievements of organizations in terns of affecting pre-existing social realities. 25 Outputs, however, are the end result of organizational processes. For example, an output of a police organization might include an arrest. An outcome of the police organization (and indeed an outcome of this particular output) might be the avoidance of criminal activities that would have been carried out by the arrested individual. 9Outcomes can be used as a direct lever of public sector value, whereas outputs are only valuable in as much as they deliver outcomes. An organization might be very good at delivering outputs that are of no consequence in terms of any outcome. This would not represent public sector value. Therefore, the PSV model 60 seeks to 5 measure outcomes rather than outputs, Changes in total outcomes may be associated with the shareholder value model 50 in terms of growth in revenue. However, a shareholder may be interested only in the growth of revenue after they become a shareholder (as this increases the value of their investment - assuming spread remains constant), However, in the 10 public sector, growth is not as significant a lever of value as total level of outcomes generated. Citizens may be interested primarily in the level of service provided, and not specifically in whether there has been an increase, For example, a police force which has consistently provided a very high level of service is of equal value to one which has matched its performance through spectacular growth (even though 15 management in the latter might be said to have achieved a more significant task). Measurement of the change to social outcomes is to some extent a practice already familiar within the public sector, To some extent, government performance is seen to be related to the levels of key outcome indicators for public services (such as levels of crime or education), 20 The measurement process includes the task of separating outcomes from outputs such that only outcomes are being measured. To apply this principle to any government industry requires the identification of the outcomes of that industry. This process can be performed through background research as well as consultation with experts and practitioners. 25 One approach for defining outcomes is to begin with a consideration of the very high level goals of any public sector organization. This is tended frst level outcomes'. In some cases this will be a list of three or four. In the case of the public health, for example, it would include prevention of ill health and the correction of ill health through treatment. 10In addition to these outcomes, the application of the PSV model 60 should also include a "Meeting Public Expectations" first level outcome. This outcome would be in addition to any others identified and would encompass all measures of service provision which are ultimately valued by the public, whether or not they are in fact 5 core to the organization's fundamental goals. It may also be necessary to make an analysis of any outcomes, which are a consequence of the organization's operation, whether beneficial or otherwise. Such outcomes may need to be taken into account when determining the total outcome of an organization's operation and in some cases may need to be negatively weighted 10 such that their occurrence causes a reduction in the value of the organization. For example, such an outcome may include interference with free trade generated through port controls. Having identified these first level outcomes, there can be a translation into lower level outcomes which together aggregate to the first level outcomes described. 15 In the case of the correction of ill health, this list would include increased 'he