Microcredit and Survival Microenterprises: The Role of Market Structure


Lubin School of Business, Pace University, 1 Pace Plaza, New York, NY 10038, USA
Int. J. Financial Stud. 2018, 6(1), 1; https://doi.org/10.3390/ijfs6010001
Submission received: 13 September 2017
/
Revised: 15 December 2017
/
Accepted: 16 December 2017
/
Published: 23 December 2017
Abstract
:Poverty remains a pervasive problem all over the world, but the problem is worst in underdeveloped areas like Africa. While microfinance is supposed to address this problem through the promotion of viable businesses, it has not been very successful in helping survival microenterprises, i.e., businesses that the very poor with limited human capital have access to, in sectors with low barriers to entry and selling undifferentiated products. In this paper, I examine the role of market structure in mediating the impact of micro-lending to such survival enterprises. While there have been many evaluations of microfinance institutions (MFIs), there have been very few that look at market conditions as an input into the success of micro-lending. My theoretical analysis suggests that when introducing an extensive program of microcredit in undeveloped and relatively isolated rural areas, it is important to look at how the market structure mediates the impact of the provision of loans on the demand and supply for the end-product or service. I present some empirical evidence, which provides partial confirmation that MFIs are not currently taking these considerations into account.
JEL Classification:
O16; D40; G21; L31Most observers agree that in the right circumstances microfinance can increase household incomes, but its impact on poor clients remains controversial. Judith ShawAre microloan recipients at the bottom-of-the-pyramid benefited to the extent microfinance practitioners want them to be? And if not, what changes are necessary in MFI lending policies?
1. Introduction
About ten years ago, in an influential article, Cull et al. (2007) wrote about the promise of microfinance in reducing poverty by employing sustainable banking practices in low-income communities. They found—in contrast to the expectation of profitable lending and poverty reduction—that, while many microfinance institutions (MFIs) had high loan repayment rates, relatively few were profitable. Their conclusion was that there is a trade-off between profitability and serving the poorest of the poor. In their own words, “(t)he evidence suggests that investors seeking pure profits would have little interest in most of the institutions we see that are now serving poorer customers”. This observation is consistent with the distinction made by Robinson (2001) between MFIs following the financial systems approach (roughly equivalent to sustainable microfinance or microfinance without subsidies) and the poverty lending approach, which concentrates on overcoming poverty by providing credit at subsidized interest rates (Hermes and Lensink 2007). If investment capital is not forthcoming to aid the poorest of the poor, then are we dependent on subsidizing MFIs to aid the poor? On the other hand, given the evidence that a pure aid approach is also not very effective (Easterly 2006), this is not a very encouraging situation.
While these remarks bring into question the financial viability of MFIs helping the very poor, there is also doubt as to whether the impact of microfinance on the lives of clients has even been positive. Early studies of the impact of microfinance on poverty were glowing ((Pitt and Khandker 1998) for example), but later researchers, using randomized control trials, concluded that such results may have been due to selection bias (Karlan and Zinman 2011; see also Morduch 2011). On the other hand, Zhang (2017), using cross-country panel data, shows that microfinance may indeed help mitigate poverty. Even if microfinance does not reduce poverty, per se, Morduch (2011) and others have pointed out that, at the very least, it does help families cope with economic challenges. As Bauchet et al. (2011) put it, poor households “use a variety of informal and semi-formal mechanisms to cope with risk, seize opportunities, manage the risks and inconveniences that come from having uneven cash flows, and smooth household consumption”; microcredit is one of the formal mechanisms that households use for this purpose (Johnston and Morduch 2007). One conclusion to draw from all of these studies is that microfinance can make the lives of the extremely poor better, but only through consumption smoothing and only if MFIs are subsidized. This suggests that the original promise of microfinance to address poverty through promoting sustainable livelihoods must be abandoned. Although most researchers have investigated MFI profitability and MFI impact separately, these two issues are, in fact, related: if it is possible to benefit poor MFI clients by helping them operate viable and profitable businesses, the chances of the MFIs themselves being profitable are much greater.
In the second half of the last century, financial institutions seeking to lend to microenterprises quickly discovered that information asymmetry and scale issues made such loans unprofitable. In response, MFIs introduced many new technologies that changed the way financial services were marketed to the poor. For one, information asymmetry problems that plague all lending institutions were addressed using joint liability lending or variations of it that relied on social capital. Creative solutions were engineered on the delivery side, as well: in collection technology and in product design (Morduch 2013). Much less attention has been paid, however, to the activity on which the loan is based. In this paper, I re-examine the case of microcredit for the poorest of the poor by looking not at the technology of delivery and collection, but rather at the market structure within which loans to the very poor are often made. By market structure I mean, specifically, the demand and supply environment for the different products and services, whose supply is affected by the expansion of MFI credit. This includes the competitive environment, the ease of entry into the industry, the lag between investment and production and all the myriad factors that allow a supplier to acquire sufficient market power in order to create a profitable enterprise. I define an inhospitable market environment as one that is very competitive, and where ease of entry into the industry is low, where the size of the market is small and difficult to enlarge. The nature of such geographical environments is that average income levels here also tend to be low; hence, loans made in these areas also tend to be made to the very poor. This is the connection between market structure and microfinance outreach. My approach will permit me to make some specific suggestions that may potentially reopen the possibility of a long-term sustainable microcredit strategy for the segment of microfinance clients who operate in locations that are home to such inhospitable market structures.
In examining the question of how this may be achieved and what guidance can be given to MFIs and policy makers, broad studies like Zhang (2017) may not be very useful because they provide information on average outcomes; the solution, rather, may lie in the specificities of each environment. Mair and Marti (2007) make this point in the context of rural Bangladesh. They focus on local institutional realities, noting that access to resources by itself can be insufficient. In traditional environments like Bangladesh, on the one hand, culture may prohibit women from owning property and working in market contexts; on the other hand, power structures may keep poorer people from fair access to legal justice in commercial transactions. Thus, the biased operation of local institutions can prevent market access for some agents. An NGO called BRAC (Building Resources across Communities) has been successful in creating village organizations and legal aid clinics to level the playing field and provide equitable access to markets for individuals belonging to disadvantaged groups. Mair and Marti (2007), thus, look at institutional impediments to the successful operation of microfinance-funded rural microenterprises in market contexts. They take the existence of markets as a given and focus on access. I provide a different, but related, approach, which, while also looking at realities at the local level, emphasizes supply and demand conditions influencing market depth; in other words, I look at the market itself. The theoretical approach that I use, besides offering guidance for microfinance policy, also has testable implications and could spur empirical research on a new set of issues.
Mosley and Hulme (1998) studied thirteen microfinance institutions (MFIs) in seven developing countries and found that the impact of lending on the recipient household’s income tended to increase, though at a decreasing rate, as the recipient’s income and asset position improved. Their work found that the poorest microloan recipients were least likely to be benefited. They explained their results partly as a tendency for poorer clients to use their loans for consumption purposes. Judith Shaw (Shaw 2004) looked at the microenterprise earnings of microfinance clients in Sri Lanka and found that “poorer clients face geographic, financial and sociocultural barriers to entry to the most promising microenterprise occupations, leading them to select low-value activities with poor growth prospects” Quoting from other studies conducted by the Asian Development Bank, and others, she notes that more successful entrepreneurial businesses tend to “be more highly capitalized, employ more labor and use more sophisticated technologies. They tend to operate continuously rather than intermittently, reinvest rather than consume surpluses, and have lower closure rates”. Epstein and Yuthas (2010), in their interesting study of cultures of non-payment, characterize businesses in their study as “survival” enterprises, in contrast to the more successful “entrepreneurial” enterprises described in the above quote from Judith Shaw. Survival enterprises, they note, operate in sectors with low skill requirements and low barriers to entry, and their products are typically undifferentiated. In contrast, entrepreneurial microenterprises are larger, more stable and more highly-capitalized; their owners tend to be more ambitious and possess higher levels of business and technical skill (Cotter 1996; Ghate et al. 1996). What we see here is a pattern linking the poorest of the poor and the nature of the unprofitable “survival” businesses they invest in with microcredit. What are the factors that underlie this pattern?
In order to answer this question, I look at the role of markets and market structure in whether microfinance intervention for microenterprises results in economic development and poverty alleviation. In accordance with this objective, in my theoretical analysis, I will only consider loans provided for income generation and not for income smoothing.1 While Shaw (2004) provided a descriptive analysis of the social and systemic factors that reduce the value of credit interventions for poor people, I will look at the steps that MFIs, as well as governmental agencies can actively take to improve their impact on poverty alleviation. Using concepts developed in the study of value chains and an emphasis on end-markets, I will develop criteria that MFIs can use in making their loans, as well as in maximizing the efficiency of their loans from a developmental perspective.
My main finding is that, when introducing an extensive program of microcredit in undeveloped and relatively isolated rural areas, such as in many parts of sub-Saharan Africa, it is important to look at how the market structure mediates the impact of the provision of loans on the demand and supply for the end-product or service; failure to do this can result in adverse effects from the operation of the microenterprises that such microloans finance. Although my conceptual analysis is applicable to all geographical areas, I believe that it has particular application to Africa. According to the World Bank, of all the continents, Africa has the lowest per capital GDP. A listing of countries ranked by 2015 GDP per capita had the bottom twelve (of 217) rungs occupied by sub-Saharan African countries. Thirty-six of the bottom fifty ranks were occupied by sub-Saharan countries. The poverty gap at US$1.90/day (2011 PPP) for 2013 for developing countries in the different continents in the world showed sub-Saharan Africa clocking in at 16%, with the next continent, South Asia, at 2.7%. The number of bank branches per 100,000 adults was four for sub-Saharan Africa, with the next highest number being more than twice as much (for East Asia and Pacific) at 9.8. Finally, the percent of the rural population with access to electricity in 2014 was 18% in sub-Saharan Africa, with the next lowest being South Asia, where almost 72% of this segment had access to electricity.2
For this reason, my literature review and some of my empirical analysis will focus on Africa. I will look at two kinds of empirical data. I provide suggestive results from a non-random sample of MFI loans in the Nairobi area of Kenya; I look primarily at where these loans are given, to whom, and for what business purposes. As noted by Kiiru and Mburu (2006), “microfinance cannot improve welfare unless there is effective demand for goods and services, which ensures that the products of micro-entrepreneurs are consumed”. This data is, of course, very area-specific and has no guarantee of being representative. To balance this, I use another set of data from the MixMarket database. While this sample is less problematic in terms of selection bias, the inferences are more indirect since information regarding loan use is not available.
The next section will present a focused review of the literature with special emphasis on African microfinance to provide a background to, and to better situate the following theoretical discussion. Section 3 discusses these questions theoretically. Section 4 presents my data and analysis, while Section 5 presents tentative conclusions and plans for future work.
2. African Microfinance
In this section, I look at studies that examine microfinance in sub-Saharan Africa to see what can be inferred from them regarding the role of market structure in how successful MFIs have been in financing sustainable and profitable microenterprises, particularly amongst very poor clients. There is very little direct evidence on this; however, some of the results reported by MFI impact studies are suggestive in terms of how market structure may have influenced their findings. As mentioned above, a finding of no impact or negative impact implies that microfinance has not been successful in creating profitable businesses. Even if the impact on client welfare is positive, the question arises as to the economic status of the clients that have been helped by microfinance. Studies that find a negative correlation between MFI sustainability and outreach suggest that impact on client welfare, if any, has been achieved only by ignoring the very poor. In my examination of the evidence, I look for clues that the failure of microfinance is tied to lending practices in rural or underdeveloped areas, where there are significant transportation costs in product/service markets and where concomitantly income levels are low. The presence of such transportation costs implies small effective market sizes such that interventions of any reasonable size would have serious effects on the price of the product leading to undesired outcomes for MFI clients.
A recent paper (Van Rooyen et al. 2012) reviews the evidence from high-quality studies regarding the impact of microfinance in sub-Saharan Africa. Most of the studies they look at focused on rural areas; as such, their findings are particularly relevant for us, since survival enterprises are more likely to be found in such environments. They found evidence suggesting that microcredit may not be operating as its proponents would have expected and desired. Their synthesis of the evidence is that “microfinance in sub-Saharan Africa—while it has modest but not uniform positive impacts—is not always a golden bullet, but indeed can cause harm”.
For example, a study in Uganda found that client households were significantly more likely to be unable to pay school charges, causing children to drop out of school (Barnes et al. 2001a). Several other researchers (e.g., Adjei et al. (2009) in Ghana and Barnes et al. (2001b) in Zimbabwe) found that the longer individuals remained in microfinance programs, the less successful their businesses became and the greater the negative impact on health and education. One study that directly explored the impact of microcredit on household income found that clients’ household incomes were greater than those of non-clients in two districts, but lower in two other districts (Nanor 2008). Overall, Van Rooyen et al. (2012) note: “if you consider only the highest quality evidence, you would conclude that these [micro-credit] interventions reduce the incomes of the poor and reduce their accumulation of assets”.
Of all the studies that Van Rooyen et al. (2012) report on, Michael Nanor’s (Nanor 2008) study of micro-credit in Eastern Ghana is particularly interesting because he reports on the cross-sectional variation in its impact, as noted above. Unfortunately, he does not systematically relate this to district characteristics. Of the four districts that Nanor examines, Yilo Krobo was unique in the negative impact of microcredit on business profits and household income of microcredit clients. While district-level comparative studies are hard to come by, the 2010 Population and Housing Census (2014) reports that Yilo Krobo had the highest crude death rate in Eastern Ghana, which might indicate the relative poverty of the district relative to the other four. However, since not much more in the way of comparative statistics is available, this is hardly conclusive in terms of when micro-credit has a positive impact on clients and when a negative impact. At best, we could say that Nanor’s study supports the idea that the very poor are not likely to be benefited by micro-credit. A more general result that he reports is that, across the board, “the number of months a client stayed in a credit scheme negatively affected their profit”.
Ouma and Rambo (2013) report on the kinds of businesses for which micro-credit is provided. This is of particular interest to us because, as I explain later, microfinance loans tend to be concentrated in business sectors where the cost of entry is low. Using stratified random and purposive sampling procedures, they collected data from 190 women SME owners who had received microcredit from an MFI (Kenya Women Finance Trust—KWFT) and stayed in business for at least three years. They find that 73.1% of the businesses that were financed by KWFT microloans were clothing related (clothing boutiques, tailoring, hairdressing), 8.9% sold food and 13.7% were listed as retailing outlets. Two-thirds of the loans were for less than 69,000 Ksh (around US$690), and only 8.9% consisted of more than 100,000 KSh (US$ 1000).3 Even these small sums were reported to be insufficient by the recipients, though few of them sought additional financing from elsewhere. One interpretation, consistent with their findings, is that the businesses in their sample (both in terms of what sector they belong to, and the amount of financing) were most probably in sectors with easy access and, hence, a great deal of competition. There were only eight enterprises (out of 190) that may have been more resource-intensive and more difficult to replicate.4 Furthermore, this sample was collected in an urban environment, namely Kisumu, the third largest city in Kenya; this suggests that loans made in more rural areas are even more likely to hew to a pattern of businesses in industries with easy access.
Abdulai and Tewari (2017) analyze the determinants of sustainability using data from 71 MFIs across 10 countries in sub-Saharan Africa. They find little relationship between sustainability (measured as operational self-sufficiency) and breadth/depth of outreach. However, they did find a negative relationship between ROA and depth of outreach. Makame and Murinde (2006) analyze the MFIs from East Africa and find strong evidence of a trade-off between sustainability and outreach. Kipesha and Zhang (2013) also study East Africa and find that outreach to the poor is negatively related to profitability, but outreach overall is positively related to profitability. Annim (2012) also found a trade-off between sustainability and outreach; interestingly, he also finds that MFIs financed by owners’ equity, commercial lending or deposits tend to target the non-poor, while those using government-subsidized credit and donor grants or subsidized credit are more willing to target poorer clients.
This brief review of the evidence suggests that MFI impact may be restricted to the less poor; and limited or negative MFI impact may be correlated with areas of operation that are rural or underdeveloped and with business sectors that are very competitive and easy to enter. However, the evidence is only suggestive because none of these studies looks directly at the relationship between market structure and MFI impact or enterprise profitability. In the next section, I introduce a theoretical framework to consider the question of how market structure mediates the impact of MFI credit interventions on clients’ businesses.
3. Theoretical Analysis
3.1. Value Chains
Michael Porter (Porter 1985), in his book Competitive Advantage, introduced the concept of the value chain; there, he defined it as “a set of activities that an organization carries out to create value for its customers”. The point of looking at a value chain, for Porter, was to allow companies to look at all their activities in order to see how they are connected and whether or not a given activity adds value. USAID has extended Porter’s notion of a value chain within a firm to a value chain that looks at the relationship between firms. The USAID (2015) website explains the importance and the use of this notion of the value chain, as follows:
USAID/E35 applies the value chain approach to drive economic growth with poverty reduction through the integration of large numbers of micro- and small enterprises (MSEs) into increasingly competitive value chains. By influencing the structures, systems and relationships that define the value chain, USAID helps MSEs to improve (or upgrade) their products and processes, and thereby contribute to and benefit from the chain’s competitiveness. Through this approach USAID enables MSEs—including small-scale farmers—to create wealth and escape poverty.
I extend this notion further to consider the relationship between the functioning of a single firm and a market comprising of many firms. Though my approach is similar to the USAID approach in that I also consider multiple firms, there are some differences between my approach and that of USAID. USAID’s focus is on the individual firm, while my focus is more on the industry, while recognizing that the industry is comprised of many firms. The USAID approach looks at a given firm and asks how that firm can use the value chain concept to create wealth; in contrast, I recognize that when MFIs provide loans to several units in an industry, what we have is an intervention which will have a macro impact on the industry and, thus, end up affecting each of the loan-receiving units in ways that would be different were the MFI to only target a single firm in the industry; given this, the MFI has the ability and the obligation to ask where such an intervention will have greatest impact.6 The similarity between my approach and the USAID approach is that both approaches consider the impact on the end market. Even if the USAID approach is not exactly the same as mine, it is still a useful stepping stone in that it brings us to consider the interrelatedness of firms in an industry. Let us see how these ideas can be applied to microfinance.
What happens when an individual at the bottom of the pyramid gets a microloan to start or run a business? First of all, we have to ask what kinds of businesses such a person will engage in. Most likely, such a borrower will not have much education or other kinds of human capital. If we are talking about women, the probability is even higher that the level of human capital will be low (Duflo 2005). As a result, the only kind of business that this person can engage in is one where entry is easy and where there are few barriers. Even though access to financial resources does constitute a barrier for MFI clients, they themselves may end up competing with businesses that do not have a financial resources barrier, since there are probably other people with better access to resources; after all, MFIs target people who, because of their special circumstances (i.e., asset poverty), have not been able to obtain loans. Even if this is not so, since other microfinance loan recipients are similar to him/her, chances are s/he will be competing with these other microfinance recipients. If there is competition among MFIs, this is even more likely. The point is that returns in such business activities are likely to be low.
How, then, can we create conditions for the microloan recipient to have higher returns in his/her business? The end-use focus of the value chain approach is helpful in this regard. Value is created through production and through exchange. Value created through exchange occurs when valuations for a given item vary across the population. The potential for such value creation is going to be greater, the greater the variation in individual valuations. However, variations in valuations are not going to be large if the individuals in the population are similar or if the population is small. Hence, retail activities where the end users are local are unlikely to generate much value surplus. On the other hand, when the end users are foreign or in other possibly urban markets, value creation through exchange is likely to be higher. Value creation through production is much more promising in terms of potential; furthermore, since it requires the use of different factors of production, generation of employment opportunities is also greater. However, such activities generally require possession of, or ancillary acquisition of, human capital as pre-requisites for engaging in them.7
3.2. Market Equilibrium Analysis: Local and External Markets
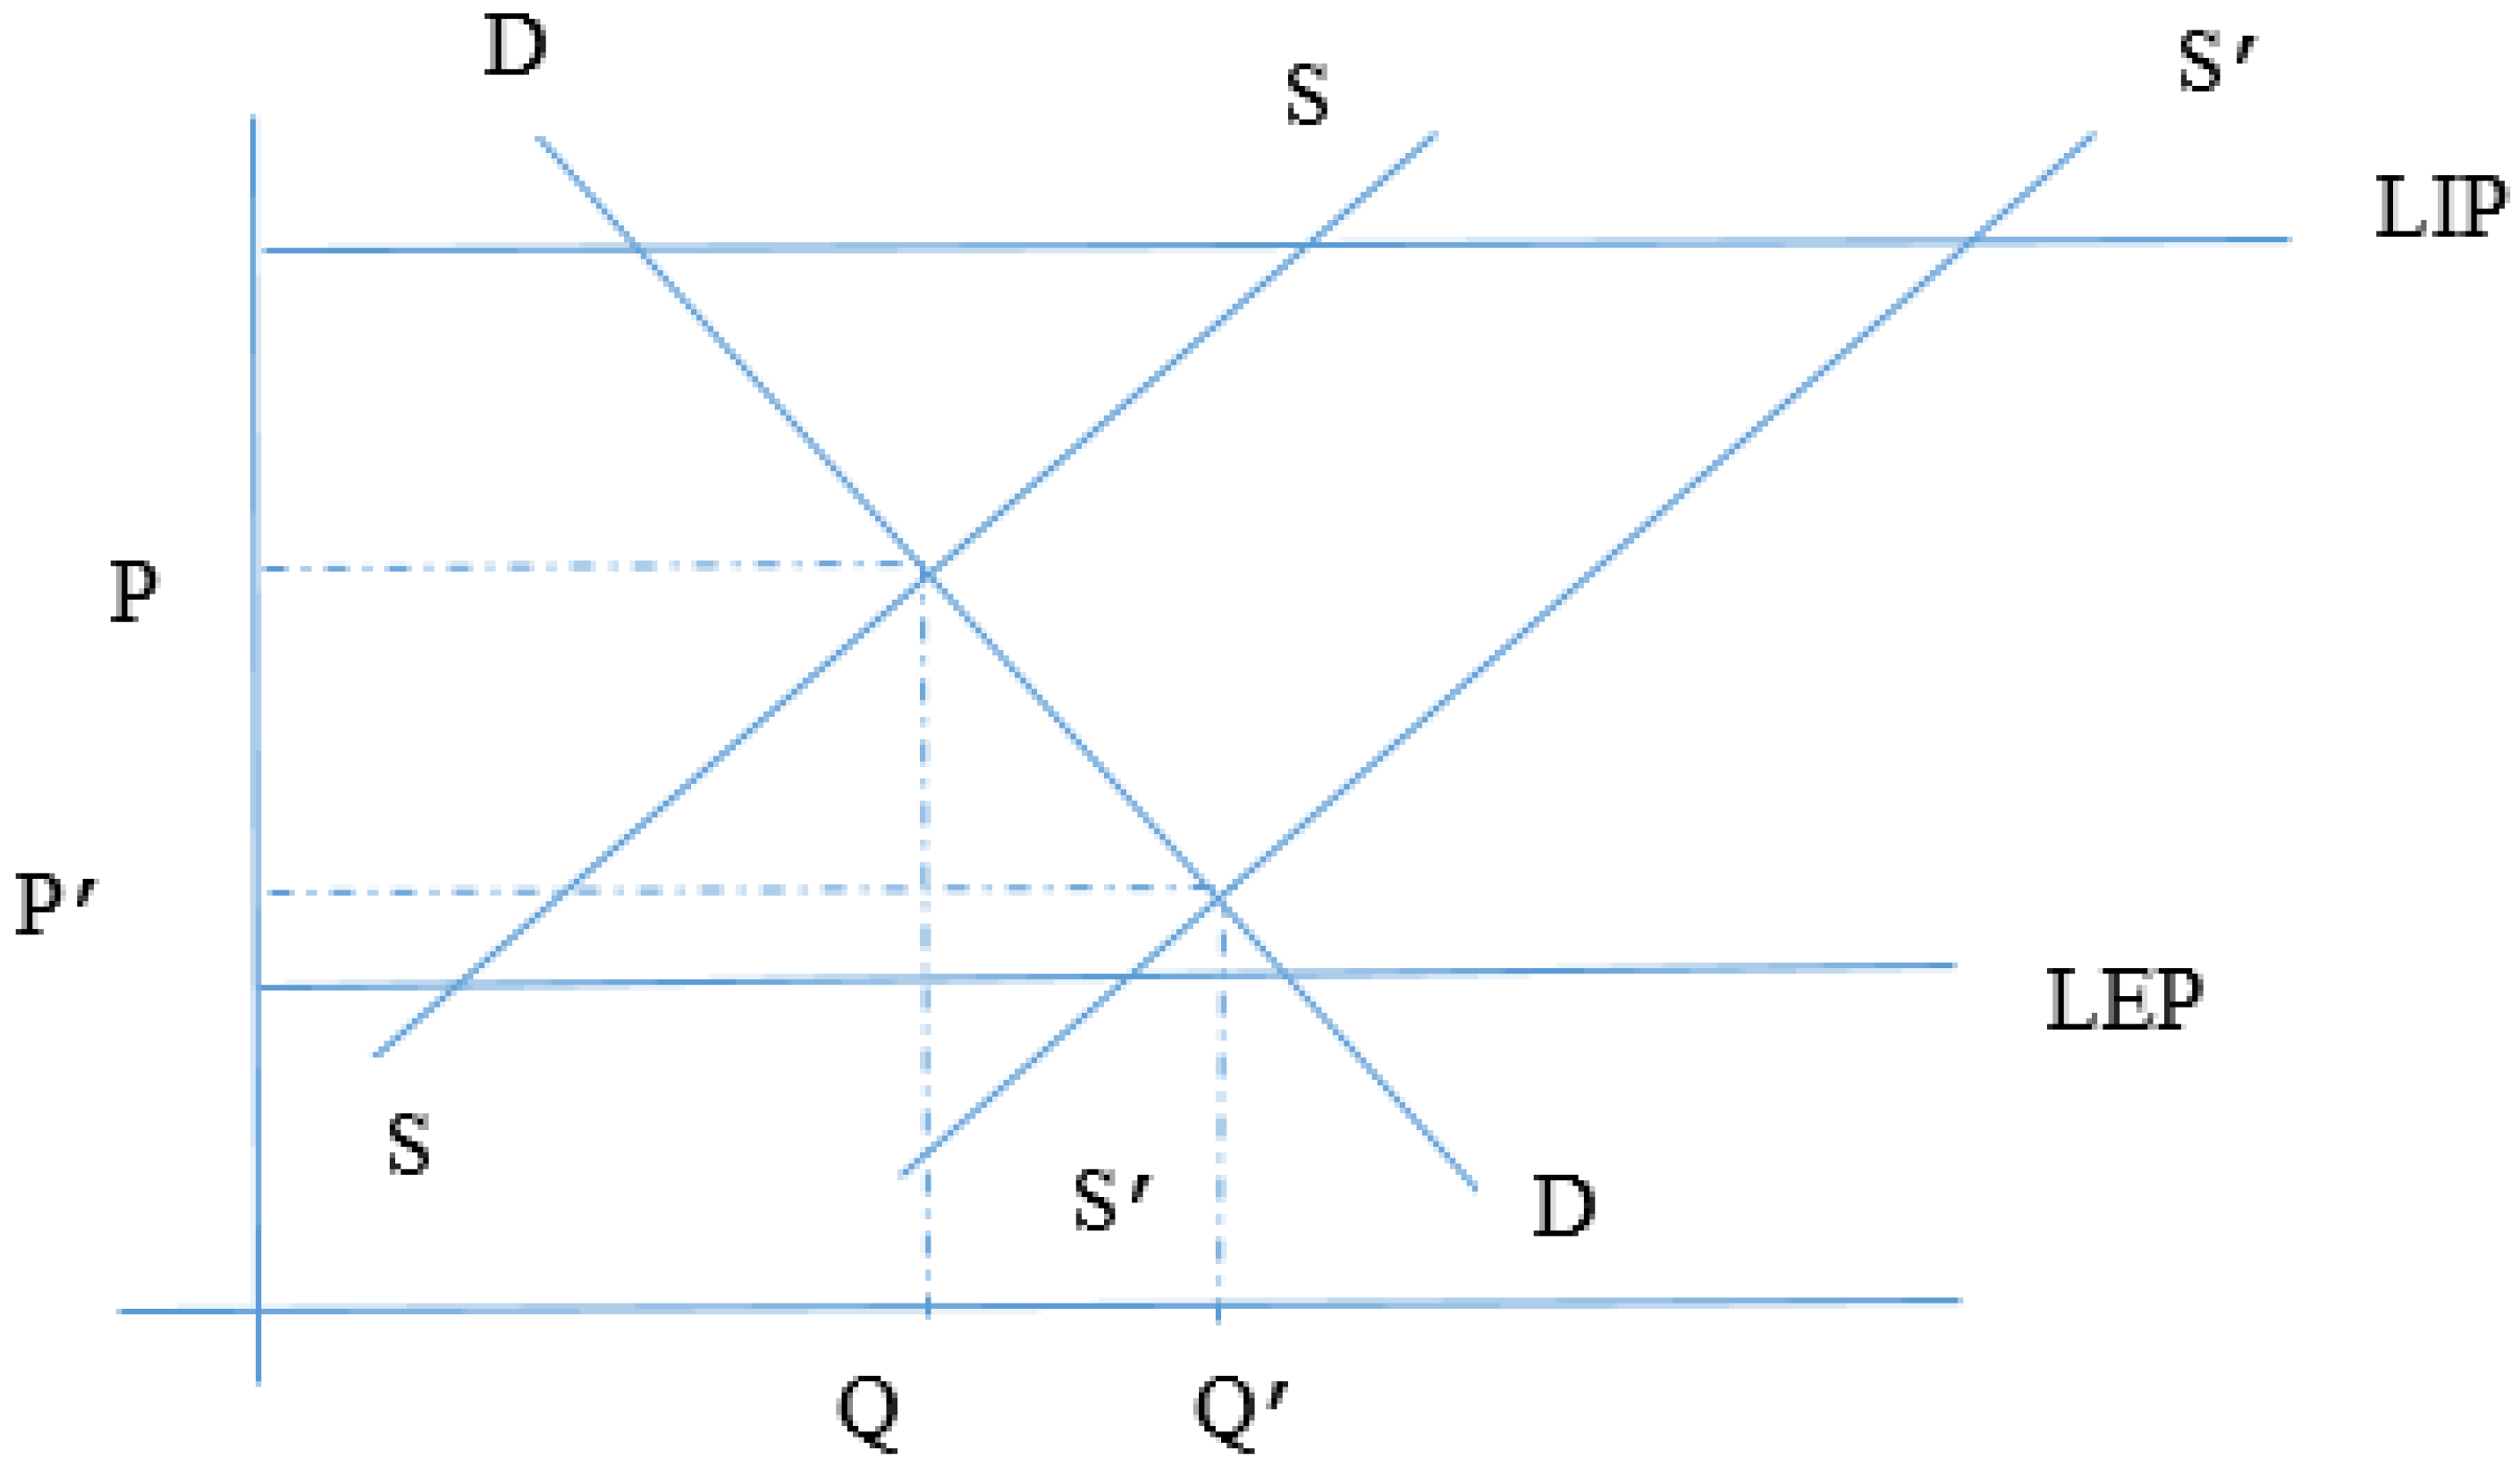
Some aspects of these ideas are developed in Julie Schaffner’s book on development economics (Schaffner 2014).8 Following her model, let us introduce a local market and an external reference market. For example, the local market might be a village in Makueni (a county adjoining Nairobi) and the external reference market might be the national Kenyan market or the large city market in Nairobi. The local market has a local demand curve and a local supply curve and an external supply curve and an external demand curve (representing demand and supply from outside the local area). The external market is assumed to be sufficiently large that its price will not be affected by demand by the local market or supply from the local market. Let LIP (local import price) be the price at which it will be profitable to import from the external market and sell in the local market. Thus, if the external market price is Pe, then LIP, the local import price, is Pe plus the transfer costs, i.e., the costs of transporting from the external market to the local market.9 Similarly, LEP, the local export price, is Pe less the cost of transporting from the local market to the external market. If the intersection of the local demand and supply curves is below the LEP, then it will be optimal for local producers to export to the external market. Similarly, if the intersection of the local supply and demand curves is above the LIP, then it will be optimal to import from the external reference market. If the local market exports to the external market, then the local price will be the LEP; if it imports from the external market, then the local price will be LIP. If there is neither exporting to the external market or importing from the external market, then we have a condition of autarky in the local market.
Thus, in Figure 1 below, if DD and SS are the local demand and supply curves, the local price will be P and there will be no importing or exporting. In this context, an external microfinance intervention will cause the supply curve to move to the right to S’S’. Producers believing that their increased production will have only a small impact on the total supply and, hence, on the equilibrium price, will borrow more.10 However, the combined action of many producers acting in this fashion will cause the price to drop from P to P’ and the quantity supplied and demanded to increase correspondingly. However, because the range LIP-LEP is so large, the local market continues to be in autarky. The unexpected increase in total supply and the drop in the equilibrium price thus ends up putting pressure on all producers, leading to some of them defaulting on their loans.11 Alternatively, because of social pressure not to default, they may succeed in repaying the MFI loans by working at very low wages or pressing family members to work at excessively low wages or by using their existing physical or social capital to repay the MFI (Bateman 2010). Under these circumstances, there can be a welfare loss, even without defaults. In any case, since the price level is artificially depressed to P’, all producers—both the existing and the microloan-financed producers—are squeezed. The one segment that is benefited is consumers since the local price drops to a very low level.
3.3. The Role of Transfer Costs
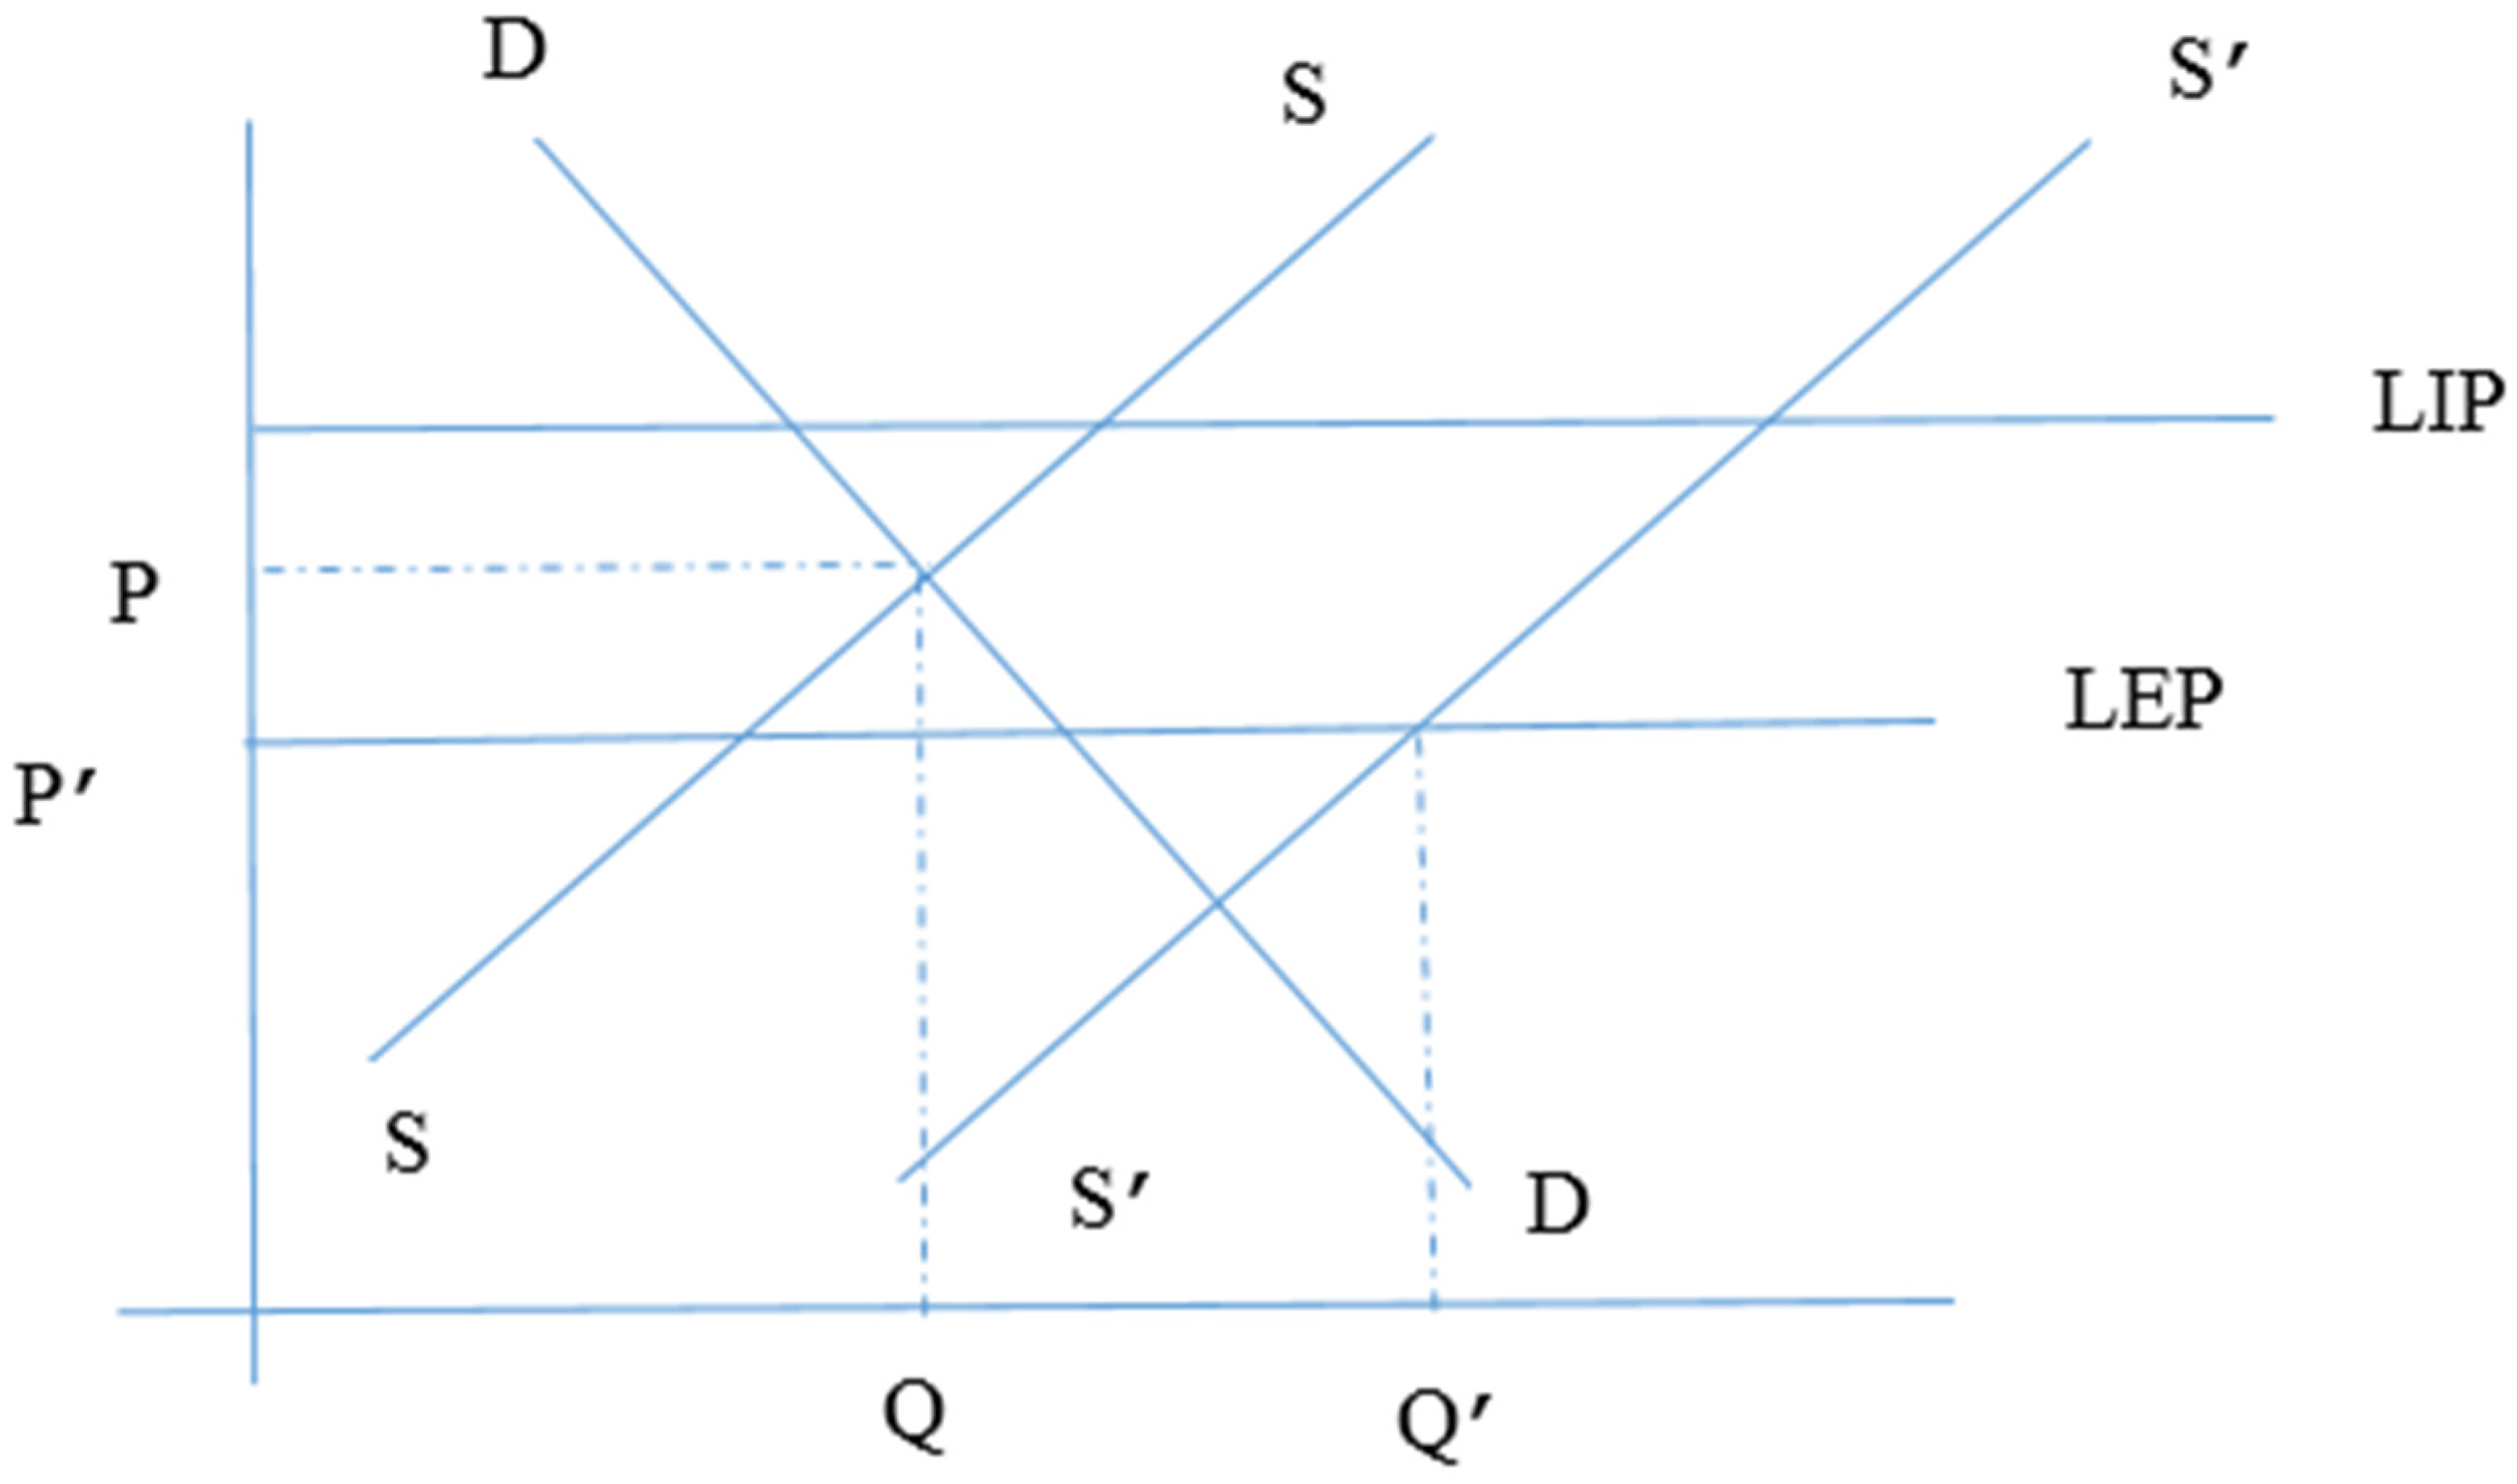
Suppose the LIP-LEP range is much smaller, but the pre-intervention disposition of the local supply and demand curves still leaves the local economy in a condition of autarky, as in Figure 2. Now though, if there is a microfinance intervention that moves the supply curve to the right to S’S’, the price will only drop to the LEP, as discussed before, and the quantity supplied will be much larger than before. Then even if the local entrepreneurs mistakenly accept MFI loans, there will be a much expanded market for their products because of the exports to the external market. This expanded level of production is likely to reduce their per-unit cost of production and reduce the likelihood that the MFI loans will be value-reducing for the new producers. Even if the borrowers do not appreciate the impact of multiple MFI loans on the equilibrium price, there will be a much greater benefit to the local economy from the MFI intervention in the second case where the local economy moves from a situation of autarky to one of exporting compared to the first case, where it remains in autarky. The benefits will be even greater if there is unused local capacity and the resulting expansion leads to increased local labor employment. Consequently, MFIs should consider lending to entrepreneurs in local industries that find themselves in a situation such as Figure 2, rather than Figure 1. Alternatively, MFIs should help by financing investments that reduce transportation and other costs, so that the local export price level, LEP, is higher (as discussed in the next section). Of course, these beneficial outcomes could be obtained through similar action by local governments or other agencies, as well.
Some evidence for this comes from (Shukla 2010), who reports that even with the high growth rate in India, it is the largest cities have experienced the greatest economic gains; small towns have also gained, but not as much. Furthermore, beyond towns, real gains were experienced only in villages located within five kilometers of towns. Outside this inner circle of villages, inflation adjusted per capita incomes have fallen, with the lowest income quintiles experiencing the deepest cuts (Krishna and Bajpai 2011).
3.4. Choosing Sectors for MFI Loans
Assuming that MFIs want to target Figure 2 sorts of situations (low transfer costs), how can MFIs identify such situations in preference to situations similar to Figure 1 (high transfer costs)? What are the characteristics that MFIs should be looking for? Should they look at service industries or production industries? The answer is that markets for services are likely to involve high transfer costs, since it is not possible to transport services (or if it can be done, it will be costly). Consequently, MFIs should not, according to this logic, finance service providers, ceteris paribus: the focus should be on production industries. However, what sorts of production industries?
My analysis suggests that we should consider ease of entry to the industry. If entry costs are low, then supply elasticity will be high. Under these circumstances, an MFI intervention will cause the supply curve to shift out, as explained before. If the supply curve is elastic, the price drop will be greater. If the LIP-LEP range is high and the local economy is in autarky, it is likely to remain in autarky even when the supply curve drops, as explained above. In a situation of easy entry, then, local producers are fully affected. The market for services is likely to be of this nature, i.e., elastic supply and a higher LIP-LEP range. Retail services, such as the neighborhood mom-and-pop stores or barber shops are of this kind. Occupations, such as the collection of forest products from public lands, are likely to fall in this category, as well.12 On the other hand, an industry requiring acquisition of some sort of machinery to produce its goods is less likely to have high supply elasticity: for example, the production of shoes where leather is easily available locally or weaving industries that can use looms and produce local designs or other artistic goods. Entrepreneurs in such industries may be worth financing through MFI loans.
MFI loans to entrepreneurs who seek to reduce the costs of connecting the local market to the external reference market would also be desirable because they would indirectly help all local producers by moving the local economy from autarky to an exporting economy. Thus, investments in refrigerated equipment for fresh vegetables or helping local manufacturers to comply with exacting contractual agreements with supermarket buyers or international exporters can add value and benefit the local economy (Minten et al. 2006). Finally, when the external market price is very high and the market is in exporting mode, increasing local supply is valuable because the price is not affected and the entire effect manifests itself in higher quantity. Similarly, when the difference between LIP and LEP is reduced by means of MFI loans resulting in reduced transportation/transfer costs, the effect is very beneficial. This is precisely the situation when the local economy has a comparative advantage in the production of a good, which has a high demand in an external market and where transportation costs are low. This would be the case, potentially, for local artisanal goods.
3.5. Value Chain Relationships
It must be noted, however, that producers of local goods—such as local textile manufacturers—often manufacture on a low scale and are not knowledgeable about proper marketing practices. Under these circumstances, marketing and producer cooperatives can be valuable. Thus, MFIs should consider helping local manufacturers create and operate such cooperatives simultaneously with the granting of microloans. In order to identify what interventions are likely to work, it is important to have a good understanding of the local markets, since the operation of markets varies from location to location (Fafchamps 2003).
The Value Chain approach (USAID 2015) notes that the quality of relationships between different stakeholders is a key factor affecting the functioning of a value chain.
Strong, mutually beneficial relationships between firms facilitate the transfer of information, skills and services—all of which are essential to upgrading. Value chain opportunities and constraints generally require a coordinated response by multiple firms in the chain—which necessitates trust and a willingness to collaborate. The value chain approach, therefore, emphasizes a dynamic that has long been recognized: Social capital (networks of relationships and social institutions) are critical to business and competitiveness.
This refers to local producers coming together to share information to increase the efficiency of production and to market their products jointly through producer cooperatives in such a way as to maximize their market power. Where there are several links of the value chain that are located locally, they need to cooperate so as to reduce opportunism and increase investments necessary at each level of the chain in order to extract maximum surplus from the external market. Thus, local farmers may need to cooperate with the suppliers of inputs, such as fertilizers, and also with wholesalers and intermediaries who would transport the finished goods to the external market. The external market need not be global. Again, to quote the USAID document, “local, national and regional end markets are often more accessible and less demanding than global markets. Practitioners have noted that building capacity to meet the requirements of these markets can lead to the upgrading necessary to enter more sophisticated global markets”.
While I have argued that certain industries/sectors are better from the viewpoint of benefiting the entire local economy and maximizing employment, some of these benefits will only occur slowly as a trickle-down. How do we help poor and unskilled inhabitants of these local economies—both urban and rural—in the interim? From this point of view, it might be unavoidable that the MFI provide loans to micro-entrepreneurs in service industries or in petty retail and manufacturing activities. The key, here, would be to ensure that there is continuous monitoring of these micro-entrepreneurs to ensure that they are given opportunities to move up the value chain. Thus, instead of constantly adding to the number of producers in these low-skill, easy-entry industries, the MFI should try to enable borrowers to acquire higher-level skills and move up the value chain. However, not all entrepreneurs are equal in this respect; hence the MFI may need to evaluate borrowers to determine who is a better candidate to move up the value chain. For this purpose, MFIs might want to ascertain the purpose for which loans are advanced and the portfolio of businesses in which the borrower is involved. They may also want to determine the market for goods, and the support and other infrastructural logistics related to the micro-entrepreneur’s business. To conclude, my theoretical analysis suggests, ceteris paribus, that MFIs might want to direct credit to micro-entrepreneurs in sectors with low transfer costs or to transfer-cost reducing activities and to promote the development of mutually beneficial relationships between different links in the local value chain. NGOs/MFIs may also want to consider first (or simultaneously) providing borrowers with some basic management skills.
Examples of such loans that MFIs can make would be for warehouses; transportation, such as trucks, to move produce and other goods to larger markets; and refrigeration equipment to keep produce and other perishables fresh while they are being transported to more distant and liquid market environments. Local and national governments will be needed to create other infrastructure that has public good elements, such as roads. The value of such infrastructure, from the viewpoint of their effect on the sustainability of local enterprises is clear from the following quote (Fitzgibbon and Venton 2014), which refers to the construction of a road between Moyale on the northern border of Marsabit county, adjacent to the Ethiopian border, and Marsabit town, and from Marsabit town to Merille at the southern border of Marsabit county:
In particular, it is an opportunity to significantly expand livestock exports from the county into both Ethiopia and the rest of Kenya. Merille, previously a tiny settlement on the southern boundary, is proof of the value of roads to the livestock market… (T)he market now operates weekly, rather than fortnightly, and attracts between 60–90 buyers, many from out of the county. Moyale livestock market is similarly buoyant, attracting traders coming from Ethiopia to buy livestock. This expanded demand works to dramatically increase prices: currently average goat prices are 40 per cent higher in Marsabit than Turkana and bull prices are almost double It seems that bigger markets with more buyers actually increase livestock prices and hence income to local producers. As the backbone of the county’s economy, the road will dramatically improve pastoralists’ ability to realize the value of their animals.
3.6. Summary
What the foregoing suggests is that, in inhospitable business environments, microfinance interventions are likely to generate more wealth for their clients only in certain sectors/industries, but not in others. Furthermore, if the MFI does not direct loans to the right kinds of business purposes, their efforts are likely to be counterproductive. Finally, even though this entire section has been written primarily in terms of recommendations to MFIs, it is equally applicable to actions or policy decisions taken by local or national governments. In fact, it may be argued that individual MFIs may not be able to undertake some of these actions on their own, because if a single MFI withholds loans from certain sectors or provides education or skill acquisition or other capital equipment loans that may only pay off in the medium term, other MFIs might poach on them or might decide to go ahead and make those very loans since the profitability of initial loans may not be affected—even though later loans might. In other words, there may be a Prisoner’s Dilemma aspect to the situation, the solution to which may require action by a governmental entity.
In the next section, I look at two kinds of empirical evidence that I believe will allow us to investigate the validity of these conclusions. I first look at data from the MixMarket database. Since this database does not provide specific data at the level of the loans, I am restricted to testing my hypotheses at the level of the MFI, which is the unit of reporting in this database. Furthermore, since I believe that MFIs, by and large, have not been careful in tailoring their interventions to the nature of the market environment in which they operate, MFIs operating in the sorts of inhospitable environments described above are likely to have clients with failing businesses. I will use the MixMarket to test this hypothesis by the use of various kinds of proxies to be described below.
The second kind of empirical evidence is from some surveys that I undertook in the environs of Nairobi, Kenya, supplemented by additional data provided by Kiva. Although this is not a random sample, it is useful to consider it to get a feel for the kinds of purposes for which MFI enterprise loans are given in East Africa.
4. Empirical Evidence
4.1. The MixMarket Data
In this section, I look at results using data from the MixMarket dataset. I downloaded data from 2005 to 2016 for all MFIs that were on record for this period.13 Although these data are less problematic in terms of selection bias, nevertheless, the lack of information on the purpose for which the MFI loans were made makes it more difficult to relate market structure and loan characteristics. My basic hypothesis in this section is that loans made in inhospitable market environments with low entry costs are likely to result in less profitable client enterprises. Since data on client business profitability is not available on MixMarket, I am forced to use indirect measures of the quality of MFI loans as proxies for client business (un)profitability; for this purpose, I use portfolio at risk ratios (greater than 30 days: PAR30)14 and loan loss rates, defined as the total amount of loans written off, net of recoveries, compared to the average gross loan portfolio. I use these measures rather than MFI profitability measures such as ROA on the assumption that client business unprofitability and inability to repay are more likely to affect the left end of the return distribution for MFIs. I believe, however, that the PAR30 ratio is a better measure than the loan loss rate measure because, while portfolio at risk is, more-or-less, an automatic designation (as long as the MFI is conscientiously following the accounting rules) depending on the quality of the loan, the loan loss rate reflects an additional accounting decision that the MFI has to make as to when and whether to write off the loan.15 Furthermore, the loan loss rate is adjusted for recoveries, which means that problematic loans made to unprofitable businesses, but which do get paid after some time are not included in this measure, even though such loans reflect struggling businesses.
I use several category variables as proxies for inhospitable market environments. I assume that certain kinds of MFIs are more likely to operate in inhospitable environments and in rural areas, where the very poor are more likely to live; this allows us to use MFI characteristics as proxies for the market environment. Since the unit of the MixMarket database is the MFI organization and not the MFI client, such an approach is unavoidable when using this database; at the same time, the assumptions that I make in this regard, I believe, are not unreasonable. First, I use an indicator variable for the profit/non-profit status of the MFI. I assume that for-profit MFIs are less likely to operate among the very poor since loan sizes are small, the operating costs per loan are high and, consequently, rates of return are likely to be low. The second proxy is the region of operation of the MFI. The MixMarket database classifies MFIs as belonging to six different regions—East Asia and the Pacific; Africa; Eastern Europe, and Central Asia; Middle East and North Africa; Latin America; South Asia; and the Caribbean. Based on per capita income statistics, average urbanization rates and other evidence discussed above, I assume that MFIs in Africa are more likely to operate in inhospitable market environments and to cater to the very poor.16 The third proxy is the legal status of the MFI. MixMarket distinguishes between five different kinds of MFIs in terms of legal status: banks; credit union/cooperatives; Non-banking financial institutions (NBFIs); NGOs; and rural banks. I assume that rural banks, by virtue of operating solely in rural environments are most likely to operate in inhospitable market environments, whereas other MFI types, while also operating in rural areas, are not restricted to such locales.17
I use other continuous variables to measure the extent to which the loans are being made in inhospitable environments. One, the percentage of loans that are made according to various kinds of lending methodologies. The MixMarket Database identifies three different methodologies, which are described in Cull et al. (2009) as follows: “Individual lending refers to traditional lending relationships between the bank and individual customers. Solidarity group lending refers to the group contracts that were made famous by Grameen Bank, and the ‘village bank’ approach captures a participatory lending method also based around group responsibility for loan repayments.” They go on to show that lending approaches correlate with broader social missions, with village banks aiming to reach the most costly-to-reach and the poorest customers. Two, I look at the percentage of the gross loan portfolio represented by loans made in rural areas versus urban areas; I believe that rural loans are more likely to be made in inhospitable environments. Three, I use the percentage of enterprise loans made to business of different size categories—microenterprises, small and medium enterprises and large corporations. Loans made to microenterprises are more likely to be made in inhospitable environments. Finally, I believe that smaller loan sizes (unadjusted as well as adjusted for GNP per capita)18 are more likely to have been made in inhospitable environments19 and that MFIs operating in such environments are likely to be, overall, less profitable. Table 1 provides a list of my variables.
4.2. Evidence from the MixMarket Data Analysis for MFIs from All Regions
My basic hypothesis is that client enterprise unprofitability proxied by my MFI profitability variables is related to my measures of inhospitable business environments. To establish this, I first look at how different loan loss rates (llossrat) and PAR30 ratios (PAR30) are for MFIs of differing profit status (Table 2), legal status (Table 3) and from different regions (Table 4). We do not see much difference between the means for PAR30 between for-profit and non-profit MFIs, whereas loan loss rates are statistically significantly greater for for-profits than for non-profits, which is contrary to my hypothesis. Next, looking at variation across legal status, we see that legal status does not make a statistically significant difference for the loan loss rate variable, whereas it does for the PAR30 variable. The PAR30 ratio is more than 11% for rural banks, which is much more than for MFIs with other legal statuses. Finally, both PAR30 and loan loss rates differ by region with Africa having the highest ratios, as hypothesized. In summary, there is some support for my null hypothesis, particularly when I compare MFIs in Africa with MFIs elsewhere.
Next, I ran a series of unbalanced panel regressions (with random effects) of my unprofitability measures on three sets of explanatory variables, viz. the categorical variables of profit status, region of operation and legal status as explanatory variables.20 This data is available for most of the MFI-financial year observations in the dataset; in contrast, there is only limited data on my continuous variables, such as the percent of gross loan portfolio accounted for by loans or lending methodology, while ROA, Loan size and relative loan size occupy an intermediate position.21 I now discuss the results of the regressions with my initial set of explanatory variables. I reach qualitatively similar results from the regressions including the other variables; these results, as well as results for the African subsample alone, are included in an Appendix to this paper. We see, immediately, that the results provide some support for my hypothesis, conditional on the quality of my proxies. For the PAR30 regression (Table 5), PAR30 for non-profits is not significantly different than for non-profits. We do see that loans made by MFIs that are rural banks tend to have a statistically significantly greater PAR30 rate compared to the other categories, except for banks. Finally, loans made in Africa (regionind = 1) have a statistically significantly higher PAR30 percentage than loans made elsewhere. The results are similar for the loan loss rate in that loss rates are much higher for Africa than for other regions. However, the legal status of the MFI does not make a statistically significant difference as far as the loan loss rate goes, and neither does the profit status.22
Keeping in mind the assumptions made and the proxies used, the overall thrust of the evidence (at least for the PAR30 ratios) supports the hypothesis that MFIs operating in inhospitable business environments tend to have clients who have difficulties in attaining profitability. This supports my contention that MFIs lending to the very poor, which often means lending to survival enterprises, have not been doing a good job in supporting and nurturing profitable client businesses, and that they need to change their lending model to take the market structure into account.
As mentioned earlier, it would be much better to use client-based information to test my hypotheses, information which, unfortunately, is not available, in general. In the next section, I present the results of some MFI-client interviews that I conducted and other client-level data that I obtained. This allows me to better examine whether MFI loans made to the very poor tend to be made to survival businesses and also to supplement the evidence in the previous section.
4.3. Evidence on Business Purpose from Interview Data
In this section, I provide some evidence on the purposes for which MFIs provide loans. These data were not systematically collected, but I believe they are still useful because they provide evidence on the purpose for which the loans were taken and the sectors in which the loan recipients worked, something that is not much reported on in the literature. My data comes from three different sources. The first source is interviews that I conducted with twenty-five microfinance clients who obtained business loans in and around Nairobi, Kenya, in January, 2015; seven of these were clients of Kiva, while the remaining were clients of Rafiki Bank from branches in and around Nairobi.23 The average loan size for the Rafiki clients was KSh 467,500 (around US$4675), while those of the Kiva clients was KSh 46,667 (around US$467). The second source is information provided by Kiva, Kenya, on nineteen different clients, all from Nairobi slums. I do not have loan size information for these clients, but judging from the location of their businesses, they would be classified as very poor and their businesses as survival enterprises. The third source is from 18 additional interviews that I conducted; all of these were microfinance clients of Kiva. The average size of the last loan obtained by these clients was KSh 26,667 (around US$267). What we can see from the above client descriptions, though, is that Kiva clients obtained much smaller loans than Rafiki clients and we should consider them separately. Table 6 provides information on the business sectors in which the clients who received these loans worked.
In Table 6, we see that a large proportion of the recipients of these enterprise loans were in retail businesses of some kind; the percentages are 64% for Kiva clients and 44% for Rafiki clients. A further 23% of Kiva clients were in service businesses, while 22% of Rafiki clients were in service businesses. Most of these borrowers were not highly educated. Of the clients that I personally interviewed (both Rafiki and Kiva), only 31 out of the 40 that provided me with information on their educational background had finished their Form IV, which in Kenya is equal to a high school diploma. Out of these 31, 68% (21 clients) had engaged in some kind of further study, but not necessarily towards a degree. In other words, these are not highly qualified individuals. Of the individuals that I interviewed in the summer of 2015, the average savings of those who responded was KSh 14,000, which barely works out to US$ 140. While this is not systematic evidence, it does suggest that many MFI clients in East Africa have little by way of skills and are being given loans for businesses where there is a great deal of competition and entry into the sector is easy. If this is the situation in Nairobi, it is unlikely to be better in rural areas of East Africa.
5. Conclusions and Suggestions for Future Work
In this paper, I have tried to show the importance of examining the market environment in the provision of microfinance loans, something which has been missing from the existing literature. By looking at the equilibrium effect of multiple loans made by one or more MFIs operating in a given location, I show that the impact in isolated, rural areas is likely to be negative. Based on this analysis, I go on to make specific recommendations for loans with the kinds of business purposes that would have the greatest likelihood of leading to sustainable enterprises. These recommendations are relevant not only for the MFIs themselves, but also for other public organizations working in these areas, whether they be NGOs or local, regional and national governments. I then looked at data from MFIs worldwide that suggested that MFIs are not currently considering the market environment and market structure when they make their loans. I follow this up with a specialized database of interviews from in and around Nairobi, Kenya, to throw some light on where MFI loan monies are actually directed. Analyzing the businesses that these borrowers are involved in, I show that most of them are in petty trade, petty manufacturing or small-scale service businesses. Although we cannot make definitive inferences from these numbers, they suggest that the impact on poverty alleviation is unlikely to be great, given my prior theoretical analysis.
Future work should follow certain lines of inquiry based upon my theoretical analysis above and based on the theories of Bateman (2007). Some questions that are relevant to my analysis are:
- What do business size transition matrices look like? In which industries is there a sink at the lowest levels?
- What is the likelihood of getting larger and larger loans for MFI clients and which industries do they tend to be in?
- Is there a relationship between firm size and the probability of loan repayment?
- What is the geographical area over which firms sell their products/services? Is this localized or at the national or provincial or global level?
- Are the outputs of the firm sold to other businesses or to final consumers?
- What are the Herfindahl indices across industries and does this have any relationship to concentration of small firms?
- What is the level of human capital possessed by borrowers? Do they have access to business expertise? Is there any correlation between human capital and success? Is there any connection between human capital and what industries borrowers go into? Is there any connection between human capital and where borrowers get their money from?
- Do loan sizes increase over time? Do borrowers move from informal lending/MFIs to other sources for their loans? Do they reduce the number of activities in which they are involved?24 Does the number of people employed increase over time?
In addition to steps that MFIs can take in terms of where they direct their funds, clearly government policy has a significant role to play, as well. Acquisition of physical capital is important to allow entrepreneurs to operate at larger and more efficient scales and to permit them to compete in regional and global markets. Competition in regional and global markets will also require industry-friendly government policies directed towards local development which would not necessarily stifle desirable local competition, but which would provide services, such as export insurance and credit for exporting firms in addition to ensuring that there are no tariff and other barriers to exports. Development of industrial districts of the sort successfully created by China and enabling of vertical sub-contracting (this does not necessarily require state intervention) would also “embed a sustainable growth and development trajectory in place” (Bateman 2007, p. 216).
Acknowledgments
The author thanks Kiva and Rafiki Bank for helping him with access to data. The author also thanks two anonymous referees for helping him greatly improve the presentation of the arguments in the paper.
Conflicts of Interest
The authors declare no conflict of interest.
Appendix
A.1. Additional Evidence from MixMarket Data Analysis
In this appendix, I provide detailed results of my panel regressions in addition to the base specification that is reported in the body of the paper. I start with the PAR30 regressions (Table A1). For the baseline specification (specification 1 reproduced here from Table 5 to facilitate comparison), we saw that PAR30 for non-profits is not significantly different than for non-profits. We do see that loans made by MFIs that are rural banks tend to have a statistically significantly greater PAR30 rate compared to the other categories, except for banks. Finally, loans made in Africa (regionind = 1) have a statistically significantly higher PAR30 percentage than loans made elsewhere. I now re-run my baseline regression, but this time include a few additional variables that are available for most of the MFI/year units: ROA, MFI size (proxied by ln(assets)), avlbalgnp (available loan balance per borrower/GNP per capita) (specification 2).25 At this point, I do not add the other variables that measure loan characteristics because I have many fewer observations for those variables. We see that my results from specification 2 are very similar to those from specification 1. As before, there is no difference between the PAR30 ratio for non-profits and for-profits. The coefficient for rural banks (omitted variable) is significantly higher than that for all other categories, including banks. The PAR30 ratio for Africa is significantly higher than that for all other regions. Consistent with my expectations, larger firms, and more (ROA) profitable firms have lower PAR30 ratios, but the size of the loan does not have a significant relationship with the PAR30 ratio. It is interesting to see that including the ROA variable does not really change the qualitative relationship of the other variables with the PAR30 ratios, substantiating my earlier assumption that PAR30 was a better proxy for profitability of client businesses than MFI profitability.

Table A1.
PAR30 panel regressions.
| Variable/Specification | 1 | 2 | 3 | 4 |
|---|---|---|---|---|
| 1. profstatind | −0.01193 (−1.42) | −0.00948 (−1.3) | −0.0506 (−2.79) | −0.03889 (−3.7) |
| legstatind | ||||
| 0 | −0.00927 (−0.69) | −0.03567 (−2.79) | −0.08648 (−1.96) | −0.04918 (−2.39) |
| 1 | −0.03505 (−2.51) | −0.05013 (−3.92) | −0.20012 (−4.51) | −0.10735 (−5.1) |
| 2 | −0.04266 (−3.64) | −0.05537 (−5.08) | −0.16281 (−4.06) | −0.07765 (−4.25) |
| 3 | −0.05554 (−4.12) | −0.07063 (−5.75) | −0.20274 (−4.78) | −0.11919 (−5.93) |
| regionind | ||||
| 0 | −0.0453 (−4.8) | −0.02336 (−2.7) | −0.03409 (−1.29) | −0.02408 (−1.78) |
| 2 | −0.06386 (−8.41) | −0.0332 (−4.66) | −0.01295 (−0.57) | −0.03112 (−2.63) |
| 3 | −0.05397 (−3.82) | −0.02349 (−1.89) | −0.03052 (−0.95) | −0.03721 (−2.07) |
| 4 | −0.04155 (−6.04) | −0.02019 (−3.1) | −0.02221 (−1.06) | −0.02833 (−2.75) |
| 5 | −0.05621 (−7.17) | −0.03497 (−4.82) | −0.03546 (−1.56) | −0.02489 (−2.18) |
| avlbalgnp | −0.00154 (−1.27) | −0.00533 (−1.12) | −0.00355 (−1.49) | |
| lnassets | −0.00285 (−2.68) | −0.00621 (−2.0) | −0.00657 (−3.87) | |
| roa | −0.17799 (−12.55) | −0.15775 (−3.02) | −0.15962 (−7.05) | |
| indivp | 0.020516 (0.88) | 0.037013 (2.97) | ||
| solidarityp | 0.017764 (0.72) | 0.013556 (1.06) | ||
| vgbankp | omitted | (omitted) | ||
| microfinp | −0.01381 (−0.25) | |||
| smefinp | 0.01136 (−0.2) | |||
| lgcorpfinp | omitted | |||
| urbanp | −0.01589 (−0.94) | |||
| ruralp | omitted | |||
| _cons | 0.164985 (11.96) | 0.201566 (9.73) | 0.397287 (4.51) | 0.290276 (8.02) |
| No. of observations | 10996 | 9707 | 1368 | 3745 |
| Overall R-square | 0.0157 | 0.0317 | 0.0419 | 0.0428 |
Explanation of bariables: legstatind: 0: Bank, 1: Credit Union/Cooperative Bank, 2: Non-banking Financial Institution, 3: NGO, 4: Rural Bank (omitted), 5: Other; profstatind: 0: Non-profit (omitted), 1: profit; regionind: 0: East Asia and the Pacific, 1: Africa (omitted), 2: Eastern Europe and Central Asia, 3: Middle East and North Africa, 4: Latin America and The Caribbean, 5: South Asia. Values significant at the 5% level (one-sided test) indicated in bold.
My third regression (specification 3) involves adding three more sets of variables—(i) variables identifying the lending methodology of the MFI (indivp, solidarity, and vgbankp); (ii) variables identifying the nature of the business to which the loan was made, if it is an enterprise loan (microfinp, smefinp, and lgcorpfinp); and (iii) variables identifying whether the loan is made in a rural area or in an urban area. In addition to being available for many fewer MFI/year units, these data also seem to be more problematic. For example, the proportion of all loans made using the three different lending methodologies is sometimes greater than unity, and in a few instances, less than one. I assigned missing values to all observations where the sum of the proportions added to more than unity, and renormalized the three variables, so that they added up to unity. Similarly, I assigned missing values to all observations where the sum of the proportions describing the kind of business enterprise to which an enterprise loan was made (microfinp, smefinp, and lgcorpfinp) was greater than unity, and rescaled the remaining observations so that the proportions added up to unity. Finally, I assigned missing values to observations where the proportion of urban and rural loans added up to more than unity and renormalized the two observations so that their sum added up to unity. As a result of this, I had to drop one variable in each set of variables due to multicollinearity.
Perhaps due to the paucity of data or the quality of the data, these variables turned out to be insignificant in specification 3. Since the unavailability of data for these variables differs from MFI to MFI, I run separate regressions including first one set of variables at a time and then including pairs of sets of variables. However, the only occasion on which any of these variables was significant was when I included the lending methodology variable set alone. In this case, the results were different from expected; as explained above, I expected the village bank methodology to produce the highest PAR30 ratio, but in point of fact, it had the lowest ratio, conditional on the other explanatory variables and its PAR30 ratio was actually statistically significantly lower than that for loans made using the individual methodology. The paucity of data, though, calls these results in question, especially since it is likely that the smallest and least profitable MFIs are the ones that have incomplete data submissions to MixMarket.
The next set of regressions uses the loan loss rates as independent variables. The results from these regressions can be found in Table A2. The baseline regression, as before, is specification 1. Nonprofit MFIs have lower loan loss rates, contrary to expectations. The legal status of the MFIs does not matter, but Africa, once again, has the highest loan loss rates, as hypothesized. When I include the return on assets (ROA), MFI size (lnassets) and loan size (avlbalgnp) in specification 2, the significance of the region variables mostly disappears because of the effect of the ROA variable, which is strongly significant and has a negative coefficient, as hypothesized. Specification 3, with all my variables, leaves only the ROA as significant. Finally, when I include the three sets of variables measuring the rural/urban, the lending methodology and the enterprise type dimensions singly and in pairs, the only specification that is significant (and reported in specification 4) is the urban/rural category; here we find, contrary to my expectations, that urban loans have a higher loan loss rate relative to rural loans. Overall, we see that the loan loss rate, by and large, is not related to my explanatory variables with the exception of ROA. This may well be due, as I pointed out earlier, to the fact that the loan loss rate depends on subjective decisions made by management, decisions which will affect the reported MFI profitability adversely and, hence, may be strategic.
Table A2.
Loan loss rate panel regressions.
| Llossrat | 1 | 2 | 3 | 4 |
|---|---|---|---|---|
| 1. profstatind | 0.019298 (1.85) | 0.015588 (1.25) | 0.033509 (1.16) | 0.019737 (1.39) |
| legstatind | ||||
| 0 | 0.000916 (0.05) | −0.00268 (−0.13) | −0.03022 (−0.42) | −0.01321 (−0.45) |
| 1 | 0.015679 (0.79) | 0.017002 (0.82) | 0.008781 (0.12) | 0.006725 (0.22) |
| 2 | 0.022294 (1.31) | 0.013306 (0.75) | 0.012655 (0.19) | 0.010489 (0.4) |
| 3 | 0.025298 (1.35) | 0.019357 (0.97) | 0.034672 (0.5) | 0.022688 (0.78) |
| Regionind | ||||
| 0 | −0.03459 (−2.71) | −0.01181 (−0.84) | −0.00309 (−0.08) | −0.01155 (−0.61) |
| 2 | −0.02831 (−2.62) | 0.00793 (0.68) | 0.046346 (1.27) | 0.018381 (1.2) |
| 3 | −0.03212 (−1.8) | −0.01141 (−0.53) | −0.00902 (−0.18) | −0.00831 (−0.36) |
| 4 | −0.02172 (−2.29) | −0.00143 (−0.13) | 0.002385 (0.07) | −0.00404 (−0.29) |
| 5 | −0.03898 (−3.61) | −0.02204 (−1.84) | −0.00562 (−0.16) | −0.01508 (−0.99) |
| avlbalgnp | −0.00092 (−0.65) | −0.00117 (−0.16) | −0.0006 (−0.19) | |
| lnassets | 0.001356 (−0.98) | 0.003612 (0.74) | 0.002493 (1.07) | |
| roa | −0.10177 (−6.62) | −0.08754 (−10.8) | −0.06067 (−1.9) | |
| indivp | 0.005815 (0.16) | |||
| solidarityp | 0.00229 (0.06) | |||
| vgbankp | Omitted | |||
| microfinp | 0.037856 (0.46) | |||
| smefinp | 0.074524 (0.85) | |||
| lgcorpfinp | Omitted | |||
| urbanp | 0.039031 (1.47) | 0.022743 (1.80) | ||
| ruralp | Omitted | 0 | ||
| _cons | 0.022113 (1.12) | −0.01191 (−0.41) | −0.13349 (−0.96) | −0.04582 |
| No. of observations | 9593 | 9007 | 1226 | 3110 |
| Overall R-square | 0.0026 | 0.0083 | 0.0016 | 0.0074 |
Explanation of variables: legstatind: 0: Bank, 1: Credit Union/Cooperative Bank, 2: Non-banking Financial Institution, 3: NGO, 4: Rural Bank (omitted), 5: Other; profstatind: 0: Non-profit (omitted), 1: profit; regionind: 0: East Asia and the Pacific, 1: Africa (omitted), 2: Eastern Europe and Central Asia, 3: Middle East and North Africa, 4: Latin America and The Caribbean, 5: South Asia. Values re significant at the 5% level (one-sided test) indicated in bold.
A.2. Evidence from the MixMarket Data Analysis for African MFIs
Since Africa is of particular interest to us, as discussed above, I re-run the regressions for African MFIs alone (Table A3). These results for PAR30 are similar to those obtained above, particularly when I include loan size and MFI size and profitability as additional explanatory variables. For this specification (2), smaller loans have larger PAR30 ratios, as do loans made by smaller (lnassets) and less profitable MFIs (ROA). Loans made by rural banks have the highest PAR30 values, as well. For specification 1, when I do not include the additional explanatory variables, I find that loans made by credit unions/cooperatives have the largest PAR30 ratios, contrary to my expectations. This may be because “most MFIs in sub-Saharan Africa are dominated by cooperatives and NGOs with dominant social performance goals” (Abdulai and Tewari 2017). Furthermore, cooperatives by their very nature tend not to be profit-seeking, particularly in Africa. When all variables were included, the sample size dropped dramatically, ROA was unexpectedly positively related to PAR30 but, as before, smaller MFIs had larger PAR30 ratios. The behavior of the Legal Status variables was different from previous regressions, with banks and NBFIs having the highest PAR30 ratios; it must be noted, however, that there are no observations for rural banks, in this sample.
Table A3.
PAR30 Panel regressions for Africa alone.
| Dependent Variable | PAR30 | PAR30 | PAR30 | Llossrat | Llossrat | Llossrat |
|---|---|---|---|---|---|---|
| Variable/Specification | 1 | 2 | 3 | 1 | 2 | 3 |
| 1. profstatind | −0.04188 (−1.15) | −0.04171 (−1.36) | −0.10469 (−1.62) | 0.04829 (0.65) | 0.012499 (0.68) | 0.012451 (0.57) |
| legstatind | ||||||
| 0 | 0.125365 (3.52) | 0.035108 (0.99) | 0.245021 (2.94) | 0.017683 (0.16) | 0.013404 (0.47) | 0.042129 (1.37) |
| 1 | −0.02467 (−0.52) | −0.04325 (−1.01) | 0.087298 (1.72) | 0.070452 (0.57) | 0.024481 (0.78) | 0.027458 (1.47) |
| 2 | −0.0288 (−0.87) | −0.05205 (−1.65) | 0.204299 (2.79) | 0.082048 (0.8) | 0.013359 (0.51) | 0.013161 (0.54) |
| 3 | −0.08665 (−1.75) | −0.11197 (−2.54) | Omitted | 0.073644 (0.59) | 0.032635 (1.04) | Omitted |
| 4 | Omitted | Omitted | Empty | Omitted | Omitted | Empty |
| avlbalgnp | −0.00409 (−1.81) | 0.007299 (0.42) | 0.000186 (0.09) | 0.000228 (0.04) | ||
| lnassets | −0.00641 (−2.2) | −0.03491 (−4.26) | −0.00149 (−0.56) | −0.00348 (−1.21) | ||
| roa | −0.1061 (−4.11) | 0.236563 (2.04) | −0.0912 (−2.44) | 0.012768 (0.5) | ||
| indivp | 0.058392 (0.69) | −0.07268 (−2.37) | ||||
| solidarityp | 0.066238 (0.85) | −0.08876 (−3.23) | ||||
| vgbankp | Omitted | Omitted | ||||
| microfinp | 0.233164 (0.83) | −0.01504 (−0.17) | ||||
| smefinp | 0.350036 (1.23) | −0.00141 (−0.02) | ||||
| lgcorpfinp | Omitted | Omitted | ||||
| urbanp | −0.03394 (−0.7) | −0.00351 (−0.22) | ||||
| ruralp | Omitted | Omitted | ||||
| _cons | 0.17233 | 0.281266 (4.62) | 0.278999 (0.9) | −0.03853 (−0.32) | 0.02424 (0.48) | 0.147301 (1.45) |
| No. of observations | 1790 | 1382 | 117 | 1449 | 1287 | 102 |
| Overall R-square | 0.0201 | 0.0476 | 0.3048 | 0.0016 | 0.0043 | 0.2375 |
Explanation of Variables: legstatind: 0: Bank, 1: Credit Union/Cooperative Bank, 2: Non-banking Financial Institution, 3: NGO, 4: Rural Bank, 5: Other; profstatind: 0: Non-profit (omitted), 1: profit; regionind: 0: East Asia and the Pacific, 1: Africa, 2: Eastern Europe and Central Asia, 3: Middle East and North Africa, 4: Latin America and The Caribbean, 5: South Asia. Some variables had no valid observations for some specifications and are denoted as empty. Omitted variables are noted. Values significant at the 5% level (one-sided test) indicated in bold.
For the loan loss rate regressions, specification 1, with only the profit status and legal status variables included is completely lacking in explanatory power. When loan size relative to GNP, MFI size, and ROA are added, ROA shows up significant with less profitable MFIs having higher loan loss rates. When all variables are included, the sample size, as before, drops greatly. We see, however, that MFIs using village bank lending methodology tend to have the highest loan loss rates as expected.
References
- Abdulai, Adams, and Devi Datt Tewari. 2017. Trade-off between outreach and sustainability of microfinance institutions: evidence from sub-Saharan Africa. Enterprise Development and Microfinance 28: 162–81. [Google Scholar] [CrossRef]
- Adjei, Joseph Kimos, Thankom Arun, and Farhad Hossain. 2009. The Role of Microfinance in Asset Building and Poverty Reduction: The Case of Sinapi Aba Trust of Ghana. Manchester: Brooks World Poverty Institute. [Google Scholar]
- Annim, Samuel Kobina. 2012. Targeting the poor versus financial sustainability and external funding: Evidence of microfinance institutions in Ghana. Journal of Development Entrepreneurship 17. [Google Scholar] [CrossRef]
- Barnes, Carolyn, Gary Gaile, and Richard Kibombo. 2001a. The Impact of Three Microfinance Programs in Uganda; Washington: Development Experience Clearinghouse, USAID.
- Barnes, C., Erica Keogh, and Nontokozo Nemarundwe. 2001b. Microfinance Program Clients and Impact: An Assessment of Zambuko Trust Zimbabwe. Washington: Assessing the Impact of Microenterprise Services (AIMS). [Google Scholar]
- Bateman, Milford. 2007. De-industrialization and social disintegration in Bosnia. In What’s Wrong with Microfinance. Edited by Thomas Dichter and Malcolm Harper. Rugby: Practical Action Publishing. [Google Scholar]
- Bateman, Milford. 2010. Why Doesn’t Microfinance Work. London: Zed Books. [Google Scholar]
- Bauchet, Jonathan, Cristobal Marshall, Laura Starita, Jeanette Thomas, and Anna Yalouris. 2011. Latest Findings from Randomized Evaluations of Microfinance. Access to Finance Forum Reports by CGAP and Its Partners No. 2, December 2011. Washington: Consultative Group to Assist the Poor. [Google Scholar]
- Cotter, Jim. 1996. Distinguishing between Poverty Alleviation and Business Growth. Small Enterprise Development 7: 49–53. [Google Scholar] [CrossRef]
- Cull, Robert, Asli Demirgüç-Kunt, and Jonathan Morduch. 2007. Financial Performance and Outreach: A Global Analysis of Leading Microbanks. The Economic Journal 117: F107–33. [Google Scholar] [CrossRef]
- Cull, Robert, Asli Demirgüç-Kunt, and Jonathan Morduch. 2009. Microfinance Meets the Market. The Journal of Economic Perspectives 23: 167–92. [Google Scholar] [CrossRef]
- Duflo, Esther. 2005. Gender Equality in Development. Working Paper, Massachussetts Institute of Technology. Available online: http://citeseerx.ist.psu.edu/viewdoc/summary?doi=10.1.1.592 (accessed on 19 December 2017).
- Easterly, William. 2006. The White Man’s Burden: Why the West’s Efforts to Aid the Rest Have Done So Much Ill and So Little Good. London: The Penguin Press. [Google Scholar]
- Epstein, Marc, and Kristi Yuthas. 2010. Microfinance in Cultures of Replacement. Journal of Development Entrepreneurship 15: 35–54. [Google Scholar] [CrossRef]
- Fafchamps, Marcel. 2003. Market Institutions in Sub-Saharan Africa: Theory and Evidence. Cambridge: MIT Press. [Google Scholar]
- Fitzgibbon, Catherine, and Courtenay Cabot Venton. 2014. Financial Graduation Feasibility Study. Nairobi: FSD Kenya. [Google Scholar]
- Ghate, Prabhu, Evelinda Ballon, and Virginia Manalo. 1996. Poverty alleviation and enterprise development: The need for a differentiated approach. International Development 8: 163–78. [Google Scholar] [CrossRef]
- Hermes, Neil, and Robert Lensink. 2007. The Empirics of Microfinance: What do We Know? The Economic Journal 117: F1–10. [Google Scholar] [CrossRef]
- Hossain, Shahadat. 2013. Is Commercialization of Microfinance Responsible for Over-Indebtedness? The Case of Andhra Pradesh Crisis. Journal of Economics and Sustainable Development 4: 142–53. [Google Scholar]
- Johnston, Don, and Jonathan Morduch. 2007. Microcredit vs. Microsaving: Evidence from Indonesia. Working Paper. New York, NY, USA: New York University. [Google Scholar]
- Karlan, Dean, and Jonathan Zinman. 2011. Microcredit in Theory and Practice: Using Randomized Credit Scoring for Impact Evaluation. Science 332: 1278–84. [Google Scholar] [CrossRef] [PubMed]
- Kiiru, Joy, and John Mburu. 2006. User Costs of Joint Liability Borrowing and their Effect on Livelihood Assets for Rural Poor Households. International Journal of Women, Social Justice and Human Rights 2: 87–100. [Google Scholar]
- Kipesha, Erasmus F., and Xianzhi Zhang. 2013. Sustainability, profitability and outreach trade-off: Evidence from microfinance institutions in east Africa. European Journal of Business and Management 5: 2222–839. [Google Scholar]
- Kpolovie, Peter J., S. Ewansiha, and M. Esara. 2017. Continental Comparison of Human Development Index (HDI). International Journal of Humanities Social Sciences and Education 4: 9–27. [Google Scholar]
- Krishna, Anirudh, and Devendra Bajpai. 2011. Lineal Spread and Radial Dissipation: Experiencing Growth in Rural India, 1993–2005. Economic and Political Weekly 46: 44–51. [Google Scholar]
- Mair, Johanna, and Ignasi Marti. 2007. Entrepreneurship for social impact: Encouraging market access in rural Bangladesh. Corporate Governance 7: 493–501. [Google Scholar] [CrossRef]
- Makame, A.H., and V. Murinde. 2006. Empirical Findings on Cognitive Dissonance around Microfinance Outreach and Sustainability. Unpublished paper. Birmingham, UK: University of Birmingham. [Google Scholar]
- Minten, Bart, Lalaina Randrianarison, and Johan Swinnen. 2006. Global Retail Chains and Poor Farmers: Evidence from Madagascar. LICOS Centre for Transition Economies Discussion Paper No. 164/2006. Leuven, Belgium: Katholieke Universiteit Leuven. [Google Scholar]
- Mix. 2015. Global Outreach & Financial Performance Benchmark Report—2015. Washington: Mix. [Google Scholar]
- Morduch, Jonathan. 2011. Why Finance Matters. Science 332: 1271–72. [Google Scholar] [CrossRef] [PubMed]
- Morduch, Jonathan. 2013. How Microfinance Really Works. The Milken Institute Review Second Quarter, 51–59. [Google Scholar]
- Mosley, Paul, and David Hulme. 1998. Microenterprise finance: Is there a conflict between growth and poverty alleviation? World Development 26: 783–90. [Google Scholar] [CrossRef]
- Nanor, Michael A. 2008. Microfinance and Its Impact on Selected Districts in Eastern Region of Ghana. Kumasi: College of Art and Social Sciences, Kwame Nkrumah University of Science and Technology. [Google Scholar]
- Ouma, Clemencia Osa, and Charles M. Rambo. 2013. The Impact of Microcredit on Women Owned Small and Medium Enterprises: Evidence from Kenya. Global Journal of Business Research 7: 57–69. [Google Scholar]
- Pitt, Mark, and Shahidur Khandker. 1998. The Impact of Group-Based Credit Programs on Poor Households in Bangladesh: Does the Gender of Participants Matter? Journal of Political Economy 106: 858–996. [Google Scholar] [CrossRef]
- Porter, Michael E. 1985. The Competitive Advantage: Creating and Sustaining Superior Performance. New York: Free Press. [Google Scholar]
- Robinson, Marguerite. 2001. The Microfinance Revolution: Sustainable Banking for the Poor. Washington: The World Bank. [Google Scholar]
- Rosenberg, Richard. 2010. What’s the Impact of Loan Size in Microfinance. CGAP Blog. Available online: http://www.cgap.org/blog/whats-impact-loan-size-microfinance (accessed on 8 November 2017).
- Schaffner, Julie. 2014. Development Economics. Hoboken: Wiley. [Google Scholar]
- Shaw, Judith. 2004. Microenterprise Occupation and Poverty Reduction in Microfinance Programs: Evidence from Sri Lanka. World Development 32: 1247–64. [Google Scholar] [CrossRef]
- Shukla, Rajesh. 2010. How India Earns, Spends, and Saves: Unmasking the Real India. New Delhi: Sage Publications. [Google Scholar]
- USAID. 2015. Overview of the Value Chain Approach. Available online: https://www.microlinks.org/good-practice-center/value-chain-wiki/overview-value-chain-approach (accessed on 11 May 2015).
- Van Rooyen, Carina, Ruth Stewart, and Thea de Wet. 2012. The Impact of Microfinance in Sub-Saharan Africa: A Systematic Review of the Evidence. World Development 40: 2249–62. [Google Scholar] [CrossRef]
- Zhang, Quanda. 2017. Does microfinance reduce poverty? Some international evidence. The B.E. Journal of Macroeconomics 17: 1–13. [Google Scholar] [CrossRef]
| 1 | Of course, empirically, it is not easy to distinguish between the two. Even if a loan is given for income-generating purposes, money being fungible, it is likely to be used for other purposes. |
| 2 | Data obtained from the World Bank database (http://databank.worldbank.org). |
| 3 | The Kenyan shilling has fluctuated between KSh 85 per US$ in mid-2011 and KSh 100 on a depreciating trend, with the current rate (November 2017) being around 103. I use a conversion rate of KSH 100 per US$ throughout in the paper. |
| 4 | This group includes hardware shops, bookshops and dry-cleaning outlets. |
| 5 | E3 refers to USAID’s Bureau for Economic Growth, Education, and Environment. |
| 6 | Fitzgibbon and Venton (2014) also look at value chains and make some recommendations similar to those I make in Section 4, but this time from the viewpoint of enabling individual households to be financially self-sufficient. Their work does not include any analysis of the impact of microcredit on product markets. |
| 7 | This does not have to be high-level technology. For example, a Kiva loan recipient that I interviewed in Nairobi (part of the dataset that I analyze in Section 4.3) operates a small-scale shoe manufacturing operation with simple machines, employing three persons! |
| 8 | In Chapter 8, she discusses market equilibrium in developing countries, where transactions costs are very important. |
| 9 | These costs include not just the actual transport costs, but also storage, financing, risk of theft and all transactions costs associated with the transfer of goods from the local market to the external market. For example, selling in the local market may involve fewer information asymmetries than selling in the external market, where the buyer may not be as known to the seller; transfer costs would thus include additional costs deriving from such information asymmetries, e.g., cheating of quantity, quality and terms of the transaction. |
| 10 | This is a reasonable scenario given that microenterprises are usually constrained by liquidity and MFIs also have difficulty in obtaining funds to lend out. There is usually, then, unmet demand for microcredit. Alternatively, the microcredit expansion may be financed by subsidies; in this case, the demand curve would shift downwards and a similar result is likely to ensure, except that the negative effect on producers would be moderated by the lower borrowing costs available. In this case, the existence of unused local resources is also likely to moderate the resulting price increase, if any. |
| 11 | |
| 12 | To make matters worse, in these markets, the elasticity of the demand curve could increase with increased supply: initially, the clientele may be high-income and demand may be very elastic, but as quantities supplied increase, producers have to reach out to low-income clientele, and the demand curve could become quite inelastic (thanks to the referee for this point). |
| 13 | In preparing the data for analysis, I discovered that because of fiscal year changes, in some cases, an MFI had data for two different periods, but designated by the same fiscal year. In these cases, I changed the fiscal year designation for some of the years in a way that made most sense, so as to only include distinct MFI-fiscal year units. I don’t believe that this would make a great difference. Since none of the data variables that I use are flow variables, I did not correct them for the number of months included in a particular fiscal year. |
| 14 | PAR30 is defined as the portion of loans greater than 30 days past due, including the value of all renegotiated loans (restructured, rescheduled, refinanced and any other revised loans) compared to gross loan portfolio. I also redid the analysis with PAR90 with similar results; these results are not reported. |
| 15 | This decision is discretionary only if the MFI is unregulated. If it is regulated, loans are required to be fully provisioned, which means that they are effectively written off. |
| 16 | Kpolovie et al. (2017) report that the average Human Development Index, developed by the United Nations Development Programme (UNDP) was lowest for Africa at 0.5356, followed by Oceania (0.6926), Asia (0.7141), North America (0.7333), South America (0.7379), and Europe (0.8453). Other developmental statistics for the different continents were provided in the Introduction. |
| 17 | To get some quantitative feel for this, we can look at a couple of statistics provided by themix.org. According to Mix (2015), rural banks in Africa had the highest number of borrowers per loan officer (1294) compared to 715 for Credit Unions/Cooperatives, which comes in next. In East Asia and the Pacific, rural banks, NBFIs, NGOs and Credit Union/Cooperatives were all equally low. In South Asia, all MFI types had fairly similar numbers. No rural banks are listed for the other continents. Operating expense for rural banks in Africa was highest at 39.3% as a proportion of the loan portfolio with NGOs coming in next at 30.9%. For East Asia and the Pacific, rural banks and NGOs had equally high numbers; for South Asia, all MFI types had comparable numbers, while no rural banks are listed for the other continents. |
| 18 | Since avlbal (unadjusted loan size) and avlbalgnp (loan size adjusted for GNP per capita) behave very similarly, and, if anything, avlbalgnp tends to show more of a relationship to the dependent variables, I do not report results for avlbal. |
| 19 | Rosenberg (2010) makes an interesting comment about loan sizes. He says: “People tend to see loan size as a rough proxy of client poverty, which appears to be more or less true as long as you say the word “rough” very emphatically. However, the first few loans that an MFI makes to a client typically reflect, not the client’s ability to use and repay the amount, but rather the MFI’s risk management policy (i.e., we will give the client more serious money only after she has established a good track record in repaying small—i.e., low risk—loans). This means that, according to Rosenberg, loan size reflects both the likelihood of repayment and the poverty of the borrower. In any case, he does relate loan size and how poor the borrower is likely to be, which I take to be positively related with the inhospitability of the business environment for borrowers. |
| 20 | I elected to run a random-effects regression rather than a fixed-effects regression for several reasons: one, my MFI-specific variables are likely to vary over time; two, the time period I consider includes the 2007 financial crisis which is likely to cause time variation in the independent variables; three, some of my explanatory variables are time-invariant and, hence, would be perfectly collinear with MFI dummies in a fixed-effects regression. |
| 21 | I drop observations with a value of “Other” for legstatind because I do not know how to interpret this designation; in any case, this only accounts for 240 observations. I also deleted observations that were neither marked for-profit or non-profit; this accounted for 981 observations. |
| 22 | The detailed results from the loan loss regressions are also discussed in the Appendix. |
| 23 | Rafiki clients not from Nairobi branches were from Thika, Ruiru, Rongai, and Kitengela; all areas were within 15 miles of Nairobi. |
| 24 | Involvement in several disparate activities at the same time is often an indication of the need for diversification in income sources, which also bespeaks informality and lack of success. |
| 25 | I also tried the available loan balance by itself; it was always insignificant and always less significant than avlbalgnp. |
Figure 1.
High transfer costs and an autarky economy for the local market.

Figure 2.
Low transfer costs and an exporting economy for the local market.

Table 1.
List of proxy variables for an inhospitable business environment.
| Proxy Variable for Inhospitable Business Environment | Description | Category Expected to be Correlated with Business Unprofitability/Expected Sign |
|---|---|---|
| Profit Status | Values for this categorical variable:
| Non-Profit |
| Region of Operation | Values for this categorical variable:
| Africa |
| Legal Status of MFI | Values for this categorical variable:
| Rural Banks |
| Lending Methodology | Percent of gross loan portfolio accounted for by:
| Village Bank methodology |
| Rural/Urban loans | Percent of gross loan portfolio accounted for by loans made in:
| Rural |
| Client firm size | Percent of enterprise loans made to:
| Microenterprises |
| MFI Size | Natural Log of Assets (lnassets) | Negative |
| ROA | Return on Assets (roa) | Negative |
| Loan Size | Average loan balance per borrower (avlbal) | Negative |
| Relative Loan Size | Average loan balance per borrower/GNI per capita (avlbalgnp) | Negative |
Table 2.
Summary statistics for MFIs with differing profit status.
| Panel A: PAR30 | |||||
| Profstatind | mean | sd | max | min | N |
| 0 | 0.070482 | 0.132002 | 5.4845 | 0 | 6107 |
| 1 | 0.072387 | 0.16152 | 7.1143 | 0 | 4889 |
| Total | 0.071329 | 0.145862 | 7.1143 | 0 | 10,996 |
| Test for equality of means: Pr(|T| > |t|) = 0.4963 | |||||
| Panel B: Loan Loss Rate (llossrat) | |||||
| Profstatind | mean | sd | max | min | N |
| 0 | 0.019754 | 0.118193 | 5.584 | 0 | 5359 |
| 1 | 0.031786 | 0.426564 | 25.7075 | 0 | 4234 |
| Total | 0.025065 | 0.29688 | 25.7075 | 0 | 9593 |
| Test for equality of means: Pr(|T| > |t|) = 0.0487 | |||||
Explanation of variables: profstatind: 0: non-profit, 1: for-profit.
Table 3.
Summary statistics for MFIs with different legal status.
| Panel A: PAR30 | |||||
| Legstatind | mean | sd | max | min | N |
| 0 | 0.078495 | 0.288746 | 7.1143 | 0 | 1143 |
| 1 | 0.084382 | 0.119531 | 1.7923 | 0 | 1638 |
| 2 | 0.065119 | 0.123511 | 3.7318 | 0 | 4019 |
| 3 | 0.063763 | 0.106157 | 1 | 0 | 3667 |
| 4 | 0.115053 | 0.144346 | 1.2171 | 0 | 529 |
| Total | 0.071329 | 0.145862 | 7.1143 | 0 | 10,996 |
| Test for equality of all means: F = 20.28, Prob > F = 0.0000 | |||||
| Panel B: Loan Loss Rate (llossrat) | |||||
| Legstatind | mean | sd | max | min | N |
| 0 | 0.017998 | 0.040815 | 0.5972 | 0 | 1035 |
| 1 | 0.019808 | 0.153722 | 4.7395 | 0 | 1399 |
| 2 | 0.034966 | 0.471109 | 25.7075 | 0 | 3459 |
| 3 | 0.021271 | 0.113874 | 5.584 | 0 | 3269 |
| 4 | 0.008402 | 0.021707 | 0.3039 | 0 | 431 |
| Total | 0.025065 | 0.29688 | 25.7075 | 0 | 9593 |
| Test for equality of all means: F = 1.69, Prob > F = 0.1489 | |||||
Explanation of variables: legstatind: 0: bank, 1: credit union/cooperative bank, 2: non-banking financial institution, 3: ngo, 4: rural bank, 5: Other.
Table 4.
Summary statistics for MFIs in different regions.
| Panel A: PAR30 | |||||
| Regionind | mean | sd | max | min | N |
| 0 | 0.075572 | 0.123188 | 1.2171 | 0 | 1183 |
| 1 | 0.103605 | 0.146069 | 1.7923 | 0 | 1790 |
| 2 | 0.058027 | 0.154593 | 5.4845 | 0 | 2012 |
| 3 | 0.056803 | 0.116828 | 0.9434 | 0 | 412 |
| 4 | 0.069372 | 0.084276 | 1 | 0 | 3651 |
| 5 | 0.059574 | 0.221601 | 7.1143 | 0 | 1948 |
| Total | 0.071329 | 0.145862 | 7.1143 | 0 | 10,996 |
| Test for equality of all means: F = 24.82, Prob > F = 0.0000 | |||||
| Panel B: Loan Loss Rate (llossrat) | |||||
| Regionind | mean | sd | max | min | N |
| 0 | 0.013302 | 0.046784 | 0.9907 | 0 | 1113 |
| 1 | 0.048436 | 0.695809 | 25.7075 | 0 | 1449 |
| 2 | 0.021192 | 0.267533 | 9.8906 | 0 | 1712 |
| 3 | 0.016235 | 0.04367 | 0.4446 | 0 | 365 |
| 4 | 0.028386 | 0.054399 | 1.5604 | 0 | 3227 |
| 5 | 0.012535 | 0.067749 | 1.3329 | 0 | 1727 |
| Total | 0.025065 | 0.29688 | 25.7075 | 0 | 9593 |
| Test for equality of all means: F = 2.97, Prob > F = 0.0111 | |||||
Explanation of variables: regionind: 0: East Asia and the Pacific, 1: Africa, 2: Eastern Europe and Central Asia, 3: Middle East and North Africa, 4: Latin America and The Caribbean, 5: South Asia.
Table 5.
Panel regressions.
| Variable/Specification | PAR30 | Llossrat |
|---|---|---|
| 1. profstatind | −0.01193 (−1.42) | 0.019298 (1.85) |
| legstatind | legstatind | |
| 0 | −0.00927 (−0.69) | 0.000916 (0.05) |
| 1 | −0.03505 (−2.51) | 0.015679 (0.79) |
| 2 | −0.04266 (−3.64) | 0.022294 (1.31) |
| 3 | −0.05554 (−4.12) | 0.025298 (1.35) |
| regionind | Regionind | |
| 0 | −0.0453 (−4.8) | −0.03459 (−2.71) |
| 2 | −0.06386 (−8.41) | −0.02831 (−2.62) |
| 3 | −0.05397 (−3.82) | −0.03212 (−1.8) |
| 4 | −0.04155 (−6.04) | −0.02172 (−2.29) |
| 5 | −0.05621 (−7.17) | −0.03898 (−3.61) |
| _cons | 0.164985 (11.96) | 0.022113 (1.12) |
| No. of observations | 10,996 | 9593 |
| Overall R-square | 0.0157 | 0.0026 |
Explanation of variables: legstatind: 0: Bank, 1: credit union/cooperative bank, 2: non-banking financial institution, 3: ngo, 4: rural bank (omitted), 5: other; profstatind: 0: non-profit (omitted), 1: profit; regionind: 0: East Asia and the Pacific, 1: Africa (omitted), 2: Eastern Europe and Central Asia, 3: Middle East and North Africa, 4: Latin America and The Caribbean, 5: South Asia. Values significant at the 5% level (one-sided test) indicated in bold.
Table 6.
Number of loans by business sector.
| Business Sector | Kiva Clients | Rafiki Clients | All Clients | ||
|---|---|---|---|---|---|
| Personal Interviews | Data Provided Directly by Kiva | Total for Kiva Clients | Personal Interviews | Total for All Clients | |
| Agriculture | 1 | 2 | 3 | 4 | 7 |
| Retail | 20 | 8 | 28 | 8 | 36 |
| Service | 4 | 6 | 10 | 4 | 14 |
| Manufacturing | 0 | 3 | 3 | 0 | 3 |
| Trading | 0 | 0 | 0 | 2 | 2 |
| Total | 25 | 19 | 44 | 18 | 62 |
© 2017 by the author. Licensee MDPI, Basel, Switzerland. This article is an open access article distributed under the terms and conditions of the Creative Commons Attribution (CC BY) license (http://creativecommons.org/licenses/by/4.0/).
Share and Cite
MDPI and ACS Style
Viswanath, P.V. Microcredit and Survival Microenterprises: The Role of Market Structure. Int. J. Financial Stud. 2018, 6, 1. https://doi.org/10.3390/ijfs6010001
AMA Style
Viswanath PV. Microcredit and Survival Microenterprises: The Role of Market Structure. International Journal of Financial Studies. 2018; 6(1):1. https://doi.org/10.3390/ijfs6010001
Chicago/Turabian StyleViswanath, P. V. 2018. "Microcredit and Survival Microenterprises: The Role of Market Structure" International Journal of Financial Studies 6, no. 1: 1. https://doi.org/10.3390/ijfs6010001
Note that from the first issue of 2016, this journal uses article numbers instead of page numbers. See further details here.